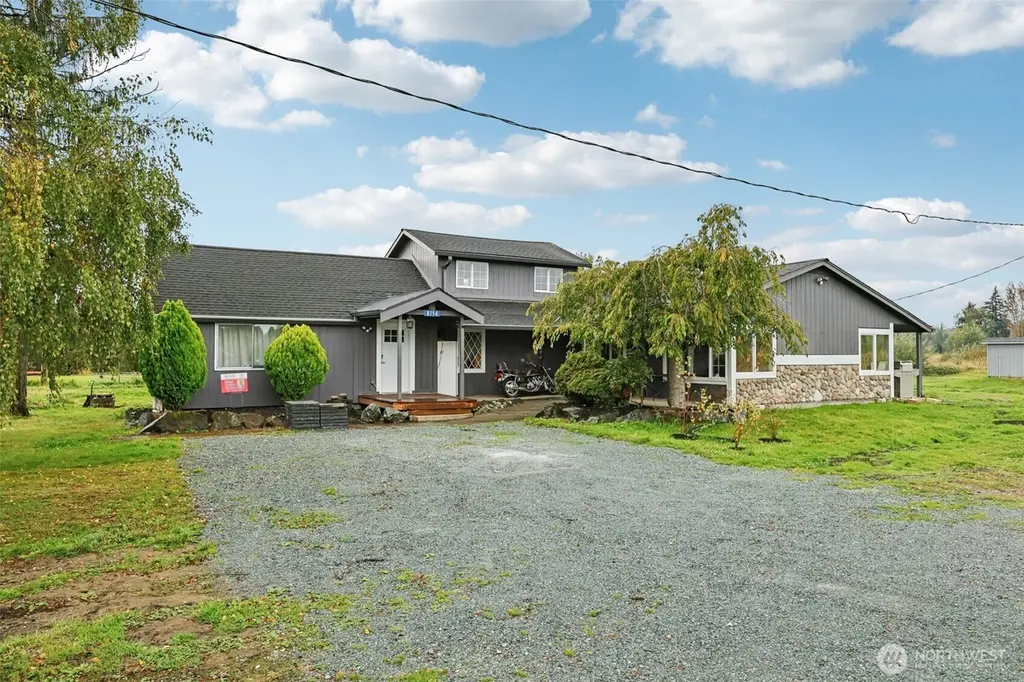
8754 Peavey Rd · Sedro-Woolley, WA
Flood risk 4/10 · Minor
- FEMA flood zone
- X
- Chance of flooding over 30 yrs
- 0.22%
- Est. flood insurance / yr
- $507 – $1,088
Fire risk 4/10 · Minor
- Est. fire insurance / yr
- $604 – $1,122
Heat risk 2/10 · Minimal
- Hot days now (above 83°F)
- 8 days/yr
- Hot days in 30 yrs
- 20 days/yr
Wind risk 1/10 · Minimal
- Chance of severe wind over 30 yrs
- —
Air-quality risk 6/10 · Moderate
- Unhealthy air days now
- 9 days/yr
- Unhealthy air days in 30 yrs
- 10 days/yr
Risk factors via First Street. Map © Google.
Why this score? — see what drove the D grade
The composite is a weighted blend of 9 inputs, each scored 0–100. Each bar is that input's sub-score; the figure is the points it added to the 100-point composite (weight × sub-score).
- ARV discount +15.0/15.0
- Appreciation +10.0/10.0
- Cash flow +5.5/30.0
- Schools +4.7/10.0
- Rent growth +2.5/5.0
- Livability +2.5/5.0
- Condition / age +2.5/5.0
- 1% rule +0.3/10.0
- DSCR +0.0/10.0
$525,000
🖨 Deal sheet 📄 Offer letter ✓ Due diligence
Listing remarks
Tucked away at the end of a quiet gravel road, this property offers an exceptional sense of privacy and tranquility. Set on a full acre with no visible neighbors, it truly feels like a secluded retreat—surrounded by nature, wildlife, and open space—yet still conveniently close to town. The setting is nothing short of special. Peaceful, private, and serene, this home offers the kind of atmosphere most buyers are searching for but rarely find. With room to roam, play, and relax, it’s an ideal environment for those looking to spread out and enjoy a more intentional lifestyle. The home provides generous square footage and has seen numerous tasteful updates throughout. Major im
Key facts
- Secluded retreat
- Open space
- Surrounded by nature
Tags
Neighborhood map
What this means for you Summary
Snapshot
- This is a 4-bed/2.0-bath single-family listed at $525k.
Deal economics
- At list price, monthly cash flow is $-1k ($-13k/yr) — negative.
- To cash-flow at today's rent, offer at most $328k (37.6% below list).
- To meet the 1% rule (rent ≥ 1% of price), the offer needs to be $279k (46.9% below list).
- Recommended offer: $279k (46.9% below list) — sets the bar for 1% rule.
- Cap rate 3.7% vs local median 2.4% in Sedro-Woolley — top-decile yield for the area; either an underpriced asset or a hidden risk that comps aren't pricing in. Stress-test before assuming the spread holds.
Location & tenants
- Location reads: area grade D — affects rentability + tenant quality, not the cash-flow math above.
- Sedro-Woolley School District (suburban): math 47% / reading 58% proficiency, ranked #117 of 291 in WA (top 40%) — acceptable for families but not a draw, mixed tenant base, ~2y average lease.
- Market conditions: 226 active listings in the ZIP; solid renter incomes; 561 units permitted in Skagit County in 2024 (270 in 5+ unit buildings).
- This rent runs 36% of the median local income ($93k/yr) — at the standard rent-burdened threshold; future hikes will face affordability resistance.
Forward outlook
- In year one you build about $56k of equity ($4k loan paydown + $52k appreciation (10.0% local appreciation)).
- Skagit County population projected at +11% by 2050 — modest demand growth; plan on rents tracking national, not racing it.
- By year 2, paydown + projected appreciation supports a ~$90k cash-out refi (75% LTV) — recoverable capital for the next deal without selling this one.
Negotiation context
- It's been on market 105 days — a 9% lower offer ($478k) is reasonable based on typical stale-listing flexibility.
- 2 sale attempts since 5y ago with the ask held roughly flat each time — persistent listings suggest the price (not the market) is what's stuck; bring a comps-based counter.
- Current owner paid $349k; list at $525k implies a 50% gain — meaningful room to come down on a strong offer.
Risks & watch-outs
- Watch-outs: built in 1925 — expect roof / HVAC / electrical / plumbing capex.
Questions for the listing agent
- What do current leases actually rent for vs. the listed asking? Can we see a recent rent roll and the last 12 months of T-12 income?
- It's been on market 105 days. Have you received any prior offers? Is the seller open to a 47% concession, seller financing, or rate buy-down credit?
- Built in 1925 — when were the roof, HVAC, electrical panel, plumbing, and water heater last replaced?
- Why hasn't it sold? Are there any deal-killer items the seller is aware of (foundation, flood, title, zoning, code violations)?
- Is there a deadline driving the sale (1031 exchange, divorce, estate, relocation)? That informs how much negotiation room exists.
- The area grade is low — what's the realistic commute time and amenity access for the typical tenant pool here? Any planned neighborhood developments (good or bad) we should know about?
- What's the average days-on-market for RENTAL listings here right now (not sales)? A rising rental-DOM trend means longer vacancies and softer asking-rent achievability than the comps imply.
- What's the recent tenant-quality profile in this submarket — average credit score on applications, eviction rate, late-payment / NSF rate, and stable-employment percentage? A property-management company in the area should have these aggregated.
- How much new for-sale + rental construction is in the pipeline within 1–3 miles? Heavy new supply typically softens prices + rents 12–24 months out; constrained supply supports both.
Investment metrics
- 1% rule
- 0.53% ✗
- Cap rate
- 3.74%
- Cash-on-cash
- -9.11%
- DSCR
- 0.59
- GRM
- 15.7
CMA / ARV
- ARV (median comp)
- $789,682
- List price
- $525,000
- Delta
- -33.52%
- Verdict
- UNDERPRICED
- Comps
- 4 within 1.0 mi
Show comp detail 1 sale within ~0.75 mi
| Address | Dist | Beds/Ba | Sqft | Sold | Price | $/sf | Match |
|---|---|---|---|---|---|---|---|
| 25807 Minkler Rd | 0.34mi | 4/2.5 | 2,337 (+4%) | 22mo | $685,000 | $293 | 58 |
Match score weights: distance 35% · size 25% · config 20% · recency 20%. Top-matched comps best support the ARV.
Projected returns pro-forma
10.0% appreciation · 3.0% rent growth · sell at horizon
- IRR
- 17.9%
- Equity multiple
- 2.46×
- Total profit
- $214,702
- Equity at exit
- $472,962
- IRR
- 16.7%
- Equity multiple
- 5.68×
- Total profit
- $687,864
- Equity at exit
- $1,019,960
Cash invested: $147,000 (down + closing). Projections, not guarantees.
Landlord ↔ Tenant lean methodology
- Overall (STATE)
- 28 Tenant-Leaning
- State Washington
- 28 Tenant-Leaning · D+8
- County
- — inherits STATE
- City
- — inherits STATE
ZIP-level market 98284
- Home prices YoY
- 3.5%
- Active inventory
- 226
- Price-to-rent
- 15.7×
Monthly cashflow live
- Estimated rent
- $2,789 medium interval (Pro) →
- Mortgage (P&I)
- −$2,753
- Tax from tax record
- −$347 /mo · $4,168/yr
- Insurance
- −$219
- HOA
- −$0
- Vacancy / Maint / Mgmt
- −$586
- Net cashflow
- $-1,116
Break-even live
UW: 25.0% down · 7.5% · 30yr · 1.5% tax · 5.0% vac · 8.0% maint · 8.0% mgmt
Financing live
Cash to close
- Down payment
- $131,250
- Closing costs
- $15,750
- Reserves months
- —
- Total cash needed
- —
Loan-product check · same deal, 3 products live
Conventional
25% down · 7.5% · 30yr
- Down + closing
- —
- Monthly P&I
- —
- Monthly cashflow
- —
- DSCR
- —
- Eligible?
- —
Personal DTI + credit; lowest rate.
DSCR
20% down · 8.5% · 30yr
- Down + closing
- —
- Monthly P&I
- —
- Monthly cashflow
- —
- DSCR
- —
- Eligible?
- —
No personal income docs; deal must DSCR.
Hard money
10% down · 12.0% · 12mo
- Down + closing
- —
- Monthly P&I
- —
- Monthly cashflow
- —
- DSCR
- —
- Eligible?
- —
Short-term bridge; refi at stabilization.
Listing history 21 events
-
2026-06-19days on market $525,000 Active 105 DOM
-
2026-06-18days on market $525,000 Active 104 DOM
-
2026-06-17days on market $525,000 Active 103 DOM
-
2026-06-16days on market $525,000 Active 102 DOM
-
2026-06-15days on market $525,000 Active 101 DOM
-
2026-06-14days on market $525,000 Active 99 DOM
-
2026-06-13days on market $525,000 Active 98 DOM
-
2026-06-10days on market $525,000 Active 96 DOM
-
2026-06-09days on market $525,000 Active 95 DOM
-
2026-06-08days on market $525,000 Active 94 DOM
-
2026-06-07days on market $525,000 Active 93 DOM
-
2026-06-05days on market $525,000 Active 90 DOM
-
2026-06-02days on market $525,000 Active 88 DOM
-
2026-06-01status $525,000 Active 87 DOM
-
2026-05-11status Pending
-
2026-05-07price $525,000
-
2026-02-12$550,000 Active
-
2021-08-31soldstatus $349,000 Closed
-
2021-05-27status Pending
-
2021-04-01$389,000 Active
-
2020-03-20soldstatus $191,350
ⓘ Source: listings_history table (triggers on properties + properties_extension) + one-shot
backfill from property_details.listing_events for pre-trigger history.
Tax reassessment forecast WA · Resets to sale price
- Current annual tax
- $4,168 · $347/mo
- Projected year-2 tax
- $5,145 · $429/mo
- Expected delta
- +$977/yr (+$81/mo · 23.4%)
ⓘ Screening estimate from a state-policy table — verify with the county assessor before closing.
Climate risk First Street
- Flood 4/10 Moderate FEMA zone X · 22% chance over 30 yrs
- Wildfire 4/10 Moderate
- Heat 2/10 Low 8 d/yr ≥83°F today · 20 d/yr by 30 yrs out
- Wind 1/10 Low
- Air quality 6/10 Major 9 unhealthy d/yr today · 10 by 30 yrs out
Nearby sold comps map
Loading sold comps map…
Walkable amenities ~0.75 mi
Loading nearby amenities…
Taxation est. · year 1
- Rental income
- $33,467
- − Mortgage interest
- −$29,408
- − Property taxes
- −$4,168
- − Insurance
- −$2,625
- − Repairs & maintenance
- −$2,677
- − Management
- −$2,677
- − Depreciation
- −$15,273
- Taxable loss
- −$23,362
- Est. tax savings @ 24.0%
- +$5,607
- After-tax cash flow
- $-7,785/yr
For passive investors: Depreciation is non-cash, so a rental often shows a tax loss while cash-flowing — sheltering income. Rental losses are passive: they offset passive income freely, and up to $25,000/yr can offset ordinary (W-2) income if you actively participate and your MAGI is under $100k (phasing out to $0 by $150k); unused losses carry forward. On sale, claimed depreciation is recaptured at up to 25%, and gains may owe capital-gains tax (a 1031 exchange can defer both). Figures are a year-1 estimate at your 24.0% rate — not tax advice; consult a CPA.
Schools (NCES district)
- District
- Sedro-Woolley School District
- NCES district ID
- 5307740
- Math proficiency
- 47% ▼ -2.00%
- Reading proficiency
- 58% ▬ 0.00%
- Median HH income
- $57,385
- Composite
- 47.45/100
- National rank
- #5005
- State rank
- #117 of 291 in WA
Livability — Sedro-Woolley
No livability data for this city. (Only ~50 U.S. cities are tracked.)
Census & demographics
- County
- Skagit County · 118,108 people
- Metro
- Mount Vernon-Anacortes, WA
- Population (ZIP)
- 27,835
- Household income
- $93,006
- Rent vs Own
- Severe rent burden
- 502.0
Population outlook (Skagit County) Hauer SSP2
- Today (2025)
- 131,498 people
- By 2030
- 135,556 · +3.1%
- By 2040
- 141,717 · +7.8%
- By 2050
- 145,714 · +10.8%
- By 2075
- 152,201 · +15.7%
- By 2100
- 147,980 · +12.5%
Race, ethnicity, and origin ACS 2023
- Neighborhood character
- Predominantly White (76%)
- Race & ethnicity
- White 76% Hispanic / Latino 14% Two or more races 8% Asian 2% Native American 1%
- Hispanic origin (detail)
- Mexican 12% Puerto Rican 1%
- Common ancestry
- Portuguese 6% Slovak 4% Italian 3%
- Foreign-born
- 5% · Canada, China
- Languages at home
- 88% English-only · Spanish 10% German/W. Germanic 1%
Political lean MEDSL · Skagit
- 2024 margin
- Lean D (+8.9) · D 52.9% · R 44.0% · Other 3.0%
- 2008→2024 swing
- -0.7pp no change · 2008: 9.6pp · 2024: 8.9pp
- All cycles
- 2024: D+8.9 2020: D+7.5 2016: D+3.2 2012: D+5.8 2008: D+9.6
Not yet ingested
- Civics
- —
Market trends
- HPI YoY
- ▲ 43.42%
- Current HPI
- 1280.83
- Rent YoY
- —
- Metro
- Mount Vernon-Anacortes, WA
- State GDP YoY
- ▲ 4.65%
- F500 in state
- 22
Industry mix (Fortune 500 HQ in WA)
| Industry | F500 HQs | Revenue |
|---|---|---|
| Retail | 2 | $269B |
|
||
| Technology / Retail | 1 | $638B |
|
||
| Technology | 1 | $245B |
|
||
| Telecommunications | 1 | $38B |
|
||
| Food / Beverage | 1 | $36B |
|
||
| Automotive / Trucks | 1 | $34B |
|
||
Price history
+174.4% since first listed7 events — show timeline
- 2026-05-11 Pending — NWMLS as Distributed by MLS Grid
- 2026-05-07 Price Changed $525,000 NWMLS as Distributed by MLS Grid
- 2026-02-12 Listed $550,000 NWMLS as Distributed by MLS Grid
- 2021-08-31 Sold (MLS) $349,000 NWMLS as Distributed by MLS Grid
- 2021-05-27 Pending — NWMLS as Distributed by MLS Grid
- 2021-04-01 Listed $389,000 NWMLS as Distributed by MLS Grid
- 2020-03-20 Sold (Public Records) $191,350 Public Records
Property tax history
-2.7%/yrLatest (2026): $4,168 · -1.0% YoY. Source: county tax records.
Cash-flow waterfall
monthlySold comps — $/sqft
last 12 mo · ≤1 miLoading sold comps…