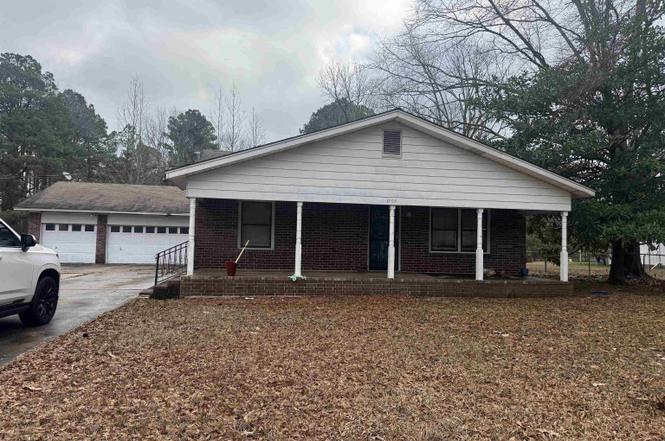
3703 Petty Rd · Sulphur Springs, AR
Flood risk 1/10 · Minimal
- FEMA flood zone
- X (unshaded)
- Chance of flooding over 30 yrs
- 0.0%
- Est. flood insurance / yr
- $507 – $1,088
Fire risk 4/10 · Minor
- Est. fire insurance / yr
- $1,499 – $2,785
Heat risk 6/10 · Moderate
- Hot days now (above 109°F)
- 7 days/yr
- Hot days in 30 yrs
- 19 days/yr
Wind risk 4/10 · Minor
- Chance of severe wind over 30 yrs
- 21.0%
Air-quality risk 1/10 · Minimal
- Unhealthy air days now
- 0 days/yr
- Unhealthy air days in 30 yrs
- 0 days/yr
Risk factors via First Street. Map © Google.
Why this score? — see what drove the C- grade
The composite is a weighted blend of 9 inputs, each scored 0–100. Each bar is that input's sub-score; the figure is the points it added to the 100-point composite (weight × sub-score).
- Cash flow +16.6/30.0
- ARV discount +15.0/15.0
- DSCR +5.2/10.0
- 1% rule +4.1/10.0
- Livability +3.2/5.0
- Rent growth +2.5/5.0
- Condition / age +2.5/5.0
- Schools +1.0/10.0
- Appreciation +0.0/10.0
$149,900
🖨 Deal sheet (PDF) 📄 Offer letter ✓ Due diligence
Listing remarks
Great opportunity that could be your next dream home!! This home has good bones, but does need some work. With 2524 sq ft, 4 bedroom and 2 bath, 2 living areas and a dining room, you have a lot to work with and improve to make it a home again! Sitting on 2 acres and 3 car garage with an extra storage area, gives you ample room for parking and storing your vehicles and mowers to name a few. Priced to sell, this could be your next deal!!!
Key facts
- 2 acre lot
- Garage
- Built 1954
Neighborhood map
What this means for you Summary
Snapshot
- This is a 4-bed/2.0-bath single-family listed at $150k.
Deal economics
- At list price, monthly cash flow is $92 ($1k/yr) — positive.
- The deal already cash-flows at list — no discount required.
- To meet the 1% rule (rent ≥ 1% of price), the offer needs to be $137k (8.9% below list).
- Recommended offer: $137k (8.9% below list) — sets the bar for 1% rule.
- Cap rate 7.0% vs local median 4.4% in Sulphur Springs — top-decile yield for the area; either an underpriced asset or a hidden risk that comps aren't pricing in. Stress-test before assuming the spread holds.
Location & tenants
- Location reads 63/100 on livability (#192 in AR) — a middle-class / working-renter tenant base. Strengths: cost of living A+, housing A+, crime A; Watch: employment C-, amenities F, commute F.
- Watson Chapel School District (urban): math 10% / reading 12% proficiency, ranked #228 of 238 in AR (top 96%) — low school quality limits family demand, transient renter base, plan for 1-2y turnover; 68% free/reduced lunch — lower-income household profile, screen leases tightly.
- Zoned schools: L. L. Owen Elementary School (math 22% / reading 8%, grade F, #406 of 454 statewide, top 90%, 238 students, 100% FRL); Watson Chapel Jr. High School (math 7% / reading 14%, grade F, #194 of 201 statewide, top 96%, 463 students, 100% FRL); Watson Chapel High School (math 8% / reading 12%, grade F, #276 of 292 statewide, top 96%, 497 students, 100% FRL) — zoned schools average 100% FRL vs 68% district-wide (32 pts higher); higher-poverty schools than district average — tighter screening recommended.
- Market conditions: 96 active listings in the ZIP; 62 units permitted in Jefferson County in 2024 (0 in 5+ unit buildings).
Forward outlook
- Local home prices are declining (-3.0%/yr); year-one equity from $1k of loan paydown is wiped out by about $4k of value loss. Plan a longer hold.
- Jefferson County population projected at -33% by 2050 — secular population decline; favor cash flow + early exit over multi-decade hold.
Negotiation context
- It's been on market 53 days — a 3% lower offer ($145k) is reasonable based on typical stale-listing flexibility.
- 4 sale attempts since 9y ago with the ask held roughly flat each time — persistent listings suggest the price (not the market) is what's stuck; bring a comps-based counter.
- Current owner paid $42k; list at $150k implies a 259% gain — meaningful room to come down on a strong offer.
Risks & watch-outs
- Watch-outs: built in 1954 — expect roof / HVAC / electrical / plumbing capex.
- Climate carrying-cost: extreme-heat days projected 7→19/yr by 2055 (HVAC capex compounding) — expect insurance premiums to compound above CPI over the hold.
Questions for the listing agent
- It's been on market 53 days. Have you received any prior offers? Is the seller open to a 9% concession, seller financing, or rate buy-down credit?
- Built in 1954 — when were the roof, HVAC, electrical panel, plumbing, and water heater last replaced?
- Is there a deadline driving the sale (1031 exchange, divorce, estate, relocation)? That informs how much negotiation room exists.
- Schools are F-rated, which usually means shorter tenancies and higher turnover. Who's the typical renter profile here, and what's been the actual vacancy rate?
- What's the average days-on-market for RENTAL listings here right now (not sales)? A rising rental-DOM trend means longer vacancies and softer asking-rent achievability than the comps imply.
- What's the recent tenant-quality profile in this submarket — average credit score on applications, eviction rate, late-payment / NSF rate, and stable-employment percentage? A property-management company in the area should have these aggregated.
- How much new for-sale + rental construction is in the pipeline within 1–3 miles? Heavy new supply typically softens prices + rents 12–24 months out; constrained supply supports both.
Investment metrics
- 1% rule
- 0.91% ✗
- Cap rate
- 7.03%
- Cash-on-cash
- 2.62%
- DSCR
- 1.12
- GRM
- 9.1
CMA / ARV
- ARV (on-the-fly)
- $285,212
- Comps found
- 1
Show comp detail 1 sale within ~0.75 mi
| Address | Dist | Beds/Ba | Sqft | Sold | Price | $/sf | Match |
|---|---|---|---|---|---|---|---|
| 4510 Lowman Rd | 0.65mi | 3/2.5 (-1) | 2,265 (-10%) | 4mo | $255,000 | $113 | 42 |
Match score weights: distance 35% · size 25% · config 20% · recency 20%. Top-matched comps best support the ARV.
Projected returns pro-forma
-3.0% appreciation · 3.0% rent growth · sell at horizon
- IRR
- -12.2%
- Equity multiple
- 0.56×
- Total profit
- $-18,458
- Equity at exit
- $22,351
- IRR
- -3.1%
- Equity multiple
- 0.80×
- Total profit
- $-8,589
- Equity at exit
- $12,961
Cash invested: $41,972 (down + closing). Projections, not guarantees.
Landlord ↔ Tenant lean methodology
- Overall (STATE)
- 92 Strongly Landlord-Friendly
- State Arkansas
- 92 Strongly Landlord-Friendly · R+14
- County
- — inherits STATE
- City
- — inherits STATE
ZIP-level market 71602
- Home prices YoY
- -7.8%
- Active inventory
- 96
- Price-to-rent
- 9.1×
Monthly cashflow live
- Estimated rent
- $1,366 medium interval (Pro) →
- Mortgage (P&I)
- −$786
- Tax from tax record
- −$139 /mo · $1,669/yr
- Insurance
- −$62
- HOA
- −$0
- Vacancy / Maint / Mgmt
- −$287
- Net cashflow
- $92
Break-even live
Sensitivity live
| Price | -10% $177 | -5% $134 | +0% $92 | +5% $49 | +10% $7 |
|---|---|---|---|---|---|
| Rent | -10% $-16 | -5% $38 | +0% $92 | +5% $146 | +10% $200 |
| Rate | -1.0pp $167 | -0.5pp $130 | base $92 | +0.5pp $53 | +1.0pp $13 |
UW: 25.0% down · 7.5% · 30yr · 1.5% tax · 5.0% vac · 8.0% maint · 8.0% mgmt
Financing live
Cash to close
- Down payment
- $37,475
- Closing costs
- $4,497
- Reserves months
- —
- Total cash needed
- —
Loan-product check · same deal, 3 products live
Conventional
25% down · 7.5% · 30yr
- Down + closing
- —
- Monthly P&I
- —
- Monthly cashflow
- —
- DSCR
- —
- Eligible?
- —
Personal DTI + credit; lowest rate.
DSCR
20% down · 8.5% · 30yr
- Down + closing
- —
- Monthly P&I
- —
- Monthly cashflow
- —
- DSCR
- —
- Eligible?
- —
No personal income docs; deal must DSCR.
Hard money
10% down · 12.0% · 12mo
- Down + closing
- —
- Monthly P&I
- —
- Monthly cashflow
- —
- DSCR
- —
- Eligible?
- —
Short-term bridge; refi at stabilization.
Listing history 14 events
-
2026-03-02status Under Contract
-
2026-02-27historical Take Backups
-
2026-01-01$149,900 New Listing
-
2017-11-17soldstatus $41,703
-
2017-10-02status Under Contract
-
2017-09-27status Back on Market
-
2017-09-12status Under Contract
-
2017-09-10status Back on Market
-
2017-09-06status Under Contract
-
2017-09-02price $45,000
-
2017-08-13price $55,500
-
2017-07-15price $65,000
-
2017-05-27$95,000 New Listing
-
2004-09-08soldstatus $110,000
ⓘ Source: listings_history table (triggers on properties + properties_extension) + one-shot
backfill from property_details.listing_events for pre-trigger history.
Tax reassessment forecast AR · Resets to sale price
- Current annual tax
- $1,669 · $139/mo
- Projected year-2 tax
- $1,669 · $139/mo
- Expected delta
- $0/yr ($0/mo · 0.0%)
ⓘ Screening estimate from a state-policy table — verify with the county assessor before closing.
Climate risk First Street
- Flood 1/10 Low FEMA zone X (unshaded) · 0% chance over 30 yrs
- Wildfire 4/10 Moderate
- Heat 6/10 Major 7 d/yr ≥109°F today · 19 d/yr by 30 yrs out
- Wind 4/10 Moderate 21% chance of damaging wind over 30 yrs
- Air quality 1/10 Low 0 unhealthy d/yr today · 0 by 30 yrs out
Nearby sold comps map
Loading sold comps map…
Walkable amenities ~0.75 mi
Loading nearby amenities…
Taxation est. · year 1
- Rental income
- $16,395
- − Mortgage interest
- −$8,397
- − Property taxes
- −$1,669
- − Insurance
- −$750
- − Repairs & maintenance
- −$1,312
- − Management
- −$1,312
- − Depreciation
- −$4,361
- Taxable loss
- −$1,404
- Est. tax savings @ 24.0%
- +$337
- After-tax cash flow
- $1,437/yr
For passive investors: Depreciation is non-cash, so a rental often shows a tax loss while cash-flowing — sheltering income. Rental losses are passive: they offset passive income freely, and up to $25,000/yr can offset ordinary (W-2) income if you actively participate and your MAGI is under $100k (phasing out to $0 by $150k); unused losses carry forward. On sale, claimed depreciation is recaptured at up to 25%, and gains may owe capital-gains tax (a 1031 exchange can defer both). Figures are a year-1 estimate at your 24.0% rate — not tax advice; consult a CPA.
Schools (NCES district)
- District
- Watson Chapel School District
- NCES district ID
- 0513930
- Math proficiency
- 10% ▼ -11.00%
- Reading proficiency
- 12% ▼ -10.00%
- Median HH income
- $40,521
- Composite
- 9.55/100
- National rank
- #9845
- State rank
- #228 of 238 in AR
Livability — Sulphur Springs
- Score
- 63/100
- State rank
- #192
- US rank
- #15295
Category grades
Schools grade is shown separately in the Schools card above.
Census & demographics
- Census place
- Sulphur Springs, AR
- Population (ZIP)
- 15,922
Population outlook (Jefferson County) Hauer SSP2
- Today (2025)
- 63,110 people
- By 2030
- 58,519 · -7.3%
- By 2040
- 49,740 · -21.2%
- By 2050
- 42,331 · -32.9%
- By 2075
- 29,591 · -53.1%
- By 2100
- 21,047 · -66.7%
Race, ethnicity, and origin ACS 2023
- Neighborhood character
- Diverse neighborhood (Simpson 0.56)
- Race & ethnicity
- White 58% Black 32% Two or more races 5% Hispanic / Latino 4% Asian 1%
- Common ancestry
- Italian 1% Slovak 1% Serbian 1%
- Foreign-born
- 2% · Canada
- Languages at home
- 95% English-only · Spanish 3% Other Indo-European 1%
Political lean MEDSL · Jefferson
- 2024 margin
- Strong D (+20.1) · D 59.2% · R 39.2% · Other 1.6%
- 2008→2024 swing
- -6.2pp toward R · 2008: 26.3pp · 2024: 20.1pp
- All cycles
- 2024: D+20.1 2020: D+21.7 2016: D+25.3 2012: D+29.0 2008: D+26.3
Not yet ingested
- Civics
- —
Market trends
- HPI YoY
- ▼ -18.84%
- Current HPI
- 223.9305
- Rent YoY
- —
- Metro
- —
- State GDP YoY
- ▲ 3.80%
- F500 in state
- 10
Industry mix (Fortune 500 HQ in AR)
| Industry | F500 HQs | Revenue |
|---|---|---|
| Retail | 1 | $681B |
|
||
| Food / Agriculture | 1 | $53B |
|
||
| Retail / Energy | 1 | $22B |
|
||
| Transportation / Logistics | 1 | $12B |
|
||
| Energy | 1 | $4B |
|
||
Price history
+36.3% since first listed14 events — show timeline
- 2026-03-02 Pending — CARMLS
- 2026-02-27 Contingent — CARMLS
- 2026-01-01 Listed $149,900 CARMLS
- 2017-11-17 Sold (Public Records) $41,703 Public Records
- 2017-10-02 Pending — CARMLS
- 2017-09-27 Relisted — CARMLS
- 2017-09-12 Pending — CARMLS
- 2017-09-10 Relisted — CARMLS
- 2017-09-06 Pending — CARMLS
- 2017-09-02 Price Changed $45,000 CARMLS
- 2017-08-13 Price Changed $55,500 CARMLS
- 2017-07-15 Price Changed $65,000 CARMLS
- 2017-05-27 Listed $95,000 CARMLS
- 2004-09-08 Sold (Public Records) $110,000 Public Records
Property tax history
+8.6%/yrLatest (2025): $1,669 · +8.3% YoY. Source: county tax records.
Cash-flow waterfall
monthlySold comps — $/sqft
last 12 mo · ≤1 miLoading sold comps…