None · Glenvar Heights, FL
Flood risk 4/10 · Minor
- FEMA flood zone
- X (unshaded)
- Chance of flooding over 30 yrs
- 0.22%
- Est. flood insurance / yr
- $507 – $1,088
Fire risk 1/10 · Minimal
- Est. fire insurance / yr
- $947 – $1,759
Heat risk 10/10 · Severe
- Hot days now (above 105°F)
- 7 days/yr
- Hot days in 30 yrs
- 29 days/yr
Wind risk 10/10 · Severe
- Chance of severe wind over 30 yrs
- 99.0%
Air-quality risk 2/10 · Minimal
- Unhealthy air days now
- 1 days/yr
- Unhealthy air days in 30 yrs
- 1 days/yr
Risk factors via First Street. Map © Google.
Why this score? — see what drove the D grade
The composite is a weighted blend of 9 inputs, each scored 0–100. Each bar is that input's sub-score; the figure is the points it added to the 100-point composite (weight × sub-score).
- Cash flow +10.0/30.0
- ARV discount +7.5/15.0
- 1% rule +6.5/10.0
- Schools +4.2/10.0
- Livability +4.0/5.0
- Rent growth +3.7/5.0
- DSCR +2.9/10.0
- Condition / age +2.5/5.0
- Appreciation +0.0/10.0
$175,000
🖨 Deal sheet 📄 Offer letter ✓ Due diligence
Listing remarks MLS
Updated 1/1 in centrally located Dadeland Park - walking distance to Downtown Dadeland and Metrorail. Unit may be purchased furnished. Seller will be paying remaining balance of special assessment.
Key facts
- Updated bathroom
- $483 HOA
- Garage
Tags
Property features AI
Finance
- Other: Association pool
- Financial info: Lease considered; Pets allowed (maximum 20 lbs)
- HOA & community: Monthly association fee; Association fee includes amenities, common areas, laundry, parking, pool(s), and water; Association amenities: elevator(s), pool
Exterior
- Parking: Assigned parking (1 space); 1 covered space; 1-car garage
- Utilities: Association-managed water
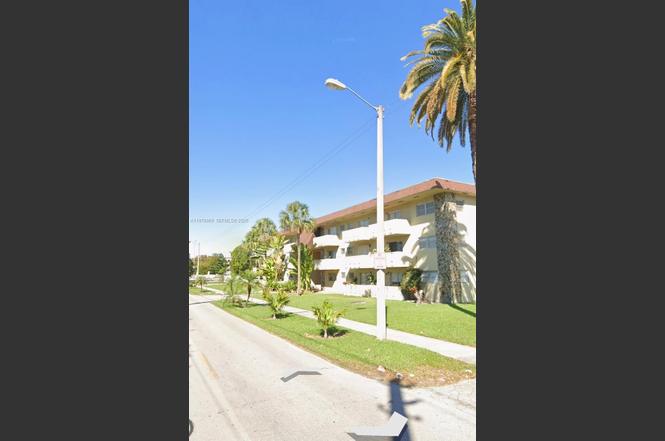
- Home design: Attached property; 3-story building; Faces west; Entry located on level 2; Resale
- Construction: Block construction
- Exterior features: Balcony; Open patio
Interior
- Kitchen: Dishwasher; Electric range; Freezer; Refrigerator
- Flooring: Ceramic tile; Tile
- Bathrooms: 1 full bathroom; 1 half bathroom
- Heating & cooling: Central heating; Central air conditioning
- Interior features: Second-floor entry; Elevator; Living/Dining room; Central vacuum; Unfurnished
- Laundry & utility: Association laundry included
Neighborhood map
What this means for you Summary
Snapshot
- This is a 1-bed/1.0-bath condo listed at $175k.
Deal economics
- At list price, monthly cash flow is $-104 ($-1k/yr) — negative.
- To cash-flow at today's rent, offer at most $157k (10.5% below list).
- Meets the 1% rule at list price ($2k rent vs $175k).
- Recommended offer: $157k (10.5% below list) — sets the bar for cash-flow.
Location & tenants
- Location reads 79/100 on livability (#137 in FL, #2,054 nationally) — a middle-class / working-renter tenant base. Strengths: schools A+, crime A+, commute A+; Watch: amenities F, cost of living F.
- Miami-Dade (suburban): math 45% / reading 54% proficiency, ranked #40 of 73 in FL (top 55%) — families likely to look elsewhere, expect single-tenant / working-renter base with shorter leases; 64% free/reduced lunch — lower-income household profile, screen leases tightly.
- Market conditions: Rents rising fast (+4.9%/yr); 265 active listings in the ZIP; 40 comparable units currently listed for rent nearby; rentals at typical pace (median 14d on market — plan ~3-4 weeks tenant-placement turnaround); solid renter incomes; 10,051 units permitted in Miami-Dade County in 2024 (7,758 in 5+ unit buildings).
Forward outlook
- Local home prices are declining (-3.0%/yr); year-one equity from $1k of loan paydown is wiped out by about $5k of value loss. Plan a longer hold.
- Miami-Dade County population projected at +28% by 2050 — long-run rental-demand tailwind backs the buy-and-hold thesis.
Negotiation context
- It's been on market 71 days — a 6% lower offer ($164k) is reasonable based on typical stale-listing flexibility.
- Current owner paid $75k; list at $175k implies a 133% gain — meaningful room to come down on a strong offer.
Risks & watch-outs
- Watch-outs: HOA is 24% of rent.
- Climate carrying-cost: severe wind risk, 99% chance of damaging wind over 30y; extreme-heat days projected 7→29/yr by 2055 (HVAC capex compounding) — expect insurance premiums to compound above CPI over the hold.
Questions for the listing agent
- What do current leases actually rent for vs. the listed asking? Can we see a recent rent roll and the last 12 months of T-12 income?
- It's been on market 71 days. Have you received any prior offers? Is the seller open to a 11% concession, seller financing, or rate buy-down credit?
- Built in 1967 — when were the roof, HVAC, electrical panel, plumbing, and water heater last replaced?
- What does the HOA fee cover, when was the last increase, and are there any pending special assessments or reserve-fund shortfalls?
- Any open or pending special assessments — roof, HVAC, plumbing, elevator, façade? What's the per-unit balance and payoff schedule, and is the seller paying it off at close or rolling it to the buyer?
- Why hasn't it sold? Are there any deal-killer items the seller is aware of (foundation, flood, title, zoning, code violations)?
- Is there a deadline driving the sale (1031 exchange, divorce, estate, relocation)? That informs how much negotiation room exists.
- Schools are A-rated — typically a magnet for longer-tenancy family renters. What's the average tenant stay here, and is there a school-zone premium baked into asking?
- The area grade is low — what's the realistic commute time and amenity access for the typical tenant pool here? Any planned neighborhood developments (good or bad) we should know about?
- What's the average days-on-market for RENTAL listings here right now (not sales)? A rising rental-DOM trend means longer vacancies and softer asking-rent achievability than the comps imply.
- What's the recent tenant-quality profile in this submarket — average credit score on applications, eviction rate, late-payment / NSF rate, and stable-employment percentage? A property-management company in the area should have these aggregated.
- How much new apartment / multifamily construction is in the pipeline within 1–3 miles? Heavy new supply (>2% of stock underway) typically softens rents 12–24 months out; light construction supports rent growth.
Investment metrics
- 1% rule
- 1.15% ✓
- Cap rate
- 5.58%
- Cash-on-cash
- -2.55%
- DSCR
- 0.89
- GRM
- 7.3
CMA / ARV
No comps found within radius.
Projected returns pro-forma
-3.0% appreciation · 4.93% rent growth · sell at horizon
- IRR
- -17.3%
- Equity multiple
- 0.37×
- Total profit
- $-30,701
- Equity at exit
- $26,093
- IRR
- -4.7%
- Equity multiple
- 0.65×
- Total profit
- $-17,025
- Equity at exit
- $15,131
Cash invested: $49,000 (down + closing). Projections, not guarantees.
Landlord ↔ Tenant lean methodology
- Overall (STATE)
- 87 Strongly Landlord-Friendly
- State Florida
- 87 Strongly Landlord-Friendly · R+3
- County
- — inherits STATE
- City
- — inherits STATE
ZIP-level market 33143
- Rents YoY
- 4.9%
- Active inventory
- 265
- Price-to-rent
- 7.3×
Monthly cashflow live
- Estimated rent
- $2,005 high interval (Pro) →
- Mortgage (P&I)
- −$918
- Tax from tax record
- −$214 /mo · $2,571/yr
- Insurance
- −$73
- HOA
- −$483
- Vacancy / Maint / Mgmt
- −$421
- Net cashflow
- $-104
Break-even live
UW: 25.0% down · 7.5% · 30yr · 1.5% tax · 5.0% vac · 8.0% maint · 8.0% mgmt
Financing live
Cash to close
- Down payment
- $43,750
- Closing costs
- $5,250
- Reserves months
- —
- Total cash needed
- —
Loan-product check · same deal, 3 products live
Conventional
25% down · 7.5% · 30yr
- Down + closing
- —
- Monthly P&I
- —
- Monthly cashflow
- —
- DSCR
- —
- Eligible?
- —
Personal DTI + credit; lowest rate.
DSCR
20% down · 8.5% · 30yr
- Down + closing
- —
- Monthly P&I
- —
- Monthly cashflow
- —
- DSCR
- —
- Eligible?
- —
No personal income docs; deal must DSCR.
Hard money
10% down · 12.0% · 12mo
- Down + closing
- —
- Monthly P&I
- —
- Monthly cashflow
- —
- DSCR
- —
- Eligible?
- —
Short-term bridge; refi at stabilization.
Rent comps 40 comps
| Address | Beds | Baths | Sqft | Rent | $/sqft | DOM | Units | Dist |
|---|---|---|---|---|---|---|---|---|
| 7505 SW 82nd St Miami, FL | 1.0 | 1.0 | 616 | $1,850 | $3.00 | 3d | 3 | 0.02mi |
| 7505 SW 82nd St Miami, FL | 1.0 | 1.0 | 615 | $1,874 | $3.05 | 4d | 2 | 0.02mi |
| 7505 SW 82nd St #212 Miami, FL | 1.0 | 1.0 | 671 | $1,950 | $2.91 | 14d | 1 | 0.02mi |
| 7560 SW 82nd St Unit G112 Miami, FL | 2.0 | 2.0 | 750 | $2,350 | $3.13 | 24d | 1 | 0.07mi |
| 7580 SW 82nd St Unit 216 Miami, FL | 1.0 | 1.0 | 700 | $1,900 | $2.71 | 11d | 1 | 0.09mi |
| 7570 SW 82nd St Unit F110 Miami, FL | 2.0 | 1.0 | 730 | $2,100 | $2.88 | 10d | 1 | 0.11mi |
| 7570 SW 82nd St Unit F110 Miami, FL | 2.0 | 1.0 | 730 | $2,100 | $2.88 | 24d | 1 | 0.11mi |
| 7410 SW 82nd St Unit K103 Miami, FL | 1.0 | 1.0 | 620 | $1,580 | $2.55 | 24d | 1 | 0.12mi |
| 7500 SW 82nd St Miami, FL | 2.0 | 1.0 | 730 | $2,100 | $2.88 | 3d | 2 | 0.12mi |
| 7701 Camino Real Unit 416A Miami, FL | 1.0 | 1.0 | 712 | $2,000 | $2.81 | 8d | 1 | 0.13mi |
| 7703 Camino Real Unit 413A Miami, FL | 1.0 | 1.0 | 712 | $1,900 | $2.67 | 24d | 1 | 0.14mi |
| 7703 Camino Real Unit A405 Miami, FL | 1.0 | 1.0 | 712 | $1,850 | $2.60 | 12d | 1 | 0.14mi |
| 7401 SW 82nd St Unit 207S South Miami, FL | 1.0 | 1.0 | 654 | $1,900 | $2.91 | 21d | 1 | 0.14mi |
| 7401 SW 82nd St Unit 207S South Miami, FL | 1.0 | 1.0 | 654 | $1,800 | $2.75 | 8d | 1 | 0.14mi |
| 7403 SW 82nd St Unit 201N Miami, FL | 1.0 | 1.0 | 654 | $1,800 | $2.75 | 14d | 1 | 0.14mi |
| 7722 Camino Real Unit E415 Miami, FL | 1.0 | 1.0 | 712 | $1,880 | $2.64 | 3d | 1 | 0.17mi |
| 7360 SW 82nd St Unit E202 Miami, FL | 1.0 | 1.0 | 635 | $1,875 | $2.95 | 18d | 1 | 0.18mi |
| 7360 SW 82nd St Unit E202 Miami, FL | 1.0 | 1.0 | 635 | $1,875 | $2.95 | 5d | 1 | 0.18mi |
| 7424 SW 82nd St Unit D216 Miami, FL | 2.0 | 1.0 | 730 | $2,000 | $2.74 | 8d | 1 | 0.18mi |
| 7424 SW 82nd St Unit D216 Miami, FL | 2.0 | 1.0 | 730 | $2,000 | $2.74 | 13d | 1 | 0.18mi |
| 7732 Camino Real Unit F404 Miami, FL | 1.0 | 1.0 | 712 | $2,000 | $2.81 | 18d | 1 | 0.19mi |
| 7732 Camino Real Unit F404 Miami, FL | 1.0 | 1.0 | 712 | $2,000 | $2.81 | 15d | 1 | 0.19mi |
| 8101 Camino Real Unit C115 Miami, FL | 1.0 | 1.0 | 712 | $1,900 | $2.67 | 24d | 1 | 0.22mi |
| 7300 SW 82nd St Unit A101 Miami, FL | 2.0 | 2.0 | 750 | $2,250 | $3.00 | 22d | 1 | 0.24mi |
| 7800 Camino Real Unit H213 Miami, FL | 1.0 | 1.0 | 712 | $1,900 | $2.67 | 11d | 1 | 0.25mi |
| 7800 Camino Real Unit H205 Miami, FL | 1.0 | 1.0 | 712 | $1,850 | $2.60 | 8d | 1 | 0.25mi |
| 7350 SW 82nd St Unit C125 Miami, FL | 1.0 | 1.0 | 700 | $1,875 | $2.68 | 24d | 1 | 0.25mi |
| 7324 SW 82nd St Miami, FL | 2.0 | 1.0 | 730 | $2,150 | $2.95 | 8d | 2 | 0.26mi |
| 7324 SW 82nd St Miami, FL | 2.0 | 1.0 | 730 | $2,050 | $2.81 | 24d | 2 | 0.26mi |
| 7308 SW 82nd St Unit A216 Miami, FL | 2.0 | 1.0 | 730 | $2,100 | $2.88 | 24d | 1 | 0.27mi |
| 7747 SW 86th St Unit D408 Miami, FL | 1.0 | 1.0 | 715 | $1,950 | $2.73 | 15d | 1 | 0.29mi |
| 7775 SW 86th St Unit F1-105 Miami, FL | 1.0 | 1.0 | 715 | $1,850 | $2.59 | 14d | 1 | 0.29mi |
| 8250 SW 72nd Ct Miami, FL | 2.0 | 1.0–2.0 | 797 | $2,790 | $3.50 | 1d | 16 | 0.31mi |
| 7860 Camino Real Unit L410 Miami, FL | 1.0 | 1.0 | 712 | $1,750 | $2.46 | 3d | 1 | 0.32mi |
| 7860 Camino Real Unit L410 Miami, FL | 1.0 | 1.0 | 712 | $1,850 | $2.60 | 22d | 1 | 0.32mi |
| 7765 SW 86th St Unit F2-208 Miami, FL | 1.0 | 1.0 | 715 | $1,850 | $2.59 | 24d | 1 | 0.35mi |
| 7713 SW 88th St Unit A312 Kendall, FL | 1.0 | 1.0 | 648 | $1,762 | $2.72 | 3d | 1 | 0.36mi |
| 7713 SW 88th St Unit A312 Kendall, FL | 1.0 | 1.0 | 648 | $1,762 | $2.72 | 24d | 1 | 0.36mi |
| 8150 SW 72nd Ave Miami, FL | 1.0–3.0 | 1.0–3.5 | 1474 | $2,666 | $1.81 | 3d | 30 | 0.38mi |
| 8390 SW 72nd Ave Miami, FL | 1.0–2.0 | 1.0–2.0 | 978 | $2,350 | $2.40 | 8d | 2 | 0.39mi |
HOA detail condo
- Monthly dues
- $483 · $5,796/yr
- ⚠ Special-assessment mentions
-
…to Downtown Dadeland and Metrorail. Unit may be purchased furnished. Seller will be paying remaining balance of special assessment.
Listing history 6 events
-
2026-05-15status Pending
-
2026-04-02price $175,000
-
2026-03-04$189,900 Active
-
2012-12-10soldstatus $75,000
-
2012-11-30soldstatus $75,000 197-char remark
Show marketing remark (197 chars)
Updated 1/1 in centrally located Dadeland Park - walking distance to Downtown Dadeland and Metrorail. Unit may be purchased furnished. Seller will be paying remaining balance of special assessment.
-
1998-05-11soldstatus $48,500
ⓘ Source: listings_history table (triggers on properties + properties_extension) + one-shot
backfill from property_details.listing_events for pre-trigger history.
Tax reassessment forecast FL · Resets to sale price
- Current annual tax
- $2,571 · $214/mo
- Projected year-2 tax
- $2,571 · $214/mo
- Expected delta
- $0/yr ($0/mo · 0.0%)
ⓘ Screening estimate from a state-policy table — verify with the county assessor before closing.
Climate risk First Street
- Flood 4/10 Moderate FEMA zone X (unshaded) · 22% chance over 30 yrs
- Wildfire 1/10 Low
- Heat 10/10 Extreme 7 d/yr ≥105°F today · 29 d/yr by 30 yrs out
- Wind 10/10 Extreme 99% chance of damaging wind over 30 yrs
- Air quality 2/10 Low 1 unhealthy d/yr today · 1 by 30 yrs out
Nearby sold comps map
Loading sold comps map…
Walkable amenities ~0.75 mi
Loading nearby amenities…
Taxation est. · year 1
- Rental income
- $24,056
- − Mortgage interest
- −$9,803
- − Property taxes
- −$2,571
- − Insurance
- −$875
- − Repairs & maintenance
- −$1,924
- − Management
- −$1,924
- − HOA
- −$5,796
- − Depreciation
- −$5,091
- Taxable loss
- −$3,928
- Est. tax savings @ 24.0%
- +$943
- After-tax cash flow
- $-307/yr
For passive investors: Depreciation is non-cash, so a rental often shows a tax loss while cash-flowing — sheltering income. Rental losses are passive: they offset passive income freely, and up to $25,000/yr can offset ordinary (W-2) income if you actively participate and your MAGI is under $100k (phasing out to $0 by $150k); unused losses carry forward. On sale, claimed depreciation is recaptured at up to 25%, and gains may owe capital-gains tax (a 1031 exchange can defer both). Figures are a year-1 estimate at your 24.0% rate — not tax advice; consult a CPA.
Schools (NCES district)
- District
- Miami-Dade
- NCES district ID
- 1200390
- Math proficiency
- 45% ▼ -16.00%
- Reading proficiency
- 54% ▼ -5.00%
- Median HH income
- $43,928
- Composite
- 41.76/100
- National rank
- #3397
- State rank
- #40 of 73 in FL
Livability — Glenvar Heights
- Score
- 79/100
- State rank
- #137
- US rank
- #2054
Category grades
Schools grade is shown separately in the Schools card above.
Census & demographics
- Census place
- Glenvar Heights, FL
- County
- Miami-Dade County · 2,697,751 people
- Metro
- Miami-Fort Lauderdale-Pompano Beach, FL
- Population (ZIP)
- 33,711
- Household income
- $83,008
- Rent vs Own
- Severe rent burden
- 1760.0
Population outlook (Miami-Dade County) Hauer SSP2
- Today (2025)
- 3,126,439 people
- By 2030
- 3,325,765 · +6.4%
- By 2040
- 3,697,561 · +18.3%
- By 2050
- 4,012,134 · +28.3%
- By 2075
- 4,605,612 · +47.3%
- By 2100
- 4,866,598 · +55.7%
Race, ethnicity, and origin ACS 2023
- Neighborhood character
- Diverse neighborhood (Simpson 0.56)
- Race & ethnicity
- Hispanic / Latino 60% Two or more races 39% White 27% Black 6% Asian 2%
- Hispanic origin (detail)
- Mexican 4% Puerto Rican 4% Cuban 27% Dominican 2% Salvadoran 2%
- Common ancestry
- Lithuanian 2% Romanian 2% Estonian 2%
- Foreign-born
- 43% · Canada, Jamaica, Dominican Republic
- Languages at home
- 34% English-only · Spanish 58% Other Indo-European 3% French/Haitian/Cajun 2%
Political lean MEDSL · Miami-Dade
- 2024 margin
- R (+11.4) · D 43.9% · R 55.4%
- 2008→2024 swing
- -27.6pp toward R · 2008: 16.1pp · 2024: -11.4pp
- All cycles
- 2024: R+11.4 2020: D+7.3 2016: D+29.6 2012: D+23.7 2008: D+16.1
Not yet ingested
- Civics
- —
Market trends
- HPI YoY
- ▼ -793.78%
- Current HPI
- 490.5935
- Rent YoY
- ▲ 4.93%
- Metro
- Miami-Fort Lauderdale-Pompano Beach, FL
- State GDP YoY
- ▲ 3.28%
- F500 in state
- 36
Industry mix (Fortune 500 HQ in FL)
| Industry | F500 HQs | Revenue |
|---|---|---|
| Industrial Technology | 2 | $29B |
|
||
| Insurance | 2 | $17B |
|
||
| Retail | 1 | $60B |
|
||
| Technology Distribution | 1 | $58B |
|
||
| Homebuilding | 1 | $35B |
|
||
| Technology Manufacturing | 1 | $35B |
|
||
Price history
+260.8% since first listed6 events — show timeline
- 2026-05-15 Pending — MARMLS
- 2026-04-02 Price Changed $175,000 MARMLS
- 2026-03-04 Listed $189,900 MARMLS
- 2012-12-10 Sold (Public Records) $75,000 Public Records
- 2012-11-30 Sold (MLS) $75,000 MARMLS
- 1998-05-11 Sold (Public Records) $48,500 Public Records
Property tax history
+18.2%/yrLatest (2025): $2,571 · +5.5% YoY. Source: county tax records.
Cash-flow waterfall
monthlySold comps — $/sqft
last 12 mo · ≤1 miLoading sold comps…