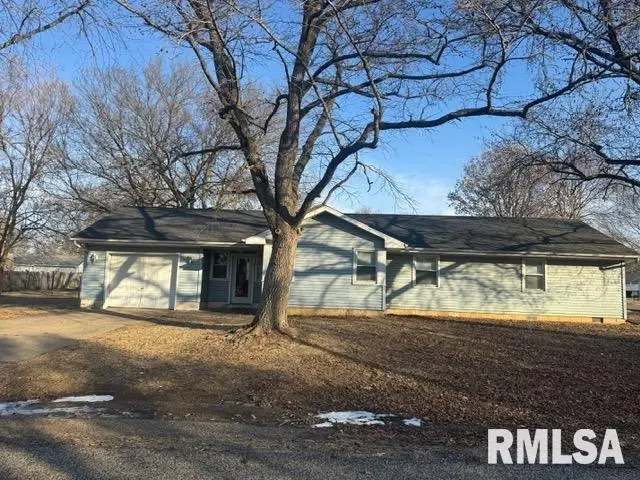
411 E 7th St · Delavan, IL
Flood risk 1/10 · Minimal
- FEMA flood zone
- X (unshaded)
- Chance of flooding over 30 yrs
- 0.0%
- Est. flood insurance / yr
- $507 – $1,088
Fire risk 1/10 · Minimal
- Est. fire insurance / yr
- $804 – $1,492
Heat risk 3/10 · Minor
- Hot days now (above 105°F)
- 7 days/yr
- Hot days in 30 yrs
- 19 days/yr
Wind risk 2/10 · Minimal
- Chance of severe wind over 30 yrs
- 1.0%
Air-quality risk 2/10 · Minimal
- Unhealthy air days now
- 1 days/yr
- Unhealthy air days in 30 yrs
- 2 days/yr
Risk factors via First Street. Map © Google.
Why this score? — see what drove the B- grade
The composite is a weighted blend of 9 inputs, each scored 0–100. Each bar is that input's sub-score; the figure is the points it added to the 100-point composite (weight × sub-score).
- Cash flow +24.4/30.0
- Appreciation +10.0/10.0
- ARV discount +8.7/15.0
- DSCR +7.9/10.0
- 1% rule +5.4/10.0
- Livability +3.5/5.0
- Rent growth +2.5/5.0
- Condition / age +2.5/5.0
- Schools +2.0/10.0
$127,500
🖨 Deal sheet 📄 Offer letter ✓ Due diligence
Listing remarks MLS
Don't miss out! 3-bedroom one bath ranch home ready to move in here in Delavan! One car longer attached garage with room for more storage or a hobby area. Breezeway has been finished for more useable space just add heat and a/c and make this space whatever you need! Purchased in 2018, updates include roof, windows, entire HVAC system and most recently much of the flooring and light fixtures. This home is ready for a new owner. Don't wait, reach out to your agent of choice today!
Key facts
- Ranch home
- Attached garage
- Updated hvac system
Tags
Neighborhood map
What this means for you Summary
Snapshot
- This is a 3-bed/1.0-bath single-family listed at $128k.
Deal economics
- At list price, monthly cash flow is $258 ($3k/yr) — positive.
- The deal already cash-flows at list — no discount required.
- Meets the 1% rule at list price ($1k rent vs $128k).
- Recommended offer: $112k (12.0% below list) — sets the bar for market timing.
Location & tenants
- Location reads 70/100 on livability (#376 in IL) — a middle-class / working-renter tenant base. Strengths: crime A+, cost of living A+, housing A+; Watch: schools C-, amenities F, commute F.
- Delavan CUSD 703 (rural): math 20% / reading 24% proficiency, ranked #373 of 620 in IL (top 60%) — low school quality limits family demand, transient renter base, plan for 1-2y turnover.
- Market conditions: 11 active listings in the ZIP; 77 units permitted in Tazewell County in 2024 (0 in 5+ unit buildings).
Forward outlook
- In year one you build about $14k of equity ($882 loan paydown + $13k appreciation (10.0% local appreciation)).
- Tazewell County population projected at -15% by 2050 — secular population decline; favor cash flow + early exit over multi-decade hold.
- At projected returns (10.0% appreciation + 3.0% rent growth), your $36k cash investment doubles in ~3 years — after that, you're playing with house money.
- By year 3, paydown + projected appreciation supports a ~$35k cash-out refi (75% LTV) — recoverable capital for the next deal without selling this one.
Negotiation context
- It's been on market 130 days — a 12% lower offer ($112k) is reasonable based on typical stale-listing flexibility.
- Current owner paid $55k; list at $128k implies a 132% gain — meaningful room to come down on a strong offer.
Questions for the listing agent
- It's been on market 130 days. Have you received any prior offers? Is the seller open to a 12% concession, seller financing, or rate buy-down credit?
- Built in 1961 — when were the roof, HVAC, electrical panel, plumbing, and water heater last replaced?
- Why hasn't it sold? Are there any deal-killer items the seller is aware of (foundation, flood, title, zoning, code violations)?
- Is there a deadline driving the sale (1031 exchange, divorce, estate, relocation)? That informs how much negotiation room exists.
- What's the average days-on-market for RENTAL listings here right now (not sales)? A rising rental-DOM trend means longer vacancies and softer asking-rent achievability than the comps imply.
- What's the recent tenant-quality profile in this submarket — average credit score on applications, eviction rate, late-payment / NSF rate, and stable-employment percentage? A property-management company in the area should have these aggregated.
- How much new for-sale + rental construction is in the pipeline within 1–3 miles? Heavy new supply typically softens prices + rents 12–24 months out; constrained supply supports both.
Investment metrics
- 1% rule
- 1.04% ✓
- Cap rate
- 8.72%
- Cash-on-cash
- 8.68%
- DSCR
- 1.39
- GRM
- 8.0
CMA / ARV
- ARV (median comp)
- $131,114
- List price
- $127,500
- Delta
- -2.76%
- Verdict
- FAIR
- Comps
- 20 within 1.0 mi
Show comp detail 11 sales within ~0.75 mi
| Address | Dist | Beds/Ba | Sqft | Sold | Price | $/sf | Match |
|---|---|---|---|---|---|---|---|
| 507 S Linden St | 0.07mi | 3/1.0 | 1,346 (+2%) | 16mo | $79,900 | $59 | 80 |
| 408 S Cedar St | 0.18mi | 3/2.0 | 1,311 (-0%) | 12mo | $220,000 | $168 | 77 |
| 603 S Linden St | 0.03mi | 2/2.0 (-1) | 1,378 (+5%) | 6mo | $130,000 | $94 | 77 |
| 105 E 9th St | 0.31mi | 3/2.0 | 1,304 (-1%) | 6mo | $147,900 | $113 | 75 |
| 607 E 2nd St | 0.37mi | 2/1.5 (-1) | 1,292 (-2%) | 1mo | $199,900 | $155 | 72 |
| 1007 S Oak St | 0.34mi | 3/1.0 | 1,218 (-7%) | 7mo | $88,000 | $72 | 66 |
| 108 W A St | 0.58mi | 3/1.5 | 1,266 (-4%) | 4mo | $120,000 | $95 | 61 |
| 200 Heritage Ln | 0.28mi | 3/2.0 | 1,232 (-6%) | 22mo | $175,000 | $142 | 54 |
| 206 E 10th St | 0.33mi | 3/1.0 | 1,494 (+14%) | 14mo | $109,900 | $74 | 50 |
| 602 W 3rd St | 0.69mi | 3/1.0 | 1,120 (-15%) | 7mo | $60,100 | $54 | 38 |
| 100 Weber Ln | 0.71mi | 3/2.0 | 1,500 (+14%) | 12mo | $145,000 | $97 | 30 |
Match score weights: distance 35% · size 25% · config 20% · recency 20%. Top-matched comps best support the ARV.
Projected returns pro-forma
10.0% appreciation · 3.0% rent growth · sell at horizon
- IRR
- 30.6%
- Equity multiple
- 3.40×
- Total profit
- $85,858
- Equity at exit
- $114,862
- IRR
- 26.5%
- Equity multiple
- 7.72×
- Total profit
- $239,831
- Equity at exit
- $247,704
Cash invested: $35,700 (down + closing). Projections, not guarantees.
Landlord ↔ Tenant lean methodology
- Overall (STATE)
- 43 Moderately Tenant-Leaning
- State Illinois
- 43 Moderately Tenant-Leaning · D+7
- County
- — inherits STATE
- City
- — inherits STATE
ZIP-level market 61734
- Home prices YoY
- 18.5%
- Active inventory
- 11
- Price-to-rent
- 8.0×
Monthly cashflow live
- Estimated rent
- $1,330 medium interval (Pro) →
- Mortgage (P&I)
- −$669
- Tax from tax record
- −$71 /mo · $851/yr
- Insurance
- −$53
- HOA
- −$0
- Vacancy / Maint / Mgmt
- −$279
- Net cashflow
- $258
Break-even live
UW: 25.0% down · 7.5% · 30yr · 1.5% tax · 5.0% vac · 8.0% maint · 8.0% mgmt
Financing live
Cash to close
- Down payment
- $31,875
- Closing costs
- $3,825
- Reserves months
- —
- Total cash needed
- —
Loan-product check · same deal, 3 products live
Conventional
25% down · 7.5% · 30yr
- Down + closing
- —
- Monthly P&I
- —
- Monthly cashflow
- —
- DSCR
- —
- Eligible?
- —
Personal DTI + credit; lowest rate.
DSCR
20% down · 8.5% · 30yr
- Down + closing
- —
- Monthly P&I
- —
- Monthly cashflow
- —
- DSCR
- —
- Eligible?
- —
No personal income docs; deal must DSCR.
Hard money
10% down · 12.0% · 12mo
- Down + closing
- —
- Monthly P&I
- —
- Monthly cashflow
- —
- DSCR
- —
- Eligible?
- —
Short-term bridge; refi at stabilization.
Listing history 20 events
-
2026-06-19days on market $127,500 Active 130 DOM
-
2026-06-18days on market $127,500 Active 129 DOM
-
2026-06-17days on market $127,500 Active 128 DOM
-
2026-06-16days on market $127,500 Active 127 DOM
-
2026-06-15days on market $127,500 Active 126 DOM
-
2026-06-14days on market $127,500 Active 124 DOM
-
2026-06-13days on market $127,500 Active 123 DOM
-
2026-06-10days on market $127,500 Active 121 DOM
-
2026-06-09days on market $127,500 Active 120 DOM
-
2026-06-08days on market $127,500 Active 119 DOM
-
2026-06-07days on market $127,500 Active 118 DOM
-
2026-06-02days on market $127,500 Active 113 DOM
-
2026-06-01days on market $127,500 Active 112 DOM
-
2026-05-31days on market $127,500 Active 111 DOM
-
2026-05-30days on market $127,500 Active 110 DOM
-
2026-04-30price $127,500 483-char remark
Show marketing remark (483 chars)
Don't miss out! 3-bedroom one bath ranch home ready to move in here in Delavan! One car longer attached garage with room for more storage or a hobby area. Breezeway has been finished for more useable space just add heat and a/c and make this space whatever you need! Purchased in 2018, updates include roof, windows, entire HVAC system and most recently much of the flooring and light fixtures. This home is ready for a new owner. Don't wait, reach out to your agent of choice today!
-
2026-02-09$129,900 Active 483-char remark
Show marketing remark (483 chars)
Don't miss out! 3-bedroom one bath ranch home ready to move in here in Delavan! One car longer attached garage with room for more storage or a hobby area. Breezeway has been finished for more useable space just add heat and a/c and make this space whatever you need! Purchased in 2018, updates include roof, windows, entire HVAC system and most recently much of the flooring and light fixtures. This home is ready for a new owner. Don't wait, reach out to your agent of choice today!
-
2021-08-06historical
-
2004-08-12soldstatus $55,000
-
1994-08-26soldstatus $30,000
ⓘ Source: listings_history table (triggers on properties + properties_extension) + one-shot
backfill from property_details.listing_events for pre-trigger history.
Tax reassessment forecast IL · Partial reset (capped growth)
- Current annual tax
- $851 · $71/mo
- Projected year-2 tax
- $1,872 · $156/mo
- Expected delta
- +$1,022/yr (+$85/mo · 120.1%)
ⓘ Screening estimate from a state-policy table — verify with the county assessor before closing.
Climate risk First Street
- Flood 1/10 Low FEMA zone X (unshaded) · 0% chance over 30 yrs
- Wildfire 1/10 Low
- Heat 3/10 Moderate 7 d/yr ≥105°F today · 19 d/yr by 30 yrs out
- Wind 2/10 Low 100% chance of damaging wind over 30 yrs
- Air quality 2/10 Low 1 unhealthy d/yr today · 2 by 30 yrs out
Nearby sold comps map
Loading sold comps map…
Walkable amenities ~0.75 mi
Loading nearby amenities…
Taxation est. · year 1
- Rental income
- $15,964
- − Mortgage interest
- −$7,142
- − Property taxes
- −$851
- − Insurance
- −$638
- − Repairs & maintenance
- −$1,277
- − Management
- −$1,277
- − Depreciation
- −$3,709
- Taxable income
- $1,070
- Est. tax owed @ 24.0%
- −$257
- After-tax cash flow
- $2,843/yr
For passive investors: Depreciation is non-cash, so a rental often shows a tax loss while cash-flowing — sheltering income. Rental losses are passive: they offset passive income freely, and up to $25,000/yr can offset ordinary (W-2) income if you actively participate and your MAGI is under $100k (phasing out to $0 by $150k); unused losses carry forward. On sale, claimed depreciation is recaptured at up to 25%, and gains may owe capital-gains tax (a 1031 exchange can defer both). Figures are a year-1 estimate at your 24.0% rate — not tax advice; consult a CPA.
Schools (NCES district)
- District
- Delavan CUSD 703
- NCES district ID
- 1712060
- Math proficiency
- 20% ▼ -12.00%
- Reading proficiency
- 24% ▼ -14.00%
- Median HH income
- $54,718
- Composite
- 20.01/100
- National rank
- #8661
- State rank
- #373 of 620 in IL
Livability — Delavan
- Score
- 70/100
- State rank
- #376
- US rank
- #7837
Category grades
Schools grade is shown separately in the Schools card above.
Census & demographics
- Census place
- Delavan, IL
- City population
- 2,500
- Population (ZIP)
- 2,500
Population outlook (Tazewell County) Hauer SSP2
- Today (2025)
- 131,252 people
- By 2030
- 128,028 · -2.5%
- By 2040
- 120,443 · -8.2%
- By 2050
- 111,872 · -14.8%
- By 2075
- 89,843 · -31.5%
- By 2100
- 66,468 · -49.4%
Race, ethnicity, and origin ACS 2023
- Neighborhood character
- Predominantly White (95%)
- Race & ethnicity
- White 95% Hispanic / Latino 3% Two or more races 2%
- Common ancestry
- Romanian 4% Iranian 3% Italian 3%
- Foreign-born
- 1% · Canada
- Languages at home
- 99% English-only · Spanish 0%
Political lean MEDSL · Tazewell
- 2024 margin
- Strong R (+26.7) · D 35.8% · R 62.5% · Other 1.8%
- 2008→2024 swing
- -20.6pp toward R · 2008: -6.0pp · 2024: -26.7pp
- All cycles
- 2024: R+26.7 2020: R+25.6 2016: R+28.5 2012: R+17.9 2008: R+6.0
Not yet ingested
- Civics
- —
Market trends
- HPI YoY
- ▲ 31.24%
- Current HPI
- 200.26
- Rent YoY
- —
- Metro
- —
- State GDP YoY
- ▲ 1.59%
- F500 in state
- 60
Industry mix (Fortune 500 HQ in IL)
| Industry | F500 HQs | Revenue |
|---|---|---|
| Insurance | 4 | $201B |
|
||
| Consumer Goods | 4 | $87B |
|
||
| Industrial Machinery | 3 | $64B |
|
||
| Healthcare | 2 | $55B |
|
||
| Retail / Pharmacy | 1 | $148B |
|
||
| Agriculture / Food | 1 | $86B |
|
||
Price history
+325.0% since first listed5 events — show timeline
- 2026-04-30 Price Changed $127,500 RMLSA as Distributed by MLS Grid
- 2026-02-09 Listed $129,900 RMLSA as Distributed by MLS Grid
- 2021-08-06 Listing Removed — RMLSA as Distributed by MLS Grid
- 2004-08-12 Sold (Public Records) $55,000 Public Records
- 1994-08-26 Sold (Public Records) $30,000 Public Records
Property tax history
-6.7%/yrLatest (2024): $851 · +5.1% YoY. Source: county tax records.
Cash-flow waterfall
monthlySold comps — $/sqft
last 12 mo · ≤1 miLoading sold comps…