 Multi-family
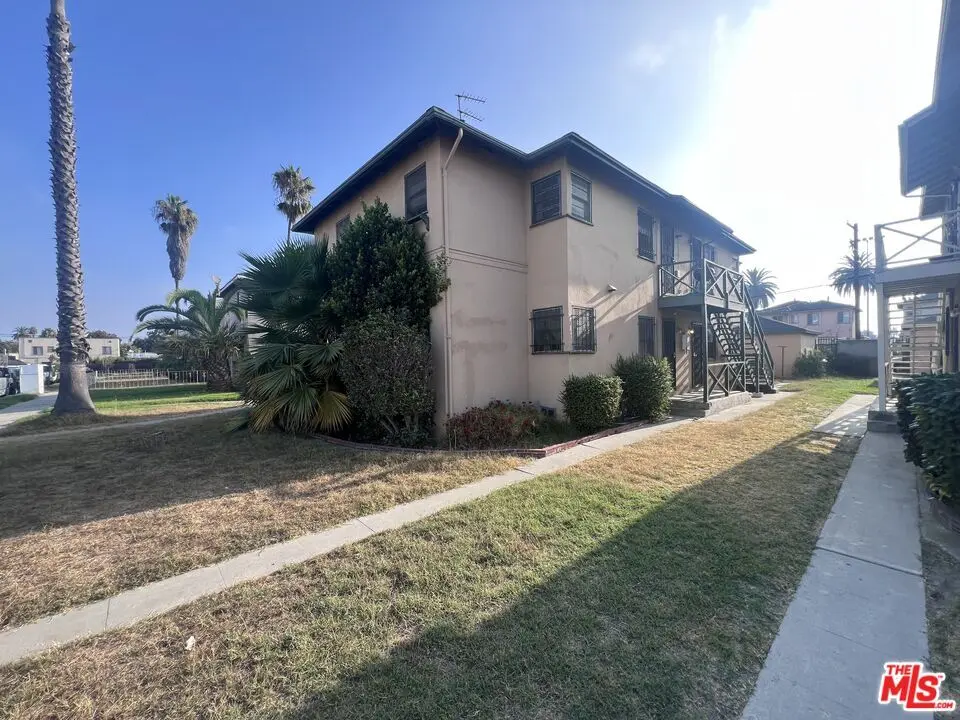
6130 S Hobart Blvd · Los Angeles, CA
Flood risk 1/10 · Minimal
- FEMA flood zone
- X (shaded)
- Chance of flooding over 30 yrs
- 0.0%
- Est. flood insurance / yr
- $507 – $1,088
Fire risk 1/10 · Minimal
- Est. fire insurance / yr
- $659 – $1,223
Heat risk 5/10 · Moderate
- Hot days now (above 88°F)
- 7 days/yr
- Hot days in 30 yrs
- 21 days/yr
Wind risk 1/10 · Minimal
- Chance of severe wind over 30 yrs
- —
Air-quality risk 5/10 · Moderate
- Unhealthy air days now
- 7 days/yr
- Unhealthy air days in 30 yrs
- 7 days/yr
Risk factors via First Street. Map © Google.
Why this score? — see what drove the C grade
The composite is a weighted blend of 9 inputs, each scored 0–100. Each bar is that input's sub-score; the figure is the points it added to the 100-point composite (weight × sub-score).
- Cash flow +22.2/30.0
- ARV discount +8.3/15.0
- DSCR +7.1/10.0
- 1% rule +5.0/10.0
- Rent growth +3.9/5.0
- Schools +3.6/10.0
- Livability +3.4/5.0
- Condition / age +2.5/5.0
- Appreciation +0.0/10.0
$850,000
🖨 Deal sheet 📄 Offer letter ✓ Due diligence
Multi-family units
County records classify this as Multi-Family (2-4 Unit). Listing-text estimate: 1 unit. estimate disagrees with records
Listing remarks MLS
Positioned in the path of dynamic growth, this exceptional four-unit quadplex offers a rare opportunity to secure a foothold in one of Los Angeles' most rapidly evolving corridors. Whether you're a seasoned investor seeking strong upside, a first-time buyer looking to build wealth, or an owner-occupant ready to live smart while generating income, this property checks every box. Each of the four well-proportioned units features a 1-bedroom, 1-bathroom layout, providing broad rental appeal and consistent demand. One unit will be delivered vacant at close of escrow with the possibility of additional units being delivered vacant at close of escrow creating immediate flexibility for an owner-user or a savvy investor ready to execute a value-add strategy from day one. This is a property where you can step in and start optimizing returns immediately. The location is where this asset truly shines. Situated within close proximity to major transit hubs, including the transformative Metro K Line, residents enjoy seamless connectivity with direct access to Downtown Los Angeles and expanding routes that will soon link directly to LAX. This accessibility continues to drive rental demand and long-term appreciation, making it an ideal buy-and-hold in a high-growth pocket of the city. Just minutes away are some of Los Angeles' most iconic and in-demand destinations, including SoFi Stadium, the Kia Forum, and the Intuit Dome, home to world-class entertainment, concerts, and sporting events that energize the surrounding area year-round. This proximity not only enhances tenant appeal but also positions the property at the center of a thriving economic and cultural hub. Adding even more upside potential, the property includes four individual car garages a highly desirable feature with the exciting possibility for ADU conversion (buyer to verify all permits and uses). This opens the door to additional income streams and long-term value expansion, making this an even more compelling investment. With strong fundamentals, unbeatable location advantages, and multiple pathways to increase value, 6130-6134 Hobart Blvd represents more than just a property, it's an opportunity to capitalize on momentum, maximize returns, and invest in the future of Los Angeles.
Key facts
- 6,251 sq ft lot
- 4 garage spots
- Built 1948
Neighborhood map
What this means for you Summary
Snapshot
- This is a 4-bed/4.0-bath multifamily listed at $850k.
Deal economics
- At list price, monthly cash flow is $1k ($17k/yr) — positive.
- The deal already cash-flows at list — no discount required.
- To meet the 1% rule (rent ≥ 1% of price), the offer needs to be $850k (0.1% below list).
- Recommended offer: $799k (6.0% below list) — sets the bar for market timing.
- Cap rate 8.3% vs local median 2.1% in Los Angeles — top-decile yield for the area; either an underpriced asset or a hidden risk that comps aren't pricing in. Stress-test before assuming the spread holds.
Location & tenants
- Location reads 68/100 on livability (#273 in CA) — a middle-class / working-renter tenant base. Strengths: amenities A+, commute A+, employment B; Watch: health & safety C-, schools D+, crime F.
- Los Angeles Unified (urban): math 29% / reading 54% proficiency, ranked #223 of 517 in CA (top 43%) — families likely to look elsewhere, expect single-tenant / working-renter base with shorter leases; 67% free/reduced lunch — lower-income household profile, screen leases tightly.
- Market conditions: Rents rising fast (+5.5%/yr); 138 active listings in the ZIP; 5 comparable units currently listed for rent nearby; rentals at typical pace (median 24d on market — plan ~3-4 weeks tenant-placement turnaround); 40% of comp listings sitting > 30 days — soft ceiling on asking rent; 19,697 units permitted in Los Angeles County in 2024 (9,426 in 5+ unit buildings).
- At $8,495/mo this rent would consume 142% of the median local household income ($72k/yr) (locally 3323% of renters already pay >50% of income on rent) — very limited rent-growth headroom before tenants either downsize or default.
Forward outlook
- Local home prices are declining (-3.0%/yr); year-one equity from $6k of loan paydown is wiped out by about $26k of value loss. Plan a longer hold.
- Los Angeles County population projected at +9% by 2050 — modest demand growth; plan on rents tracking national, not racing it.
- At projected returns (-3.0% appreciation + 5.5% rent growth), your $238k cash investment doubles in ~10 years — after that, you're playing with house money.
Negotiation context
- It's been on market 62 days — a 6% lower offer ($799k) is reasonable based on typical stale-listing flexibility.
- Current owner paid $40k; list at $850k implies a 2025% gain — meaningful room to come down on a strong offer.
Risks & watch-outs
- Watch-outs: built in 1948 — expect roof / HVAC / electrical / plumbing capex.
- Climate carrying-cost: extreme-heat days projected 7→21/yr by 2055 (HVAC capex compounding) — expect insurance premiums to compound above CPI over the hold.
Questions for the listing agent
- It's been on market 62 days. Have you received any prior offers? Is the seller open to a 6% concession, seller financing, or rate buy-down credit?
- Built in 1948 — when were the roof, HVAC, electrical panel, plumbing, and water heater last replaced?
- Why hasn't it sold? Are there any deal-killer items the seller is aware of (foundation, flood, title, zoning, code violations)?
- Is there a deadline driving the sale (1031 exchange, divorce, estate, relocation)? That informs how much negotiation room exists.
- Schools are D-rated, which usually means shorter tenancies and higher turnover. Who's the typical renter profile here, and what's been the actual vacancy rate?
- Crime grade is F in this area — have there been break-ins, vandalism, or insurance claims at this property in the last 3 years? What carrier currently insures it and at what premium?
- What's the average days-on-market for RENTAL listings here right now (not sales)? A rising rental-DOM trend means longer vacancies and softer asking-rent achievability than the comps imply.
- What's the recent tenant-quality profile in this submarket — average credit score on applications, eviction rate, late-payment / NSF rate, and stable-employment percentage? A property-management company in the area should have these aggregated.
- How much new apartment / multifamily construction is in the pipeline within 1–3 miles? Heavy new supply (>2% of stock underway) typically softens rents 12–24 months out; light construction supports rent growth.
Investment metrics
- 1% rule
- 1.00% ✗
- Cap rate
- 8.25%
- Cash-on-cash
- 7.00%
- DSCR
- 1.31
- GRM
- 8.3
CMA / ARV
- ARV (median comp)
- $864,421
- List price
- $850,000
- Delta
- -1.67%
- Verdict
- FAIR
- Comps
- 20 within 1.0 mi
Show comp detail 5 sales within ~0.75 mi
| Address | Dist | Beds/Ba | Sqft | Sold | Price | $/sf | Match |
|---|---|---|---|---|---|---|---|
| 6142 S Hobart Blvd | 0.02mi | 4/4.0 | 2,986 (+2%) | 15mo | $1,030,000 | $345 | 83 |
| 2003 W 66th St | 0.46mi | 4/2.0 | 2,520 (-14%) | 1mo | $710,000 | $282 | 46 |
| 1257 W 60th Pl | 0.57mi | 5/3.0 (+1) | 2,635 (-10%) | 6mo | $835,000 | $317 | 42 |
| 6254 S Van Ness Ave | 0.58mi | 5/4.0 (+1) | 3,328 (+14%) | 11mo | $1,077,000 | $324 | 36 |
| 6120 Wilton | 0.40mi | 5/5.0 (+1) | 3,272 (+12%) | 20mo | $850,000 | $260 | 36 |
Match score weights: distance 35% · size 25% · config 20% · recency 20%. Top-matched comps best support the ARV.
Projected returns pro-forma
-3.0% appreciation · 5.51% rent growth · sell at horizon
- IRR
- -3.0%
- Equity multiple
- 0.88×
- Total profit
- $-27,518
- Equity at exit
- $126,738
- IRR
- 9.1%
- Equity multiple
- 1.77×
- Total profit
- $184,066
- Equity at exit
- $73,492
Cash invested: $238,000 (down + closing). Projections, not guarantees.
Landlord ↔ Tenant lean methodology
- Overall (CITY)
- 0 Strongly Tenant-Friendly
- State California
- 18 Strongly Tenant-Friendly · D+13
- County
- — inherits STATE
- City Los Angeles
- 0 Strongly Tenant-Friendly · D+22
ZIP-level market 90047
- Rents YoY
- 5.5%
- Active inventory
- 138
- Price-to-rent
- 33.4×
Monthly cashflow live
- Estimated rent
- $8,495 high interval (Pro) →
- Mortgage (P&I)
- −$4,457
- Tax from tax record
- −$511 /mo · $6,130/yr
- Insurance
- −$354
- HOA
- −$0
- Vacancy / Maint / Mgmt
- −$1,784
- Net cashflow
- $1,389
Break-even live
4-unit breakdown (identical units grouped — click to expand)
| Units | Beds | Baths | Est. rent |
|---|---|---|---|
| 4× units | 1 | 1 | $8,496 |
| #1 | 1 | 1 | $2,124 |
| #2 | 1 | 1 | $2,124 |
| #3 | 1 | 1 | $2,124 |
| #4 | 1 | 1 | $2,124 |
| Total (4 units) | $8,495 | ||
UW: 25.0% down · 7.5% · 30yr · 1.5% tax · 5.0% vac · 8.0% maint · 8.0% mgmt
Financing live
Cash to close
- Down payment
- $212,500
- Closing costs
- $25,500
- Reserves months
- —
- Total cash needed
- —
Loan-product check · same deal, 3 products live
Conventional
25% down · 7.5% · 30yr
- Down + closing
- —
- Monthly P&I
- —
- Monthly cashflow
- —
- DSCR
- —
- Eligible?
- —
Personal DTI + credit; lowest rate.
DSCR
20% down · 8.5% · 30yr
- Down + closing
- —
- Monthly P&I
- —
- Monthly cashflow
- —
- DSCR
- —
- Eligible?
- —
No personal income docs; deal must DSCR.
Hard money
10% down · 12.0% · 12mo
- Down + closing
- —
- Monthly P&I
- —
- Monthly cashflow
- —
- DSCR
- —
- Eligible?
- —
Short-term bridge; refi at stabilization.
Rent comps 5 comps
| Address | Beds | Baths | Sqft | Rent | $/sqft | DOM | Units | Dist |
|---|---|---|---|---|---|---|---|---|
| 7530 S Hobart Blvd Los Angeles, CA | 4.0 | 3.0 | 2400 | $5,750 | $2.40 | 18d | 1 | 0.89mi |
| 5001 S Budlong Ave Los Angeles, CA | 5.0 | 2.5 | 2010 | $5,200 | $2.59 | 7d | 1 | 1.16mi |
| 715 W 58th St Los Angeles, CA | 5.0 | 3.0 | 3500 | $4,000 | $1.14 | 24d | 1 | 1.32mi |
| 6414 Denver Ave Unit 1/2 Los Angeles, CA | 5.0 | 3.0 | 2850 | $3,950 | $1.39 | 43d | 1 | 1.42mi |
| 4284 S Hobart Blvd Los Angeles, CA | 3.0 | 1.0 | 3040 | $3,300 | $1.09 | 43d | 1 | 1.46mi |
Listing history 15 events
-
2026-06-18days on market $850,000 Active 62 DOM
-
2026-06-17days on market $850,000 Active 61 DOM
-
2026-06-16days on market $850,000 Active 60 DOM
-
2026-06-15days on market $850,000 Active 59 DOM
-
2026-06-13days on market $850,000 Active 57 DOM
-
2026-06-09days on market $850,000 Active 53 DOM
-
2026-06-08days on market $850,000 Active 52 DOM
-
2026-06-07days on market $850,000 Active 51 DOM
-
2026-06-04days on market $850,000 Active 48 DOM
-
2026-06-03days on market $850,000 Active 47 DOM
-
2026-06-02days on market $850,000 Active 46 DOM
-
2026-06-01days on market $850,000 Active 45 DOM
-
2026-05-31days on market $850,000 Active 44 DOM
-
2026-04-17$850,000 Active 2272-char remark
Show marketing remark (2272 chars)
Positioned in the path of dynamic growth, this exceptional four-unit quadplex offers a rare opportunity to secure a foothold in one of Los Angeles' most rapidly evolving corridors. Whether you're a seasoned investor seeking strong upside, a first-time buyer looking to build wealth, or an owner-occupant ready to live smart while generating income, this property checks every box. Each of the four well-proportioned units features a 1-bedroom, 1-bathroom layout, providing broad rental appeal and consistent demand. One unit will be delivered vacant at close of escrow with the possibility of additional units being delivered vacant at close of escrow creating immediate flexibility for an owner-user or a savvy investor ready to execute a value-add strategy from day one. This is a property where you can step in and start optimizing returns immediately. The location is where this asset truly shines. Situated within close proximity to major transit hubs, including the transformative Metro K Line, residents enjoy seamless connectivity with direct access to Downtown Los Angeles and expanding routes that will soon link directly to LAX. This accessibility continues to drive rental demand and long-term appreciation, making it an ideal buy-and-hold in a high-growth pocket of the city. Just minutes away are some of Los Angeles' most iconic and in-demand destinations, including SoFi Stadium, the Kia Forum, and the Intuit Dome, home to world-class entertainment, concerts, and sporting events that energize the surrounding area year-round. This proximity not only enhances tenant appeal but also positions the property at the center of a thriving economic and cultural hub. Adding even more upside potential, the property includes four individual car garages a highly desirable feature with the exciting possibility for ADU conversion (buyer to verify all permits and uses). This opens the door to additional income streams and long-term value expansion, making this an even more compelling investment. With strong fundamentals, unbeatable location advantages, and multiple pathways to increase value, 6130-6134 Hobart Blvd represents more than just a property, it's an opportunity to capitalize on momentum, maximize returns, and invest in the future of Los Angeles.
-
1977-10-03soldstatus $40,000
ⓘ Source: listings_history table (triggers on properties + properties_extension) + one-shot
backfill from property_details.listing_events for pre-trigger history.
Tax reassessment forecast CA · Resets to sale price
- Current annual tax
- $6,130 · $511/mo
- Projected year-2 tax
- $6,460 · $538/mo
- Expected delta
- +$330/yr (+$28/mo · 5.4%)
ⓘ Screening estimate from a state-policy table — verify with the county assessor before closing.
Climate risk First Street
- Flood 1/10 Low FEMA zone X (shaded) · 0% chance over 30 yrs
- Wildfire 1/10 Low
- Heat 5/10 Major 7 d/yr ≥88°F today · 21 d/yr by 30 yrs out
- Wind 1/10 Low
- Air quality 5/10 Major 7 unhealthy d/yr today · 7 by 30 yrs out
Nearby sold comps map
Loading sold comps map…
Walkable amenities ~0.75 mi
Loading nearby amenities…
Taxation est. · year 1
- Rental income
- $101,940
- − Mortgage interest
- −$47,613
- − Property taxes
- −$6,130
- − Insurance
- −$4,250
- − Repairs & maintenance
- −$8,155
- − Management
- −$8,155
- − Depreciation
- −$24,727
- Taxable income
- $2,909
- Est. tax owed @ 24.0%
- −$698
- After-tax cash flow
- $15,965/yr
For passive investors: Depreciation is non-cash, so a rental often shows a tax loss while cash-flowing — sheltering income. Rental losses are passive: they offset passive income freely, and up to $25,000/yr can offset ordinary (W-2) income if you actively participate and your MAGI is under $100k (phasing out to $0 by $150k); unused losses carry forward. On sale, claimed depreciation is recaptured at up to 25%, and gains may owe capital-gains tax (a 1031 exchange can defer both). Figures are a year-1 estimate at your 24.0% rate — not tax advice; consult a CPA.
Schools (NCES district)
- District
- Los Angeles Unified
- NCES district ID
- 0622710
- Math proficiency
- 29% ▼ -4.00%
- Reading proficiency
- 54% ▲ 10.00%
- Median HH income
- $50,403
- Composite
- 35.67/100
- National rank
- #4875
- State rank
- #223 of 517 in CA
Livability — Los Angeles
- Score
- 68/100
- State rank
- #273
- US rank
- #9237
Category grades
Schools grade is shown separately in the Schools card above.
Census & demographics
- Census place
- Los Angeles, CA
- County
- Los Angeles County · 9,444,647 people
- City population
- 3,838,149
- Metro
- Los Angeles-Long Beach-Anaheim, CA
- Population (ZIP)
- 50,974
- Household income
- $71,664
- Rent vs Own
- Severe rent burden
- 3323.0
Population outlook (Los Angeles County) Hauer SSP2
- Today (2025)
- 10,940,515 people
- By 2030
- 11,256,481 · +2.9%
- By 2040
- 11,729,929 · +7.2%
- By 2050
- 11,948,407 · +9.2%
- By 2075
- 11,818,114 · +8.0%
- By 2100
- 10,842,928 · -0.9%
Race, ethnicity, and origin ACS 2023
- Neighborhood character
- Diverse neighborhood (Simpson 0.58)
- Race & ethnicity
- Black 52% Hispanic / Latino 39% Two or more races 13% White 3% Native American 1%
- Hispanic origin (detail)
- Mexican 21%
- Common ancestry
- British 2%
- Foreign-born
- 18% · Canada
- Languages at home
- 63% English-only · Spanish 35% German/W. Germanic 1%
Political lean MEDSL · Los Angeles
- 2024 margin
- Solid D (+32.9) · D 64.8% · R 31.9% · Other 3.3%
- 2008→2024 swing
- -7.4pp toward R · 2008: 40.4pp · 2024: 32.9pp
- All cycles
- 2024: D+32.9 2020: D+44.2 2016: D+48.0 2012: D+40.0 2008: D+40.4
Not yet ingested
- Civics
- —
Market trends
- HPI YoY
- ▼ -625.31%
- Current HPI
- 480.8774
- Rent YoY
- ▲ 5.51%
- Metro
- Los Angeles-Long Beach-Anaheim, CA
- State GDP YoY
- ▲ 3.21%
- F500 in state
- 116
Industry mix (Fortune 500 HQ in CA)
| Industry | F500 HQs | Revenue |
|---|---|---|
| Technology | 27 | $1,492B |
|
||
| Financial Services | 3 | $174B |
|
||
| Retail | 3 | $44B |
|
||
| Insurance | 3 | $26B |
|
||
| Media / Entertainment | 2 | $115B |
|
||
| Pharmaceuticals / Biotech | 2 | $62B |
|
||
Price history
+2025.0% since first listed2 events — show timeline
- 2026-04-17 Listed $850,000 TheMLS
- 1977-10-03 Sold (Public Records) $40,000 Public Records
Property tax history
+10.0%/yrLatest (2025): $6,130 · +1.9% YoY. Source: county tax records.
Cash-flow waterfall
monthlySold comps — $/sqft
last 12 mo · ≤1 miLoading sold comps…