 Duplex
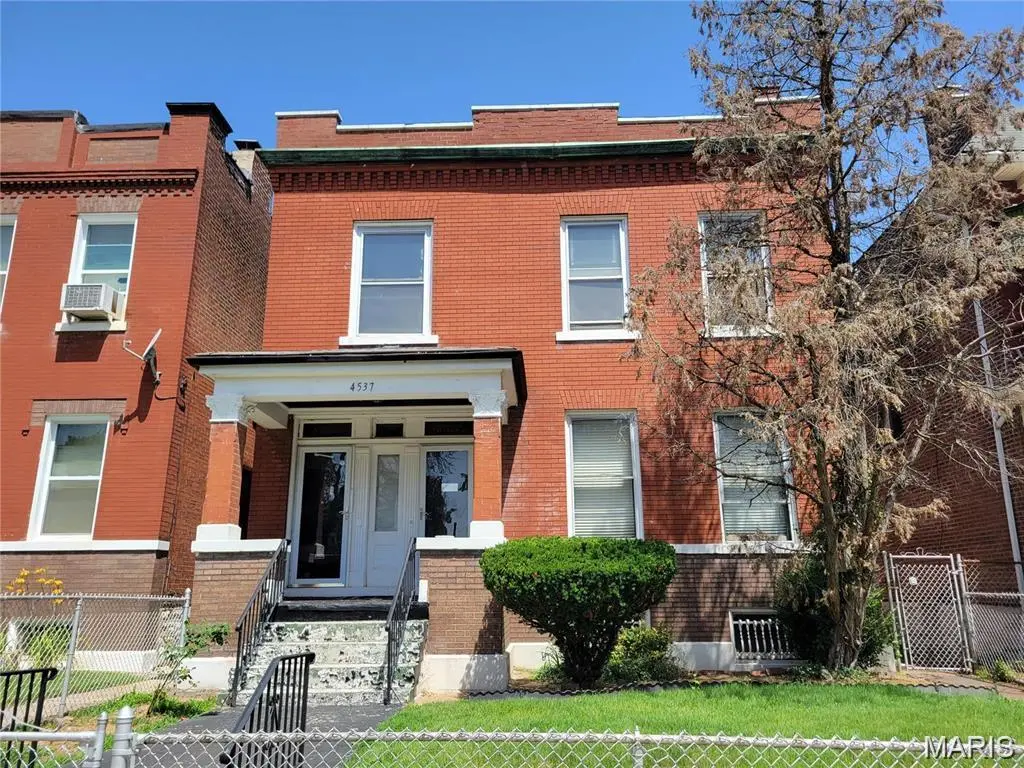
4537 Clarence Ave · St. Louis, MO
Flood risk 1/10 · Minimal
- FEMA flood zone
- X (unshaded)
- Chance of flooding over 30 yrs
- 0.0%
- Est. flood insurance / yr
- $473 – $860
Fire risk 1/10 · Minimal
- Est. fire insurance / yr
- $1,054 – $1,958
Heat risk 5/10 · Moderate
- Hot days now (above 107°F)
- 7 days/yr
- Hot days in 30 yrs
- 21 days/yr
Wind risk 2/10 · Minimal
- Chance of severe wind over 30 yrs
- 1.0%
Air-quality risk 4/10 · Minor
- Unhealthy air days now
- 5 days/yr
- Unhealthy air days in 30 yrs
- 6 days/yr
Risk factors via First Street. Map © Google.
Why this score? — see what drove the B- grade
The composite is a weighted blend of 9 inputs, each scored 0–100. Each bar is that input's sub-score; the figure is the points it added to the 100-point composite (weight × sub-score).
- Cash flow +30.0/30.0
- 1% rule +10.0/10.0
- DSCR +10.0/10.0
- ARV discount +7.5/15.0
- Appreciation +3.3/10.0
- Rent growth +2.5/5.0
- Livability +2.5/5.0
- Condition / age +2.5/5.0
- Schools +1.2/10.0
$130,000
🖨 Deal sheet 📄 Offer letter ✓ Due diligence
Multi-family units
County records classify this as Multi-Family (2-4 Unit). Listing-text estimate: 2 units. confirmed
Listing remarks MLS
Attention Investors!! Come take a look at this newly rehabbed 2 unit, 2bdr/1bth Duplex. This property is vacant, offering instant income and ready for your tenants to move in. The property is being sold As-Is, seller to make NO repairs or offer any warranty. Schedule your showing today, this opportunity will not last long.
Key facts
- 4,996 sq ft lot
- 2 garage spots
- Built 1908
Neighborhood map
What this means for you Summary
Snapshot
- This is a 2 × 2-bed/1-bath units multifamily listed at $130k.
Deal economics
- At list price, monthly cash flow is $791 ($9k/yr) — positive. Per door: $396/mo.
- The deal already cash-flows at list — no discount required.
- Meets the 1% rule at list price ($2k rent vs $130k).
- Recommended offer: $114k (12.0% below list) — sets the bar for market timing.
- Cap rate 13.6% vs local median 5.0% in St. Louis — top-decile yield for the area; either an underpriced asset or a hidden risk that comps aren't pricing in. Stress-test before assuming the spread holds.
Location & tenants
- Location reads: area grade B — affects rentability + tenant quality, not the cash-flow math above.
- St. Louis City (urban): math 10% / reading 18% proficiency, ranked #312 of 324 in MO (top 96%) — low school quality limits family demand, transient renter base, plan for 1-2y turnover; 80% free/reduced lunch — lower-income household profile, screen leases tightly.
- Market conditions: 97 active listings in the ZIP; 2 comparable units currently listed for rent nearby; lower-income renter base — watch delinquency; 294 units permitted in St. Louis city in 2024 (227 in 5+ unit buildings).
- At $1,974/mo this rent would consume 77% of the median local household income ($31k/yr) (locally 1655% of renters already pay >50% of income on rent) — very limited rent-growth headroom before tenants either downsize or default.
Forward outlook
- Local home prices are declining (-3.0%/yr); year-one equity from $899 of loan paydown is wiped out by about $4k of value loss. Plan a longer hold.
- St. Louis County population projected to shrink 6% by 2050 — rents likely to lag national; underwrite the cash flow, not the appreciation.
- At projected returns (-3.0% appreciation + 3.0% rent growth), your $36k cash investment doubles in ~5 years — after that, you're playing with house money.
Negotiation context
- It's been on market 158 days — a 12% lower offer ($114k) is reasonable based on typical stale-listing flexibility.
- 5 sale attempts since 4y ago with the ask held roughly flat each time — persistent listings suggest the price (not the market) is what's stuck; bring a comps-based counter.
Risks & watch-outs
- Watch-outs: built in 1908 — expect roof / HVAC / electrical / plumbing capex.
- Climate carrying-cost: extreme-heat days projected 7→21/yr by 2055 (HVAC capex compounding) — expect insurance premiums to compound above CPI over the hold.
Questions for the listing agent
- It's been on market 158 days. Have you received any prior offers? Is the seller open to a 12% concession, seller financing, or rate buy-down credit?
- Can we see the unit-by-unit rent roll, current vacancy, and any below-market leases? What's the average tenancy length?
- What capital expenditures (roof, boiler, parking lot, exteriors) have been made in the last 5 years, and what's planned in the next 2?
- Built in 1908 — when were the roof, HVAC, electrical panel, plumbing, and water heater last replaced?
- Why hasn't it sold? Are there any deal-killer items the seller is aware of (foundation, flood, title, zoning, code violations)?
- Is there a deadline driving the sale (1031 exchange, divorce, estate, relocation)? That informs how much negotiation room exists.
- What's the average days-on-market for RENTAL listings here right now (not sales)? A rising rental-DOM trend means longer vacancies and softer asking-rent achievability than the comps imply.
- What's the recent tenant-quality profile in this submarket — average credit score on applications, eviction rate, late-payment / NSF rate, and stable-employment percentage? A property-management company in the area should have these aggregated.
- How much new apartment / multifamily construction is in the pipeline within 1–3 miles? Heavy new supply (>2% of stock underway) typically softens rents 12–24 months out; light construction supports rent growth.
Investment metrics
- 1% rule
- 1.52% ✓
- Cap rate
- 13.59%
- Cash-on-cash
- 26.08%
- DSCR
- 2.16
- GRM
- 5.5
CMA / ARV
- ARV (median comp)
- $62,943
- List price
- $130,000
- Delta
- 106.54%
- Verdict
- OVERPRICED
- Comps
- 20 within 1.0 mi
Show comp detail 10 sales within ~0.75 mi
| Address | Dist | Beds/Ba | Sqft | Sold | Price | $/sf | Match |
|---|---|---|---|---|---|---|---|
| 4464 Holly Ave | 0.14mi | —/— | 2,874 (-10%) | 4mo | $24,900 | $9 | 74 |
| 4582 Clarence Ave | 0.09mi | 4/2.0 | 2,752 (-14%) | 4mo | $50,000 | $18 | 70 |
| 4535 Carrie Ave | 0.20mi | —/— | 2,788 (-13%) | 10mo | $35,000 | $13 | 61 |
| 4503 Clarence Ave | 0.07mi | —/— | 2,750 (-14%) | 17mo | $40,900 | $15 | 60 |
| 4417 Floriss Pl | 0.12mi | 6/4.0 | 3,536 (+11%) | 14mo | $148,888 | $42 | 57 |
| 4278 Lee Ave #4 | 0.49mi | 4/4.0 | 3,332 (+4%) | 14mo | $65,000 | $20 | 50 |
| 2147 Linton | 0.71mi | 4/4.0 | 3,234 (+1%) | 15mo | $239,000 | $74 | 44 |
| 4460 Bircher Blvd | 0.40mi | 4/4.0 | 3,638 (+14%) | 15mo | $150,000 | $41 | 37 |
| 4126 W Lee Ave | 0.54mi | 4/4.0 | 3,536 (+11%) | 16mo | $44,900 | $13 | 35 |
| 4200 College Ave | 0.75mi | 16/16.0 | 3,412 (+7%) | 0mo | $100,000 | $29 | 33 |
Match score weights: distance 35% · size 25% · config 20% · recency 20%. Top-matched comps best support the ARV.
Projected returns pro-forma
-3.0% appreciation · 3.0% rent growth · sell at horizon
- IRR
- 19.8%
- Equity multiple
- 1.80×
- Total profit
- $29,266
- Equity at exit
- $19,383
- IRR
- 28.0%
- Equity multiple
- 3.48×
- Total profit
- $90,156
- Equity at exit
- $11,240
Cash invested: $36,400 (down + closing). Projections, not guarantees.
Landlord ↔ Tenant lean methodology
- Overall (STATE)
- 81 Strongly Landlord-Friendly
- State Missouri
- 81 Strongly Landlord-Friendly · R+10
- County
- — inherits STATE
- City
- — inherits STATE
ZIP-level market 63115
- Home prices YoY
- -2.6%
- Active inventory
- 97
- Price-to-rent
- 11.0×
Monthly cashflow live
- Estimated rent
- $1,974 high interval (Pro) →
- Mortgage (P&I)
- −$682
- Tax from tax record
- −$33 /mo · $390/yr
- Insurance
- −$54
- HOA
- −$0
- Vacancy / Maint / Mgmt
- −$415
- Net cashflow
- $791
Break-even live
2-unit breakdown (identical units grouped — click to expand)
| Units | Beds | Baths | Est. rent |
|---|---|---|---|
| 2× units | 2 | 1 | $1,974 |
| #1 | 2 | 1 | $987 |
| #2 | 2 | 1 | $987 |
| Total (2 units) | $1,974 | ||
UW: 25.0% down · 7.5% · 30yr · 1.5% tax · 5.0% vac · 8.0% maint · 8.0% mgmt
Financing live
Cash to close
- Down payment
- $32,500
- Closing costs
- $3,900
- Reserves months
- —
- Total cash needed
- —
Loan-product check · same deal, 3 products live
Conventional
25% down · 7.5% · 30yr
- Down + closing
- —
- Monthly P&I
- —
- Monthly cashflow
- —
- DSCR
- —
- Eligible?
- —
Personal DTI + credit; lowest rate.
DSCR
20% down · 8.5% · 30yr
- Down + closing
- —
- Monthly P&I
- —
- Monthly cashflow
- —
- DSCR
- —
- Eligible?
- —
No personal income docs; deal must DSCR.
Hard money
10% down · 12.0% · 12mo
- Down + closing
- —
- Monthly P&I
- —
- Monthly cashflow
- —
- DSCR
- —
- Eligible?
- —
Short-term bridge; refi at stabilization.
Rent comps 2 comps
| Address | Beds | Baths | Sqft | Rent | $/sqft | DOM | Units | Dist |
|---|---|---|---|---|---|---|---|---|
| 4868 Farlin Ave Unit 2 St. Louis, MO | 2.0 | 1.0 | 2690 | $1,100 | $0.41 | 43d | 1 | 1.08mi |
| 3127 Clay Ave Unit B St. Louis, MO | 1.0 | 1.0 | 3536 | $950 | $0.27 | 43d | 1 | 1.15mi |
Listing history 28 events
-
2026-06-18days on market $130,000 Active 158 DOM
-
2026-06-17days on market $130,000 Active 157 DOM
-
2026-06-16days on market $130,000 Active 156 DOM
-
2026-06-15days on market $130,000 Active 155 DOM
-
2026-06-13days on market $130,000 Active 153 DOM
-
2026-06-09days on market $130,000 Active 149 DOM
-
2026-06-08days on market $130,000 Active 148 DOM
-
2026-06-08days on market $130,000 Active 147 DOM
-
2026-06-05days on market $130,000 Active 144 DOM
-
2026-06-03days on market $130,000 Active 143 DOM
-
2026-06-02days on market $130,000 Active 142 DOM
-
2026-06-01days on market $130,000 Active 141 DOM
-
2026-05-31days on market $130,000 Active 140 DOM
-
2026-01-11$130,000 Active 324-char remark
Show marketing remark (324 chars)
Attention Investors!! Come take a look at this newly rehabbed 2 unit, 2bdr/1bth Duplex. This property is vacant, offering instant income and ready for your tenants to move in. The property is being sold As-Is, seller to make NO repairs or offer any warranty. Schedule your showing today, this opportunity will not last long.
-
2025-09-17price $110,000
-
2025-08-14$125,000 Active
-
2025-08-14historical
-
2025-07-02$125,000 Active
-
2025-03-26price $137,900
-
2024-12-26$145,000 Active
-
2022-08-26soldstatus $126,000
-
2022-07-20soldstatus $71,000
-
2022-07-15status Pending
-
2022-07-15soldstatus Closed
-
2022-06-17historical Active Under Contract
-
2022-06-13$79,900 Active
-
2022-06-08historical $79,900
-
2009-10-23soldstatus
ⓘ Source: listings_history table (triggers on properties + properties_extension) + one-shot
backfill from property_details.listing_events for pre-trigger history.
Tax reassessment forecast MO · Resets to sale price
- Current annual tax
- $390 · $33/mo
- Projected year-2 tax
- $1,261 · $105/mo
- Expected delta
- +$871/yr (+$73/mo · 223.2%)
ⓘ Screening estimate from a state-policy table — verify with the county assessor before closing.
Climate risk First Street
- Flood 1/10 Low FEMA zone X (unshaded) · 0% chance over 30 yrs
- Wildfire 1/10 Low
- Heat 5/10 Major 7 d/yr ≥107°F today · 21 d/yr by 30 yrs out
- Wind 2/10 Low 100% chance of damaging wind over 30 yrs
- Air quality 4/10 Moderate 5 unhealthy d/yr today · 6 by 30 yrs out
Nearby sold comps map
Loading sold comps map…
Walkable amenities ~0.75 mi
Loading nearby amenities…
Taxation est. · year 1
- Rental income
- $23,688
- − Mortgage interest
- −$7,282
- − Property taxes
- −$390
- − Insurance
- −$650
- − Repairs & maintenance
- −$1,895
- − Management
- −$1,895
- − Depreciation
- −$3,782
- Taxable income
- $7,794
- Est. tax owed @ 24.0%
- −$1,871
- After-tax cash flow
- $7,622/yr
For passive investors: Depreciation is non-cash, so a rental often shows a tax loss while cash-flowing — sheltering income. Rental losses are passive: they offset passive income freely, and up to $25,000/yr can offset ordinary (W-2) income if you actively participate and your MAGI is under $100k (phasing out to $0 by $150k); unused losses carry forward. On sale, claimed depreciation is recaptured at up to 25%, and gains may owe capital-gains tax (a 1031 exchange can defer both). Figures are a year-1 estimate at your 24.0% rate — not tax advice; consult a CPA.
Schools (NCES district)
- District
- St. Louis City
- NCES district ID
- 2929280
- Math proficiency
- 10% ▼ -6.00%
- Reading proficiency
- 18% ▼ -3.00%
- Median HH income
- $35,685
- Composite
- 11.54/100
- National rank
- #9699
- State rank
- #312 of 324 in MO
Livability — St. Louis
No livability data for this city. (Only ~50 U.S. cities are tracked.)
Census & demographics
- Census place
- St. Louis, MO
- County
- Saint Louis City · 254,015 people
- City population
- 283,259
- Metro
- St. Louis, MO-IL
- Population (ZIP)
- 14,488
- Household income
- $30,622
- Rent vs Own
- Severe rent burden
- 1655.0
Population outlook (St. Louis County) Hauer SSP2
- Today (2025)
- 315,737 people
- By 2030
- 313,865 · -0.6%
- By 2040
- 305,439 · -3.3%
- By 2050
- 296,529 · -6.1%
- By 2075
- 271,028 · -14.2%
- By 2100
- 255,359 · -19.1%
Race, ethnicity, and origin ACS 2023
- Neighborhood character
- Predominantly Black (95%)
- Race & ethnicity
- Black 95% White 2% Two or more races 2%
- Foreign-born
- 0%
Political lean MEDSL · St. Louis
- 2024 margin
- Solid D (+64.7) · D 81.4% · R 16.7% · Other 2.0%
- 2008→2024 swing
- -3.5pp toward R · 2008: 68.2pp · 2024: 64.7pp
- All cycles
- 2024: D+64.7 2020: D+66.2 2016: D+63.7 2012: D+66.6 2008: D+68.2
Not yet ingested
- Civics
- —
Market trends
- HPI YoY
- ▼ -3.42%
- Current HPI
- 127.3403
- Rent YoY
- —
- Metro
- St. Louis, MO-IL
- State GDP YoY
- ▲ 1.84%
- F500 in state
- 20
Industry mix (Fortune 500 HQ in MO)
| Industry | F500 HQs | Revenue |
|---|---|---|
| Healthcare | 1 | $163B |
|
||
| Insurance | 1 | $21B |
|
||
| Industrial Technology | 1 | $17B |
|
||
| Retail | 1 | $16B |
|
||
| Industrial Distribution | 1 | $10B |
|
||
| Utilities | 1 | $9B |
|
||
Price history
+62.7% since first listed15 events — show timeline
- 2026-01-11 Listed $130,000 MARIS as Distributed by MLS Grid
- 2025-09-17 Price Changed $110,000 MARIS as Distributed by MLS Grid
- 2025-08-14 Listed $125,000 MARIS as Distributed by MLS Grid
- 2025-08-14 Coming Soon — MARIS as Distributed by MLS Grid
- 2025-07-02 Listed $125,000 MARIS as Distributed by MLS Grid
- 2025-03-26 Price Changed $137,900 MARIS as Distributed by MLS Grid
- 2024-12-26 Listed $145,000 MARIS as Distributed by MLS Grid
- 2022-08-26 Sold (Public Records) $126,000 Public Records
- 2022-07-20 Sold (Public Records) $71,000 Public Records
- 2022-07-15 Pending — MARIS as Distributed by MLS Grid
- 2022-07-15 Sold (MLS) — MARIS as Distributed by MLS Grid
- 2022-06-17 Contingent — MARIS as Distributed by MLS Grid
- 2022-06-13 Listed $79,900 MARIS as Distributed by MLS Grid
- 2022-06-08 Coming Soon $79,900 MARIS as Distributed by MLS Grid
- 2009-10-23 Sold (Public Records) — Public Records
Property tax history
-1.4%/yrLatest (2023): $390 · -1.8% YoY. Source: county tax records.
Cash-flow waterfall
monthlySold comps — $/sqft
last 12 mo · ≤1 miLoading sold comps…