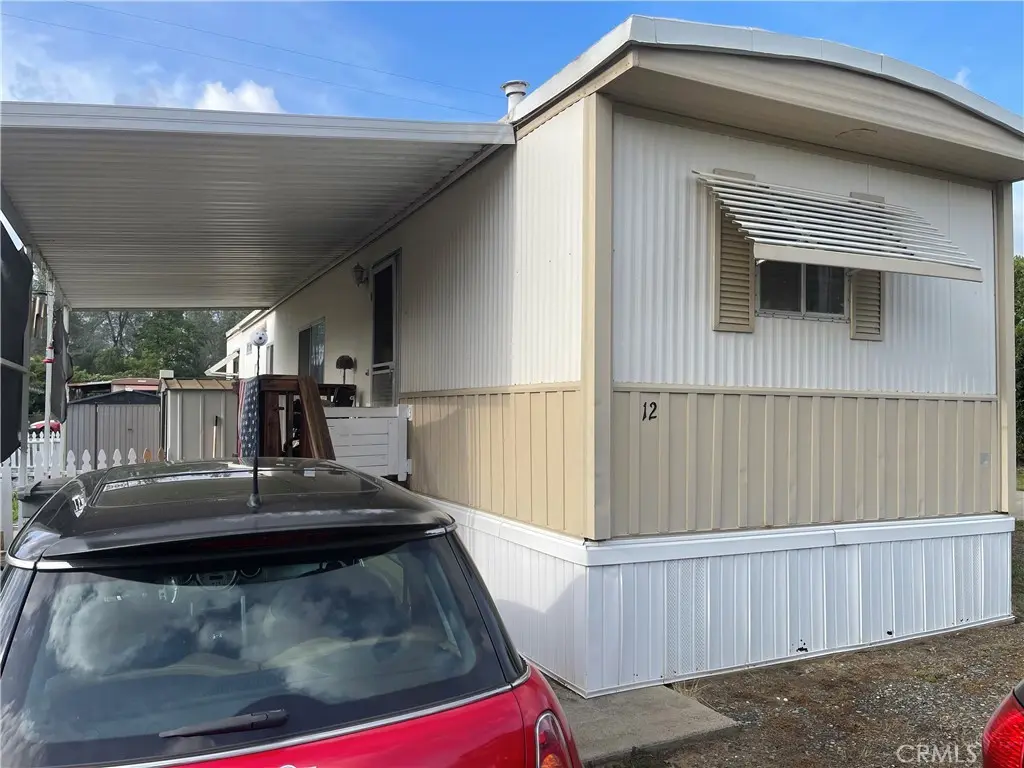
12 FIRLOOP Cir #12 · Palermo, CA
Flood risk 1/10 · Minimal
- FEMA flood zone
- X (unshaded)
- Chance of flooding over 30 yrs
- 0.0%
- Est. flood insurance / yr
- $507 – $1,088
Fire risk 10/10 · Severe
- Est. fire insurance / yr
- $659 – $1,223
Heat risk 8/10 · Major
- Hot days now (above 105°F)
- 7 days/yr
- Hot days in 30 yrs
- 16 days/yr
Wind risk 1/10 · Minimal
- Chance of severe wind over 30 yrs
- —
Air-quality risk 10/10 · Severe
- Unhealthy air days now
- 34 days/yr
- Unhealthy air days in 30 yrs
- 39 days/yr
Risk factors via First Street. Map © Google.
Why this score? — see what drove the D grade
The composite is a weighted blend of 9 inputs, each scored 0–100. Each bar is that input's sub-score; the figure is the points it added to the 100-point composite (weight × sub-score).
- Cash flow +15.0/30.0
- ARV discount +7.5/15.0
- 1% rule +5.0/10.0
- DSCR +5.0/10.0
- Condition / age +3.8/5.0
- Rent growth +2.5/5.0
- Schools +2.5/10.0
- Livability +2.4/5.0
- Appreciation +0.0/10.0
$35,000
🖨 Deal sheet 📄 Offer letter ✓ Due diligence
Listing remarks
Great location and price for this little gem of a home. Nicely renovated to make it feel like home. Some new flooring, updated bathroom, washer and dryer included along with some furniture. Nice little yard to complete the home. Plenty of storage with two sheds. Make an appointment today to see if this is the new home
Key facts
- Renovated
- Plenty of storage
- New flooring
Tags
Property features AI
Finance
- Other: Park name: Town and Country; Located via Lincoln Blvd past Ophir Road to Town and Country mobile home park
- HOA & community: Senior community; Manager approval required; Breed restrictions for pets; Community features: biking, fishing, foothills
Exterior
- Parking: Located in Town and Country mobile home park
- Utilities: Standard electric service; Natural gas connected; Public/district water; Public sewer
- Home design: Single-story property; Mobile home on-site (12 x 60); Mobile home remains
- Construction: Pillar/post/pier foundation
- Exterior features: Front porch; Patio; Has a view; Lot density: 0–1 unit per acre
Interior
- Kitchen: Gas cooktop; Gas oven; Refrigerator; Formica counters
- Bedrooms: All bedrooms on main floor; Main floor primary bedroom
- Flooring: Carpet; Laminate
- Bathrooms: 1 full bathroom; Upgraded bathroom; Walk-in shower; Formica counters in bathroom
- Heating & cooling: Central furnace heating; Evaporative cooling
- Interior features: Partially furnished; Storage space; Formica counters; No interior steps; One-level home; Entry at street level
- Laundry & utility: Washer included; Dryer included; Washer hookup; Inside laundry (in kitchen)
Neighborhood map
What this means for you Summary
Snapshot
- This is a 2-bed/1.0-bath manufactured listed at $35k. Condition is rated good.
Deal economics
- At list price, monthly cash flow is $949 ($11k/yr) — positive.
- The deal already cash-flows at list — no discount required.
- Meets the 1% rule at list price ($1k rent vs $35k).
- Recommended offer: $34k (3.0% below list) — sets the bar for market timing.
- Cap rate 38.8% vs local median 3.8% in Palermo — top-decile yield for the area; either an underpriced asset or a hidden risk that comps aren't pricing in. Stress-test before assuming the spread holds.
Location & tenants
- Location reads 48/100 on livability (#1,219 in CA) — a working-class tenant base; expect higher turnover. Strengths: housing B+; Watch: schools F, crime F, amenities F.
- Palermo Union Elementary (town): math 20% / reading 33% proficiency, ranked #1,149 of 1,400 in CA (top 82%) — low school quality limits family demand, transient renter base, plan for 1-2y turnover; 72% free/reduced lunch — lower-income household profile, screen leases tightly.
- Market conditions: 372 active listings in the ZIP; 946 units permitted in Butte County in 2024 (254 in 5+ unit buildings).
Forward outlook
- Local home prices are declining (-3.0%/yr); year-one equity from $242 of loan paydown is wiped out by about $1k of value loss. Plan a longer hold.
- Butte County population projected at +10% by 2050 — modest demand growth; plan on rents tracking national, not racing it.
- At projected returns (-3.0% appreciation + 3.0% rent growth), your $10k cash investment doubles in ~1 year — after that, you're playing with house money.
Negotiation context
- It's been on market 54 days — a 3% lower offer ($34k) is reasonable based on typical stale-listing flexibility.
- 2 sale attempts since 2y ago; this cycle's ask has dropped $5k (12%) from the opening price — seller is motivated, your offer sets the floor, not the list.
Risks & watch-outs
- Climate carrying-cost: severe wildfire risk; extreme-heat days projected 7→16/yr by 2055 (HVAC capex compounding) — expect insurance premiums to compound above CPI over the hold.
Questions for the listing agent
- It's been on market 54 days. Have you received any prior offers? Is the seller open to a 3% concession, seller financing, or rate buy-down credit?
- Built in 1972 — when were the roof, HVAC, electrical panel, plumbing, and water heater last replaced?
- Is there a deadline driving the sale (1031 exchange, divorce, estate, relocation)? That informs how much negotiation room exists.
- Schools are F-rated, which usually means shorter tenancies and higher turnover. Who's the typical renter profile here, and what's been the actual vacancy rate?
- Crime grade is F in this area — have there been break-ins, vandalism, or insurance claims at this property in the last 3 years? What carrier currently insures it and at what premium?
- The area grade is low — what's the realistic commute time and amenity access for the typical tenant pool here? Any planned neighborhood developments (good or bad) we should know about?
- What's the average days-on-market for RENTAL listings here right now (not sales)? A rising rental-DOM trend means longer vacancies and softer asking-rent achievability than the comps imply.
- What's the recent tenant-quality profile in this submarket — average credit score on applications, eviction rate, late-payment / NSF rate, and stable-employment percentage? A property-management company in the area should have these aggregated.
- How much new for-sale + rental construction is in the pipeline within 1–3 miles? Heavy new supply typically softens prices + rents 12–24 months out; constrained supply supports both.
Investment metrics
- 1% rule
- 4.21% ✓
- Cap rate
- 38.82%
- Cash-on-cash
- 116.17%
- DSCR
- 6.17
- GRM
- 2.0
CMA / ARV
- ARV (on-the-fly)
- $16,464
- Comps found
- 4
Show comp detail 4 sales within ~0.75 mi
| Address | Dist | Beds/Ba | Sqft | Sold | Price | $/sf | Match |
|---|---|---|---|---|---|---|---|
| 6368 Lincoln Blvd #28 | 0.21mi | 2/1.0 | 816 (+4%) | 5mo | $17,000 | $21 | 80 |
| 6580 Lincoln #20 | 0.03mi | 2/1.0 | 720 (-8%) | 21mo | $8,500 | $12 | 68 |
| 6368 Lincoln Blvd #33 | 0.21mi | 1/1.0 (-1) | 753 (-4%) | 14mo | $17,000 | $23 | 67 |
| 6368 Lincoln Blvd #21 | 0.21mi | 2/2.0 | 876 (+12%) | 7mo | $16,500 | $19 | 61 |
Match score weights: distance 35% · size 25% · config 20% · recency 20%. Top-matched comps best support the ARV.
Projected returns pro-forma
-3.0% appreciation · 3.0% rent growth · sell at horizon
- IRR
- —
- Equity multiple
- 6.59×
- Total profit
- $54,758
- Equity at exit
- $5,219
- IRR
- —
- Equity multiple
- 13.81×
- Total profit
- $125,512
- Equity at exit
- $3,026
Cash invested: $9,800 (down + closing). Projections, not guarantees.
Landlord ↔ Tenant lean methodology
- Overall (STATE)
- 18 Strongly Tenant-Friendly
- State California
- 18 Strongly Tenant-Friendly · D+13
- County
- — inherits STATE
- City
- — inherits STATE
ZIP-level market 95966
- Active inventory
- 372
- Price-to-rent
- 2.0×
Monthly cashflow live
- Estimated rent
- $1,474 medium interval (Pro) →
- Mortgage (P&I)
- −$184
- Tax from tax record
- −$18 /mo · $216/yr
- Insurance
- −$15
- HOA
- −$0
- Vacancy / Maint / Mgmt
- −$310
- Net cashflow
- $949
Break-even live
UW: 25.0% down · 7.5% · 30yr · 1.5% tax · 5.0% vac · 8.0% maint · 8.0% mgmt
Financing live
Cash to close
- Down payment
- $8,750
- Closing costs
- $1,050
- Reserves months
- —
- Total cash needed
- —
Loan-product check · same deal, 3 products live
Conventional
25% down · 7.5% · 30yr
- Down + closing
- —
- Monthly P&I
- —
- Monthly cashflow
- —
- DSCR
- —
- Eligible?
- —
Personal DTI + credit; lowest rate.
DSCR
20% down · 8.5% · 30yr
- Down + closing
- —
- Monthly P&I
- —
- Monthly cashflow
- —
- DSCR
- —
- Eligible?
- —
No personal income docs; deal must DSCR.
Hard money
10% down · 12.0% · 12mo
- Down + closing
- —
- Monthly P&I
- —
- Monthly cashflow
- —
- DSCR
- —
- Eligible?
- —
Short-term bridge; refi at stabilization.
Listing history 20 events
-
2026-06-19days on market $35,000 Active 54 DOM
-
2026-06-18days on market $35,000 Active 53 DOM
-
2026-06-17days on market $35,000 Active 52 DOM
-
2026-06-16days on market $35,000 Active 51 DOM
-
2026-06-15days on market $35,000 Active 50 DOM
-
2026-06-14days on market $35,000 Active 48 DOM
-
2026-06-13days on market $35,000 Active 47 DOM
-
2026-06-10days on market $35,000 Active 45 DOM
-
2026-06-09days on market $35,000 Active 44 DOM
-
2026-06-08days on market $35,000 Active 43 DOM
-
2026-06-07days on market $35,000 Active 42 DOM
-
2026-06-05days on market $35,000 Active 39 DOM
-
2026-06-02days on market $35,000 Active 37 DOM
-
2026-06-01days on market $35,000 Active 36 DOM
-
2026-05-31days on market $35,000 Active 35 DOM
-
2026-05-30days on market $35,000 Active 34 DOM
-
2026-05-06price $35,000
-
2026-04-26$40,000 Active
-
2024-12-01historical
-
2024-11-04$31,500 Active
ⓘ Source: listings_history table (triggers on properties + properties_extension) + one-shot
backfill from property_details.listing_events for pre-trigger history.
Tax reassessment forecast CA · Resets to sale price
- Current annual tax
- $216 · $18/mo
- Projected year-2 tax
- $266 · $22/mo
- Expected delta
- +$50/yr (+$4/mo · 23.0%)
ⓘ Screening estimate from a state-policy table — verify with the county assessor before closing.
Climate risk First Street
- Flood 1/10 Low FEMA zone X (unshaded) · 0% chance over 30 yrs
- Wildfire 10/10 Extreme
- Heat 8/10 Severe 7 d/yr ≥105°F today · 16 d/yr by 30 yrs out
- Wind 1/10 Low
- Air quality 10/10 Extreme 34 unhealthy d/yr today · 39 by 30 yrs out
Nearby sold comps map
Loading sold comps map…
Walkable amenities ~0.75 mi
Loading nearby amenities…
Taxation est. · year 1
- Rental income
- $17,694
- − Mortgage interest
- −$1,961
- − Property taxes
- −$216
- − Insurance
- −$175
- − Repairs & maintenance
- −$1,416
- − Management
- −$1,416
- − Depreciation
- −$1,018
- Taxable income
- $11,493
- Est. tax owed @ 24.0%
- −$2,758
- After-tax cash flow
- $8,626/yr
For passive investors: Depreciation is non-cash, so a rental often shows a tax loss while cash-flowing — sheltering income. Rental losses are passive: they offset passive income freely, and up to $25,000/yr can offset ordinary (W-2) income if you actively participate and your MAGI is under $100k (phasing out to $0 by $150k); unused losses carry forward. On sale, claimed depreciation is recaptured at up to 25%, and gains may owe capital-gains tax (a 1031 exchange can defer both). Figures are a year-1 estimate at your 24.0% rate — not tax advice; consult a CPA.
Condition & rehab AI · 12 photos
This manufactured home is in good condition with some cosmetic updates needed. The interior is dated but can be modernized with new cabinets and paint, increasing both resale and rental value.
Repairs flagged
- Minor kitchen cabinets — Older style, could be updated
- Minor bathroom cabinets — Older style, could be updated
- Minor exterior siding — Some discoloration
Value-add opportunities
- Both Paint exterior — Enhances curb appeal and value
- Both Replace kitchen cabinets — Modernizes the space and increases value
- Both Replace bathroom cabinets — Modernizes the space and increases value
Renovation cost estimate screening
| Repair item | Severity | Est. cost |
|---|---|---|
| kitchen cabinets · Older style, could be updated | Minor | $500–3,000 |
| bathroom cabinets · Older style, could be updated | Minor | $500–3,000 |
| exterior siding · Some discoloration | Minor | $500–3,000 |
| Total estimated repair cost · 3 items | $1,500–9,000 |
Value-add ROI direction
- Both Paint exterior — Enhances curb appeal and value ↑
- Both Replace kitchen cabinets — Modernizes the space and increases value ↑
- Both Replace bathroom cabinets — Modernizes the space and increases value ↑
ⓘ Cost ranges are severity-bucket heuristics (US national rule-of-thumb). Get contractor quotes + a written scope before underwriting a rehab budget.
Schools (NCES district)
- District
- Palermo Union Elementary
- NCES district ID
- 0629540
- Math proficiency
- 20% ▲ 1.00%
- Reading proficiency
- 33% ▬ 0.00%
- Median HH income
- $39,628
- Composite
- 25.26/100
- National rank
- #12903
- State rank
- #1149 of 1400 in CA
Livability — Palermo
- Score
- 48/100
- State rank
- #1219
- US rank
- #26161
Category grades
Schools grade is shown separately in the Schools card above.
Census & demographics
- Census place
- Palermo, CA
- County
- Butte County · 175,030 people
- City population
- 1,346
- Metro
- Chico, CA
- Population (ZIP)
- 28,503
- Household income
- $65,586
- Rent vs Own
- Severe rent burden
- 807.0
Population outlook (Butte County) Hauer SSP2
- Today (2025)
- 237,527 people
- By 2030
- 243,804 · +2.6%
- By 2040
- 253,899 · +6.9%
- By 2050
- 262,561 · +10.5%
- By 2075
- 283,709 · +19.4%
- By 2100
- 282,689 · +19.0%
Race, ethnicity, and origin ACS 2023
- Neighborhood character
- Predominantly White (67%)
- Race & ethnicity
- White 67% Hispanic / Latino 18% Two or more races 14% Asian 6% Native American 2% Black 2%
- Hispanic origin (detail)
- Mexican 16%
- Common ancestry
- Lithuanian 3% Slovak 3% Portuguese 2%
- Foreign-born
- 6% · Canada
- Languages at home
- 88% English-only · Spanish 7% Other Asian/Pacific 3% Russian/Polish/Slavic 1%
Political lean MEDSL · Butte
- 2024 margin
- Toss-up / Even · D 46.8% · R 49.9% · Other 3.3%
- 2008→2024 swing
- -5.5pp toward R · 2008: 2.4pp · 2024: -3.1pp
- All cycles
- 2024: R+3.1 2020: D+1.7 2016: R+4.0 2012: R+3.9 2008: D+2.4
Not yet ingested
- Civics
- —
Market trends
- HPI YoY
- ▼ -284.58%
- Current HPI
- 267.1415
- Rent YoY
- —
- Metro
- Chico, CA
- State GDP YoY
- ▲ 3.21%
- F500 in state
- 116
Industry mix (Fortune 500 HQ in CA)
| Industry | F500 HQs | Revenue |
|---|---|---|
| Technology | 27 | $1,492B |
|
||
| Financial Services | 3 | $174B |
|
||
| Retail | 3 | $44B |
|
||
| Insurance | 3 | $26B |
|
||
| Media / Entertainment | 2 | $115B |
|
||
| Pharmaceuticals / Biotech | 2 | $62B |
|
||
Price history
+11.1% since first listed4 events — show timeline
- 2026-05-06 Price Changed $35,000 CRMLS
- 2026-04-26 Listed $40,000 CRMLS
- 2024-12-01 Listing Removed — CRMLS
- 2024-11-04 Listed $31,500 CRMLS
Property tax history
+1.4%/yrLatest (2025): $216 · +1.4% YoY. Source: county tax records.
Cash-flow waterfall
monthlySold comps — $/sqft
last 12 mo · ≤1 miLoading sold comps…