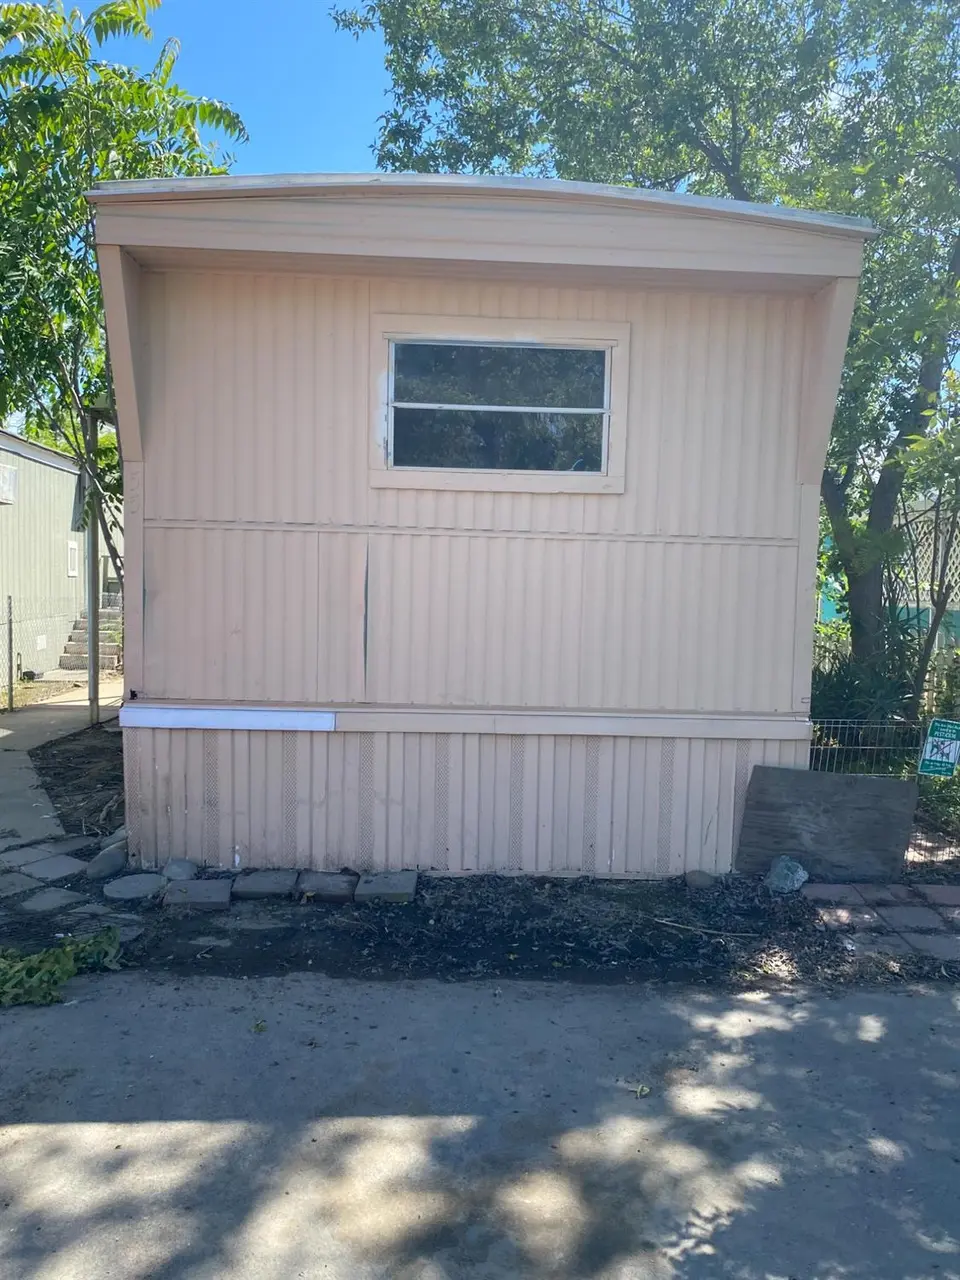
1750 Auburn Blvd #55 · Sacramento, CA
Flood risk 7/10 · Major
- FEMA flood zone
- X (unshaded)
- Chance of flooding over 30 yrs
- 0.77%
- Est. flood insurance / yr
- $507 – $1,088
Fire risk 1/10 · Minimal
- Est. fire insurance / yr
- $659 – $1,223
Heat risk 7/10 · Major
- Hot days now (above 102°F)
- 7 days/yr
- Hot days in 30 yrs
- 15 days/yr
Wind risk 1/10 · Minimal
- Chance of severe wind over 30 yrs
- —
Air-quality risk 10/10 · Severe
- Unhealthy air days now
- 33 days/yr
- Unhealthy air days in 30 yrs
- 38 days/yr
Risk factors via First Street. Map © Google.
Why this score? — see what drove the D grade
The composite is a weighted blend of 9 inputs, each scored 0–100. Each bar is that input's sub-score; the figure is the points it added to the 100-point composite (weight × sub-score).
- Cash flow +15.0/30.0
- ARV discount +7.5/15.0
- 1% rule +5.0/10.0
- DSCR +5.0/10.0
- Livability +3.6/5.0
- Schools +3.1/10.0
- Rent growth +2.9/5.0
- Condition / age +2.5/5.0
- Appreciation +0.0/10.0
$19,995
🖨 Deal sheet 📄 Offer letter ✓ Due diligence
Listing remarks
2-bedroom, 2-bath home conveniently located near freeway access, Haggin Oaks Golf Course, and Arden Fair Mall. Property offers great potential for renovation and customization. Home requires repairs and is being sold as-is. Ideal for investors or buyers looking to add value. Buyer must be approved by park management.
Key facts
- Built 1970
- Listed 31 days
Neighborhood map
What this means for you Summary
Snapshot
- This is a 2-bed/2.0-bath manufactured listed at $20k.
Deal economics
- At list price, monthly cash flow is $1k ($12k/yr) — positive.
- The deal already cash-flows at list — no discount required.
- Meets the 1% rule at list price ($2k rent vs $20k).
- Recommended offer: $19k (3.0% below list) — sets the bar for market timing.
- Cap rate 70.8% vs local median 3.0% in Sacramento — top-decile yield for the area; either an underpriced asset or a hidden risk that comps aren't pricing in. Stress-test before assuming the spread holds.
Location & tenants
- Location reads 71/100 on livability (#218 in CA) — a middle-class / working-renter tenant base. Strengths: amenities A+, commute A+, housing A; Watch: schools D+, crime F, cost of living F.
- Twin Rivers Unified (suburban): math 29% / reading 37% proficiency, ranked #970 of 1,400 in CA (top 69%) — families likely to look elsewhere, expect single-tenant / working-renter base with shorter leases; 76% free/reduced lunch — lower-income household profile, screen leases tightly.
- Market conditions: Rents rising (+1.5%/yr); 98 active listings in the ZIP; 40 comparable units currently listed for rent nearby; rentals at typical pace (median 17d on market — plan ~3-4 weeks tenant-placement turnaround); 6,825 units permitted in Sacramento County in 2024 (1,752 in 5+ unit buildings).
- This rent runs 30% of the median local income ($60k/yr) — at the standard rent-burdened threshold; future hikes will face affordability resistance.
Forward outlook
- Local home prices are declining (-3.0%/yr); year-one equity from $138 of loan paydown is wiped out by about $600 of value loss. Plan a longer hold.
- Sacramento County population projected at +17% by 2050 — long-run rental-demand tailwind backs the buy-and-hold thesis.
- At projected returns (-3.0% appreciation + 1.5% rent growth), your $6k cash investment doubles in ~1 year — after that, you're playing with house money.
Negotiation context
- It's been on market 31 days — a 3% lower offer ($19k) is reasonable based on typical stale-listing flexibility.
Risks & watch-outs
- Watch-outs: flood insurance adds $66/mo.
- Climate carrying-cost: major flood risk; extreme-heat days projected 7→15/yr by 2055 (HVAC capex compounding) — expect insurance premiums to compound above CPI over the hold.
Questions for the listing agent
- It's been on market 31 days. Have you received any prior offers? Is the seller open to a 3% concession, seller financing, or rate buy-down credit?
- Built in 1970 — when were the roof, HVAC, electrical panel, plumbing, and water heater last replaced?
- What's the actual annual flood-insurance premium (NFIP or private), and is the property in a SFHA with mandatory coverage?
- Is there a deadline driving the sale (1031 exchange, divorce, estate, relocation)? That informs how much negotiation room exists.
- Schools are D-rated, which usually means shorter tenancies and higher turnover. Who's the typical renter profile here, and what's been the actual vacancy rate?
- Crime grade is F in this area — have there been break-ins, vandalism, or insurance claims at this property in the last 3 years? What carrier currently insures it and at what premium?
- The area grade is low — what's the realistic commute time and amenity access for the typical tenant pool here? Any planned neighborhood developments (good or bad) we should know about?
- What's the average days-on-market for RENTAL listings here right now (not sales)? A rising rental-DOM trend means longer vacancies and softer asking-rent achievability than the comps imply.
- What's the recent tenant-quality profile in this submarket — average credit score on applications, eviction rate, late-payment / NSF rate, and stable-employment percentage? A property-management company in the area should have these aggregated.
- How much new for-sale + rental construction is in the pipeline within 1–3 miles? Heavy new supply typically softens prices + rents 12–24 months out; constrained supply supports both.
Investment metrics
- 1% rule
- 7.58% ✓
- Cap rate
- 70.80%
- Cash-on-cash
- 230.38%
- DSCR
- 11.25
- GRM
- 1.1
CMA / ARV
- ARV (median comp)
- $73,891
- List price
- $19,995
- Delta
- -72.94%
- Verdict
- UNDERPRICED
- Comps
- 7 within 2.0 mi
Show comp detail 2 sales within ~0.75 mi
| Address | Dist | Beds/Ba | Sqft | Sold | Price | $/sf | Match |
|---|---|---|---|---|---|---|---|
| 1750 Auburn Blvd #55 | 0.00mi | 2/2.0 | 720 (0%) | 1mo | $7,500 | $10 | 99 |
| 1750 Auburn Blvd #28 | 0.04mi | 1/1.0 (-1) | 750 (+4%) | 15mo | $3,500 | $5 | 70 |
Match score weights: distance 35% · size 25% · config 20% · recency 20%. Top-matched comps best support the ARV.
Projected returns pro-forma
-3.0% appreciation · 1.52% rent growth · sell at horizon
- IRR
- —
- Equity multiple
- 11.51×
- Total profit
- $58,815
- Equity at exit
- $2,981
- IRR
- —
- Equity multiple
- 23.38×
- Total profit
- $125,279
- Equity at exit
- $1,729
Cash invested: $5,599 (down + closing). Projections, not guarantees.
Landlord ↔ Tenant lean methodology
- Overall (STATE)
- 18 Strongly Tenant-Friendly
- State California
- 18 Strongly Tenant-Friendly · D+13
- County
- — inherits STATE
- City
- — inherits STATE
ZIP-level market 95815
- Home prices YoY
- -32.2%
- Rents YoY
- 1.5%
- Active inventory
- 98
- Price-to-rent
- 1.1×
Monthly cashflow live
- Estimated rent
- $1,515 high interval (Pro) →
- Mortgage (P&I)
- −$105
- Tax from tax record
- −$9 /mo · $104/yr
- Insurance
- −$8
- Flood insurance flood zone
- −$66 /mo · $798/yr
- HOA
- −$0
- Vacancy / Maint / Mgmt
- −$318
- Net cashflow
- $1,008
Break-even live
UW: 25.0% down · 7.5% · 30yr · 1.5% tax · 5.0% vac · 8.0% maint · 8.0% mgmt
Financing live
Cash to close
- Down payment
- $4,999
- Closing costs
- $600
- Reserves months
- —
- Total cash needed
- —
Loan-product check · same deal, 3 products live
Conventional
25% down · 7.5% · 30yr
- Down + closing
- —
- Monthly P&I
- —
- Monthly cashflow
- —
- DSCR
- —
- Eligible?
- —
Personal DTI + credit; lowest rate.
DSCR
20% down · 8.5% · 30yr
- Down + closing
- —
- Monthly P&I
- —
- Monthly cashflow
- —
- DSCR
- —
- Eligible?
- —
No personal income docs; deal must DSCR.
Hard money
10% down · 12.0% · 12mo
- Down + closing
- —
- Monthly P&I
- —
- Monthly cashflow
- —
- DSCR
- —
- Eligible?
- —
Short-term bridge; refi at stabilization.
Rent comps 40 comps
| Address | Beds | Baths | Sqft | Rent | $/sqft | DOM | Units | Dist |
|---|---|---|---|---|---|---|---|---|
| 2020 Red Robin Ln Sacramento, CA | 2.0 | 1.0 | 700 | $1,650 | $2.36 | 23d | 1 | 0.40mi |
| 2850 Darwin St Sacramento, CA | 1.0 | 1.0 | 530 | $1,300 | $2.45 | 7d | 4 | 0.44mi |
| 2068 Red Robin Ln Sacramento, CA | 1.0 | 1.0 | 700 | $1,350 | $1.93 | 7d | 2 | 0.46mi |
| 2540 Crosby Way Unit 2548 Sacramento, CA | 1.0 | 1.0 | 480 | $1,250 | $2.60 | 1d | 1 | 0.47mi |
| 2121 Edison Ave Sacramento, CA | 1.0 | 1.0 | 580 | $1,300 | $2.24 | 43d | 1 | 0.54mi |
| 1520 Frienza Ave Sacramento, CA | 2.0 | 1.0 | 750 | $1,395 | $1.86 | 43d | 1 | 0.55mi |
| 2630 Darwin St #11 Sacramento, CA | 2.0 | 2.0 | 700 | $1,595 | $2.28 | 43d | 1 | 0.56mi |
| 2630 Darwin St #7 Sacramento, CA | 1.0 | 1.0 | 350 | $1,195 | $3.41 | 43d | 1 | 0.56mi |
| 1550 Arcade Blvd Unit 12 Sacramento, CA | 1.0 | 1.0 | 450 | $1,100 | $2.44 | 17d | 1 | 0.57mi |
| 3036 Marysville Blvd Sacramento, CA | 1.0 | 1.0 | 480 | $1,500 | $3.12 | 1d | 1 | 0.60mi |
| 3120 Howe Ave Sacramento, CA | 1.0 | 1.0 | 725 | $1,350 | $1.86 | 23d | 1 | 0.61mi |
| 2408 Albatross Way Sacramento, CA | 1.0–2.0 | 1.0 | 750 | $1,700 | $2.27 | 1d | 1 | 0.66mi |
| 3101 Truax Ct Sacramento, CA | 1.0–2.0 | 1.0 | 667 | $1,495 | $2.24 | 7d | 4 | 0.68mi |
| 2228 Edison Ave Sacramento, CA | 1.0–2.0 | 1.0–2.0 | 706 | $1,914 | $2.71 | 1d | 6 | 0.69mi |
| 2381 Ethan Way Apt 1 Sacramento, CA | 1.0 | 1.0 | 683 | $1,395 | $2.04 | 7d | 1 | 0.72mi |
| 2318 Church Ave Unit 8 Sacramento, CA | 2.0 | 1.0 | 725 | $1,150 | $1.59 | 14d | 1 | 0.87mi |
| 2559 Clay St Sacramento, CA | 1.0 | 1.0 | 690 | $1,250 | $1.81 | 1d | 1 | 0.89mi |
| 2315 Edison Ave #3 Sacramento, CA | 1.0 | 1.0 | 600 | $1,225 | $2.04 | 3d | 1 | 0.90mi |
| 1567 Bartlett Ln Sacramento, CA | 3.0 | 1.0–3.5 | 1200 | $2,850 | $2.37 | 1d | 25 | 0.98mi |
| 2553 Lexington St Unit C Sacramento, CA | 1.0 | 1.0 | 550 | $1,195 | $2.17 | 20d | 1 | 1.03mi |
| 1542 Bartlett Ln Sacramento, CA | 3.0 | 1.0–3.5 | 1141 | $3,088 | $2.71 | 1d | 33 | 1.04mi |
| 2340 Edison Ave Sacramento, CA | 1.0 | 1.0 | 623 | $1,300 | $2.09 | 23d | 1 | 1.04mi |
| 1065 Santiago Ave Unit 6 Sacramento, CA | 2.0 | 1.0 | 650 | $1,450 | $2.23 | 1d | 1 | 1.04mi |
| 2400 Edison Ave Unit 3250 Sacramento, CA | 1.0 | 1.0 | 523 | $1,295 | $2.48 | 16d | 1 | 1.12mi |
| 2400 Edison Ave Sacramento, CA | 1.0 | 1.0 | 523 | $1,195 | $2.28 | 43d | 1 | 1.12mi |
| 3707 1/2 Marysville Blvd Sacramento, CA | 1.0 | 1.0 | 750 | $1,395 | $1.86 | 43d | 1 | 1.15mi |
| 3721 Balsam St Unit 4 Sacramento, CA | 1.0 | 1.0 | 450 | $1,300 | $2.89 | 1d | 1 | 1.19mi |
| 2408 Wulff Ln Unit 9 Sacramento, CA | 1.0 | 1.0 | 680 | $1,150 | $1.69 | 23d | 1 | 1.20mi |
| 2501 Edison Ave Unit 2501-34 Sacramento, CA | 1.0 | 1.0 | 525 | $1,300 | $2.48 | 23d | 1 | 1.24mi |
| 2633 Fulton Ave Sacramento, CA | 1.0 | 1.0 | 652 | $1,447 | $2.22 | 43d | 1 | 1.25mi |
| 2512 Edison Ave Sacramento, CA | 1.0–2.0 | 1.0 | 685 | $1,495 | $2.18 | 4d | 5 | 1.26mi |
| 1928 Ethan Way Unit 19 Sacramento, CA | 1.0 | 1.0 | 620 | $1,065 | $1.72 | 23d | 1 | 1.28mi |
| 2264 Cottage Way Sacramento, CA | 1.0–2.0 | 1.0–2.0 | 810 | $1,899 | $2.34 | 1d | 11 | 1.30mi |
| 1922 Ethan Way Sacramento, CA | 1.0 | 1.0 | 500 | $1,065 | $2.13 | 7d | 1 | 1.30mi |
| 2511 Edison Ave Unit 2511-26 D Sacramento, CA | 1.0 | 1.0 | 535 | $1,300 | $2.43 | 20d | 1 | 1.30mi |
| 2511 Edison Ave Unit 2511-52 D Sacramento, CA | 1.0 | 1.0 | 525 | $1,300 | $2.48 | 23d | 1 | 1.30mi |
| 1961 Howe Ave Sacramento, CA | 1.0 | 1.0 | 635 | $1,430 | $2.25 | 43d | 1 | 1.31mi |
| 2011 Wyda Way Sacramento, CA | 1.0 | 1.0 | 660 | $1,175 | $1.78 | 7d | 2 | 1.33mi |
| 2115 Wyda Way Sacramento, CA | 2.0 | 1.0 | 700 | $1,650 | $2.36 | 43d | 1 | 1.34mi |
| 2408 Empress St Unit 10 Sacramento, CA | 1.0 | 1.0 | 543 | $1,250 | $2.30 | 43d | 1 | 1.36mi |
Tax reassessment forecast CA · Resets to sale price
- Current annual tax
- $104 · $9/mo
- Projected year-2 tax
- $152 · $13/mo
- Expected delta
- +$48/yr (+$4/mo · 46.0%)
ⓘ Screening estimate from a state-policy table — verify with the county assessor before closing.
Climate risk First Street
- Flood 7/10 Severe FEMA zone X (unshaded) · 77% chance over 30 yrs
- Wildfire 1/10 Low
- Heat 7/10 Severe 7 d/yr ≥102°F today · 15 d/yr by 30 yrs out
- Wind 1/10 Low
- Air quality 10/10 Extreme 33 unhealthy d/yr today · 38 by 30 yrs out
Nearby sold comps map
Loading sold comps map…
Walkable amenities ~0.75 mi
Loading nearby amenities…
Taxation est. · year 1
- Rental income
- $18,178
- − Mortgage interest
- −$1,120
- − Property taxes
- −$104
- − Insurance
- −$897
- − Repairs & maintenance
- −$1,454
- − Management
- −$1,454
- − Depreciation
- −$582
- Taxable income
- $12,566
- Est. tax owed @ 24.0%
- −$3,016
- After-tax cash flow
- $9,085/yr
For passive investors: Depreciation is non-cash, so a rental often shows a tax loss while cash-flowing — sheltering income. Rental losses are passive: they offset passive income freely, and up to $25,000/yr can offset ordinary (W-2) income if you actively participate and your MAGI is under $100k (phasing out to $0 by $150k); unused losses carry forward. On sale, claimed depreciation is recaptured at up to 25%, and gains may owe capital-gains tax (a 1031 exchange can defer both). Figures are a year-1 estimate at your 24.0% rate — not tax advice; consult a CPA.
Schools (NCES district)
- District
- Twin Rivers Unified
- NCES district ID
- 0601332
- Math proficiency
- 29% ▲ 2.00%
- Reading proficiency
- 37% ▲ 2.00%
- Median HH income
- $42,481
- Composite
- 30.67/100
- National rank
- #11437
- State rank
- #970 of 1400 in CA
Livability — Sacramento
- Score
- 71/100
- State rank
- #218
- US rank
- #6957
Category grades
Schools grade is shown separately in the Schools card above.
Census & demographics
- Census place
- Sacramento, CA
- County
- Sacramento County · 1,539,646 people
- City population
- 761,410
- Metro
- Sacramento-Roseville-Folsom, CA
- Population (ZIP)
- 26,658
- Household income
- $60,097
- Rent vs Own
- Severe rent burden
- 1877.0
Population outlook (Sacramento County) Hauer SSP2
- Today (2025)
- 1,660,763 people
- By 2030
- 1,732,990 · +4.3%
- By 2040
- 1,855,755 · +11.7%
- By 2050
- 1,941,335 · +16.9%
- By 2075
- 2,046,162 · +23.2%
- By 2100
- 1,961,444 · +18.1%
Race, ethnicity, and origin ACS 2023
- Neighborhood character
- Highly diverse neighborhood (Simpson 0.72)
- Race & ethnicity
- Hispanic / Latino 42% White 28% Two or more races 14% Black 12% Asian 11% Native American 3%
- Hispanic origin (detail)
- Mexican 36%
- Common ancestry
- Russian 1% Italian 1% Romanian 1%
- Foreign-born
- 23% · Canada, China, Vietnam
- Languages at home
- 58% English-only · Spanish 28% Other Asian/Pacific 6% Other Indo-European 2%
Political lean MEDSL · Sacramento
- 2024 margin
- D (+19.7) · D 58.1% · R 38.4% · Other 3.5%
- 2008→2024 swing
- +0.7pp no change · 2008: 19.0pp · 2024: 19.7pp
- All cycles
- 2024: D+19.7 2020: D+25.3 2016: D+23.7 2012: D+16.3 2008: D+19.0
Not yet ingested
- Civics
- —
Market trends
- HPI YoY
- ▼ -213.04%
- Current HPI
- 449.1398
- Rent YoY
- ▲ 1.52%
- Metro
- Sacramento-Roseville-Folsom, CA
- State GDP YoY
- ▲ 3.21%
- F500 in state
- 116
Industry mix (Fortune 500 HQ in CA)
| Industry | F500 HQs | Revenue |
|---|---|---|
| Technology | 27 | $1,492B |
|
||
| Financial Services | 3 | $174B |
|
||
| Retail | 3 | $44B |
|
||
| Insurance | 3 | $26B |
|
||
| Media / Entertainment | 2 | $115B |
|
||
| Pharmaceuticals / Biotech | 2 | $62B |
|
||
Property tax history
+0.6%/yrLatest (2025): $104 · +3.3% YoY. Source: county tax records.
Cash-flow waterfall
monthlySold comps — $/sqft
last 12 mo · ≤1 miLoading sold comps…