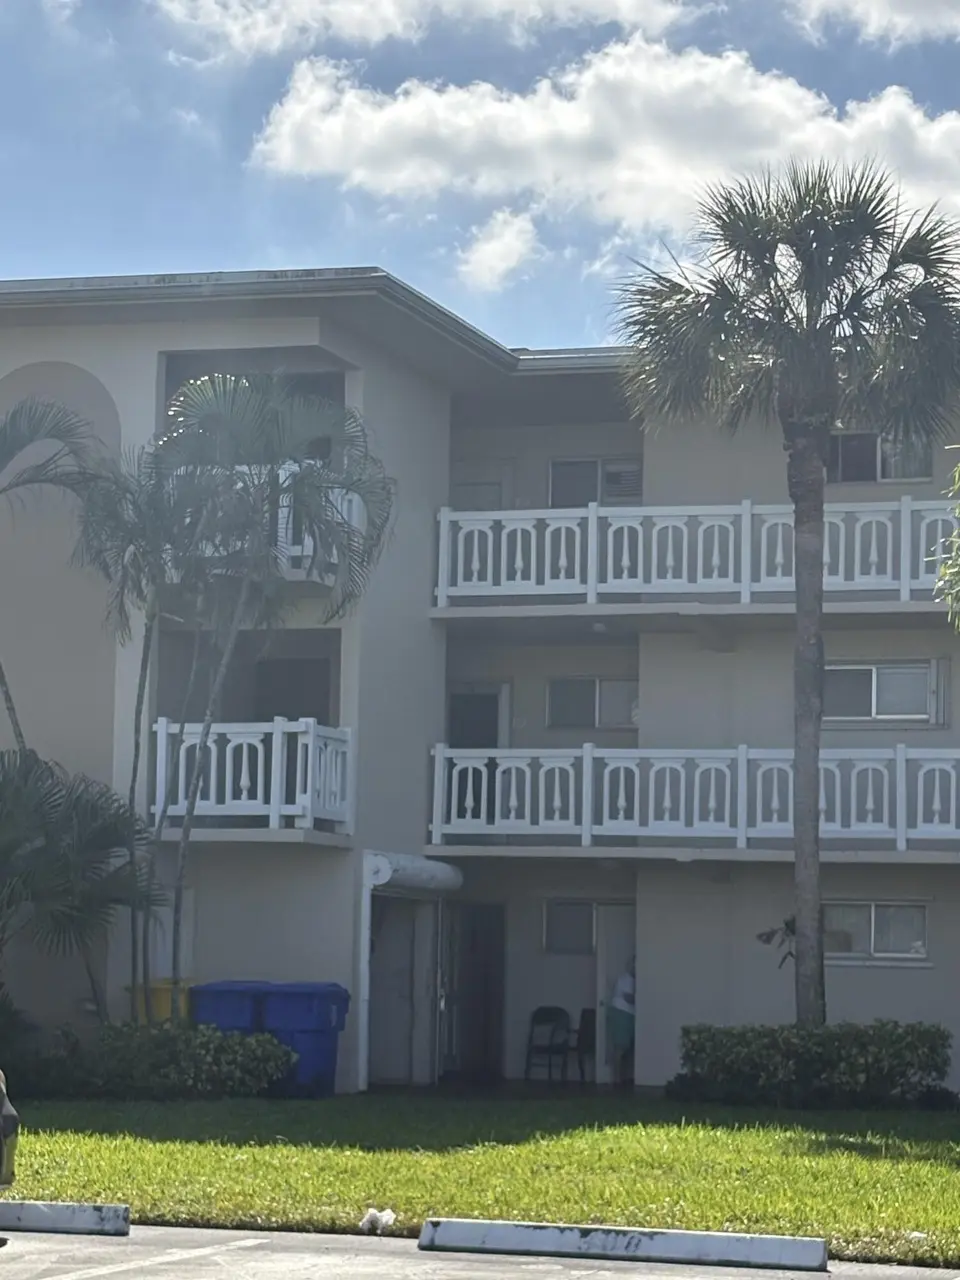
2606 Garden Dr S #107 · Palm Springs, FL
Flood risk 1/10 · Minimal
- FEMA flood zone
- X (unshaded)
- Chance of flooding over 30 yrs
- 0.0%
- Est. flood insurance / yr
- $507 – $1,088
Fire risk 1/10 · Minimal
- Est. fire insurance / yr
- $947 – $1,759
Heat risk 10/10 · Severe
- Hot days now (above 105°F)
- 7 days/yr
- Hot days in 30 yrs
- 26 days/yr
Wind risk 10/10 · Severe
- Chance of severe wind over 30 yrs
- 99.0%
Air-quality risk 2/10 · Minimal
- Unhealthy air days now
- 0 days/yr
- Unhealthy air days in 30 yrs
- 2 days/yr
Risk factors via First Street. Map © Google.
Why this score? — see what drove the D grade
The composite is a weighted blend of 9 inputs, each scored 0–100. Each bar is that input's sub-score; the figure is the points it added to the 100-point composite (weight × sub-score).
- Cash flow +15.0/30.0
- ARV discount +7.5/15.0
- 1% rule +5.0/10.0
- DSCR +5.0/10.0
- Schools +4.3/10.0
- Livability +3.7/5.0
- Condition / age +2.5/5.0
- Rent growth +1.9/5.0
- Appreciation +0.0/10.0
$30,000
🖨 Deal sheet 📄 Offer letter ✓ Due diligence
Listing remarks
1-bedroom, 1-bathroom condo in a 55+ community. It needs a little work but offers a solid layout and excellent opportunity for customization in a desirable community, and easy access to I-95.
Key facts
- $540 HOA
- Parking
- Community pool
Property features AI
Finance
- Financial info: Part of a large community with 856 units; Pets not allowed
- HOA & community: Community association (Lake Clarke Gardens Condo, Inc.); Monthly association fee; Association amenities include clubhouse and pool; HOA fee covers insurance, grounds maintenance, sewer, trash, water, common areas, elevator, and recreation facility
Exterior
- Parking: Assigned, deeded open parking; 10 open parking spaces; Total of 1 parking space listed
- Security: Security patrol
- Utilities: Public water; Public sewer; Circuit breaker electrical; Cable available; Underground utilities; Water available; Sewer available
- Home design: Condominium; One-level unit; Faces north; Resale
- Construction: CBS construction; Tar/gravel roof; 3-story building
- Exterior features: Screened patio and screened porch; Patio; Porch; Landscaped grounds; Not waterfront
Interior
- Kitchen: Refrigerator
- Bedrooms: 1 bedroom on the main level
- Flooring: Carpet; Ceramic tile
- Bathrooms: 1 full bathroom on the main level
- Heating & cooling: Central heating; Central air conditioning
- Interior features: Walk-in closets; Dome kitchen; Unfurnished
- Laundry & utility: Electric water heater; Laundry: Other
Neighborhood map
What this means for you Summary
Snapshot
- This is a 1-bed/1.0-bath condo listed at $30k.
Deal economics
- At list price, monthly cash flow is $546 ($7k/yr) — positive.
- The deal already cash-flows at list — no discount required.
- Meets the 1% rule at list price ($2k rent vs $30k).
- Recommended offer: $29k (3.0% below list) — sets the bar for market timing.
Location & tenants
- Location reads 73/100 on livability (#297 in FL) — a middle-class / working-renter tenant base. Strengths: cost of living A+, housing A+, health & safety A; Watch: employment D+, amenities F, commute F.
- Palm Beach (suburban): math 46% / reading 53% proficiency, ranked #34 of 73 in FL (top 47%) — families likely to look elsewhere, expect single-tenant / working-renter base with shorter leases.
- Zoned schools: Meadow Park Elementary School (math 64% / reading 73%, grade B+, #409 of 2,144 statewide, top 20%, 809 students, 65% FRL); Forest Hill Community High School (math 20% / reading 41%, grade F, #434 of 667 statewide, top 66%, 2,407 students, 66% FRL).
- Market conditions: Rents soft (-2.5%/yr); 274 active listings in the ZIP; 28 comparable units currently listed for rent nearby; rentals at typical pace (median 25d on market — plan ~3-4 weeks tenant-placement turnaround); 3,974 units permitted in Palm Beach County in 2024 (1,012 in 5+ unit buildings).
- This rent runs 31% of the median local income ($62k/yr) — at the standard rent-burdened threshold; future hikes will face affordability resistance.
Forward outlook
- Local home prices are declining (-3.0%/yr); year-one equity from $207 of loan paydown is wiped out by about $900 of value loss. Plan a longer hold.
- Palm Beach County population projected at +30% by 2050 — long-run rental-demand tailwind backs the buy-and-hold thesis.
- At projected returns (-3.0% appreciation + 0.0% rent growth), your $8k cash investment doubles in ~2 years — after that, you're playing with house money.
Negotiation context
- It's been on market 55 days — a 3% lower offer ($29k) is reasonable based on typical stale-listing flexibility.
- 6 sale attempts since 29y ago; this cycle's ask has dropped $20k (40%) from the opening price — seller is motivated, your offer sets the floor, not the list.
Risks & watch-outs
- Watch-outs: HOA is 33% of rent.
- Climate carrying-cost: severe wind risk, 99% chance of damaging wind over 30y; extreme-heat days projected 7→26/yr by 2055 (HVAC capex compounding) — expect insurance premiums to compound above CPI over the hold.
Questions for the listing agent
- It's been on market 55 days. Have you received any prior offers? Is the seller open to a 3% concession, seller financing, or rate buy-down credit?
- Built in 1969 — when were the roof, HVAC, electrical panel, plumbing, and water heater last replaced?
- What does the HOA fee cover, when was the last increase, and are there any pending special assessments or reserve-fund shortfalls?
- Any open or pending special assessments — roof, HVAC, plumbing, elevator, façade? What's the per-unit balance and payoff schedule, and is the seller paying it off at close or rolling it to the buyer?
- Is there a deadline driving the sale (1031 exchange, divorce, estate, relocation)? That informs how much negotiation room exists.
- Schools are D-rated, which usually means shorter tenancies and higher turnover. Who's the typical renter profile here, and what's been the actual vacancy rate?
- The area grade is low — what's the realistic commute time and amenity access for the typical tenant pool here? Any planned neighborhood developments (good or bad) we should know about?
- What's the average days-on-market for RENTAL listings here right now (not sales)? A rising rental-DOM trend means longer vacancies and softer asking-rent achievability than the comps imply.
- What's the recent tenant-quality profile in this submarket — average credit score on applications, eviction rate, late-payment / NSF rate, and stable-employment percentage? A property-management company in the area should have these aggregated.
- How much new apartment / multifamily construction is in the pipeline within 1–3 miles? Heavy new supply (>2% of stock underway) typically softens rents 12–24 months out; light construction supports rent growth.
Investment metrics
- 1% rule
- 5.40% ✓
- Cap rate
- 28.13%
- Cash-on-cash
- 78.00%
- DSCR
- 4.47
- GRM
- 1.5
CMA / ARV
No comps found within radius.
Projected returns pro-forma
-3.0% appreciation · 0.0% rent growth · sell at horizon
- IRR
- 72.5%
- Equity multiple
- 4.04×
- Total profit
- $25,511
- Equity at exit
- $4,473
- IRR
- 75.0%
- Equity multiple
- 6.96×
- Total profit
- $50,050
- Equity at exit
- $2,594
Cash invested: $8,400 (down + closing). Projections, not guarantees.
Landlord ↔ Tenant lean methodology
- Overall (STATE)
- 87 Strongly Landlord-Friendly
- State Florida
- 87 Strongly Landlord-Friendly · R+3
- County
- — inherits STATE
- City
- — inherits STATE
ZIP-level market 33461
- Rents YoY
- -2.5%
- Active inventory
- 274
- Price-to-rent
- 1.5×
Monthly cashflow live
- Estimated rent
- $1,621 high interval (Pro) →
- Mortgage (P&I)
- −$157
- Tax from tax record
- −$25 /mo · $296/yr
- Insurance
- −$12
- HOA
- −$540
- Vacancy / Maint / Mgmt
- −$340
- Net cashflow
- $546
Break-even live
UW: 25.0% down · 7.5% · 30yr · 1.5% tax · 5.0% vac · 8.0% maint · 8.0% mgmt
Financing live
Cash to close
- Down payment
- $7,500
- Closing costs
- $900
- Reserves months
- —
- Total cash needed
- —
Loan-product check · same deal, 3 products live
Conventional
25% down · 7.5% · 30yr
- Down + closing
- —
- Monthly P&I
- —
- Monthly cashflow
- —
- DSCR
- —
- Eligible?
- —
Personal DTI + credit; lowest rate.
DSCR
20% down · 8.5% · 30yr
- Down + closing
- —
- Monthly P&I
- —
- Monthly cashflow
- —
- DSCR
- —
- Eligible?
- —
No personal income docs; deal must DSCR.
Hard money
10% down · 12.0% · 12mo
- Down + closing
- —
- Monthly P&I
- —
- Monthly cashflow
- —
- DSCR
- —
- Eligible?
- —
Short-term bridge; refi at stabilization.
Rent comps 28 comps
| Address | Beds | Baths | Sqft | Rent | $/sqft | DOM | Units | Dist |
|---|---|---|---|---|---|---|---|---|
| 2566 Garden Dr S Lake Worth Beach, FL | 1.0 | 1.0 | 744 | $1,395 | $1.88 | 24d | 1 | 0.05mi |
| 3260 Hi St Unit B Lake Worth Beach, FL | 1.0 | 1.0 | 400 | $1,700 | $4.25 | 24d | 1 | 0.35mi |
| 3300 Boutwell Rd Lake Worth Beach, FL | 1.0–2.0 | 1.0–2.0 | 765 | $1,870 | $2.44 | 24d | 1 | 0.51mi |
| 3017 Buckley Ave Lake Worth, FL | 2.0 | 1.0 | 720 | $2,200 | $3.06 | 24d | 1 | 0.63mi |
| 965 Manor Dr Palm Springs, FL | 2.0 | 1.0 | 687 | $1,722 | $2.51 | 1d | 5 | 0.70mi |
| 1765 16th Ct N Lake Worth Beach, FL | — | 1.0 | 450 | $1,700 | $3.78 | 24d | 1 | 0.94mi |
| 2571 Lake Worth Rd Lake Worth, FL | 1.0–2.0 | 1.0–2.0 | 750 | $1,378 | $1.84 | 2d | 2 | 0.95mi |
| 1755 Forest Hill Blvd Lake Clarke Shores, FL | 1.0 | 1.0 | 662 | $1,595 | $2.41 | 8d | 1 | 0.99mi |
| 2220 Lake Worth Rd Lake Worth, FL | 1.0 | 1.0 | 700 | $1,779 | $2.54 | 22d | 1 | 1.04mi |
| 2085 S Congress Ave Palm Springs, FL | 1.0–3.0 | 1.0–2.0 | 963 | $2,055 | $2.13 | 2d | 14 | 1.08mi |
| 246 Cypress Ln Lake Worth Beach, FL | 1.0–2.0 | 1.0 | 850 | $1,550 | $1.82 | 24d | 2 | 1.08mi |
| 240 Alemeda Dr Palm Springs, FL | 1.0–2.0 | 1.0–2.0 | 825 | $1,650 | $2.00 | 24d | 3 | 1.10mi |
| 200 Bonnie Blvd #132 Palm Springs, FL | 1.0 | 1.0 | 577 | $1,500 | $2.60 | 22d | 1 | 1.14mi |
| 3654 Coconut Rd Palm Springs, FL | 1.0 | 1.0 | 600 | $1,500 | $2.50 | 24d | 1 | 1.18mi |
| 300 Bonnie Blvd #144 Palm Springs, FL | 1.0 | 1.0 | 702 | $1,350 | $1.92 | 24d | 1 | 1.19mi |
| 3901 Lakewood Rd Unit A Lake Worth Beach, FL | 2.0 | 1.0 | 704 | $2,000 | $2.84 | 24d | 1 | 1.25mi |
| 1201 N E St Unit 2 Lake Worth Beach, FL | 1.0 | 1.0 | 600 | $1,500 | $2.50 | 24d | 1 | 1.30mi |
| 123 Erie St Apt 10 Lake Worth, FL | 1.0 | 1.0 | 600 | $1,325 | $2.21 | 24d | 1 | 1.32mi |
| 136 Akron St Apt B2 Lake Worth Beach, FL | 1.0 | 1.0 | 599 | $2,175 | $3.63 | 24d | 1 | 1.33mi |
| 136 Akron St Unit A1 Lake Worth Beach, FL | 1.0 | 1.0 | 599 | $2,075 | $3.46 | 24d | 1 | 1.33mi |
| 436 Fontana Dr Lake Worth, FL | 1.0 | 1.0 | 550 | $1,375 | $2.50 | 22d | 1 | 1.35mi |
| 436 Fontana Dr Lake Worth, FL | 1.0 | 1.0 | 550 | $1,450 | $2.64 | 24d | 1 | 1.35mi |
| 3874 7th Ave N Unit 3878 Lake Worth Beach, FL | 1.0 | 1.0 | 528 | $1,600 | $3.03 | 24d | 1 | 1.38mi |
| 3890 Lakewood Rd #1 Lake Worth, FL | 1.0 | 1.0 | 433 | $1,500 | $3.46 | 11d | 1 | 1.46mi |
| 417 N E St Unit 39 Lake Worth Beach, FL | 1.0 | 1.0 | 700 | $1,550 | $2.21 | 24d | 1 | 1.48mi |
| 417 N E St Unit 36 Lake Worth Beach, FL | 1.0 | 1.0 | 650 | $1,550 | $2.38 | 12d | 1 | 1.48mi |
| 413 N E St Lake Worth Beach, FL | 2.0 | 1.0 | 646 | $2,000 | $3.10 | 24d | 1 | 1.49mi |
| 3901 Gulfstream Rd Unit 2 B Lake Worth Beach, FL | 1.0 | 1.0 | 450 | $1,700 | $3.78 | 21d | 1 | 1.49mi |
HOA detail condo
- Monthly dues
- $540 · $6,480/yr
- Assessments
- None detected in remarks — confirm with the listing agent.
Listing history 30 events
-
2026-06-18days on market $30,000 Active 55 DOM
-
2026-06-17days on market $30,000 Active 54 DOM
-
2026-06-16days on market $30,000 Active 53 DOM
-
2026-06-15days on market $30,000 Active 52 DOM
-
2026-06-13days on market $30,000 Active 50 DOM
-
2026-06-10price $30,000 Active 46 DOM
-
2026-06-09days on market $40,000 Active 46 DOM
-
2026-06-08days on market $40,000 Active 45 DOM
-
2026-06-07days on market $40,000 Active 44 DOM
-
2026-06-04days on market $40,000 Active 41 DOM
-
2026-06-03days on market $40,000 Active 40 DOM
-
2026-06-02days on market $40,000 Active 39 DOM
-
2026-06-01days on market $40,000 Active 38 DOM
-
2026-05-31days on market $40,000 Active 37 DOM
-
2026-05-13price $40,000
-
2026-04-24historical
-
2026-04-21$49,900 Active
-
2026-04-09$49,900 Active
-
2019-06-18historical
-
2019-05-07$55,000 Active
-
2000-10-19soldstatus $30,000
-
2000-10-02soldstatus $30,000
-
2000-08-27historical
-
2000-08-23$32,000
-
1999-06-15soldstatus $24,000
-
1999-06-10soldstatus $24,500
-
1999-05-11$27,000
-
1998-04-28historical
-
1997-12-18$29,000
-
1995-03-10soldstatus $28,000
ⓘ Source: listings_history table (triggers on properties + properties_extension) + one-shot
backfill from property_details.listing_events for pre-trigger history.
Tax reassessment forecast FL · Resets to sale price
- Current annual tax
- $296 · $25/mo
- Projected year-2 tax
- $296 · $25/mo
- Expected delta
- $0/yr ($0/mo · 0.0%)
ⓘ Screening estimate from a state-policy table — verify with the county assessor before closing.
Climate risk First Street
- Flood 1/10 Low FEMA zone X (unshaded) · 0% chance over 30 yrs
- Wildfire 1/10 Low
- Heat 10/10 Extreme 7 d/yr ≥105°F today · 26 d/yr by 30 yrs out
- Wind 10/10 Extreme 99% chance of damaging wind over 30 yrs
- Air quality 2/10 Low 0 unhealthy d/yr today · 2 by 30 yrs out
Nearby sold comps map
Loading sold comps map…
Walkable amenities ~0.75 mi
Loading nearby amenities…
Taxation est. · year 1
- Rental income
- $19,449
- − Mortgage interest
- −$1,680
- − Property taxes
- −$296
- − Insurance
- −$150
- − Repairs & maintenance
- −$1,556
- − Management
- −$1,556
- − HOA
- −$6,480
- − Depreciation
- −$873
- Taxable income
- $6,859
- Est. tax owed @ 24.0%
- −$1,646
- After-tax cash flow
- $4,906/yr
For passive investors: Depreciation is non-cash, so a rental often shows a tax loss while cash-flowing — sheltering income. Rental losses are passive: they offset passive income freely, and up to $25,000/yr can offset ordinary (W-2) income if you actively participate and your MAGI is under $100k (phasing out to $0 by $150k); unused losses carry forward. On sale, claimed depreciation is recaptured at up to 25%, and gains may owe capital-gains tax (a 1031 exchange can defer both). Figures are a year-1 estimate at your 24.0% rate — not tax advice; consult a CPA.
Schools (NCES district)
- District
- Palm Beach
- NCES district ID
- 1201500
- Math proficiency
- 46% ▼ -16.00%
- Reading proficiency
- 53% ▼ -4.00%
- Median HH income
- $53,943
- Composite
- 42.72/100
- National rank
- #3160
- State rank
- #34 of 73 in FL
Livability — Palm Springs
- Score
- 73/100
- State rank
- #297
- US rank
- #5045
Category grades
Schools grade is shown separately in the Schools card above.
Census & demographics
- County
- Palm Beach County · 1,438,312 people
- City population
- 49,443
- Metro
- Miami-Fort Lauderdale-Pompano Beach, FL
- Population (ZIP)
- 49,443
- Household income
- $61,963
- Rent vs Own
- Severe rent burden
- 2663.0
Population outlook (Palm Beach County) Hauer SSP2
- Today (2025)
- 1,637,487 people
- By 2030
- 1,743,255 · +6.5%
- By 2040
- 1,948,712 · +19.0%
- By 2050
- 2,132,979 · +30.3%
- By 2075
- 2,530,027 · +54.5%
- By 2100
- 2,706,979 · +65.3%
Race, ethnicity, and origin ACS 2023
- Neighborhood character
- Diverse neighborhood (Simpson 0.59)
- Race & ethnicity
- Hispanic / Latino 59% Two or more races 26% White 20% Black 17% Asian 2%
- Hispanic origin (detail)
- Mexican 11% Puerto Rican 6% Cuban 16% Dominican 2%
- Common ancestry
- Hispanic 9% Romanian 1% Lithuanian 1%
- Foreign-born
- 52% · Canada, Jamaica
- Languages at home
- 31% English-only · Spanish 54% French/Haitian/Cajun 10% Other Indo-European 2%
Political lean MEDSL · Palm Beach
- 2024 margin
- Toss-up / Even · D 50.0% · R 49.2%
- 2008→2024 swing
- -22.1pp toward R · 2008: 22.9pp · 2024: 0.8pp
- All cycles
- 2024: D+0.8 2020: D+12.8 2016: D+15.3 2012: D+17.0 2008: D+22.9
Not yet ingested
- Civics
- —
Market trends
- HPI YoY
- ▼ -269.03%
- Current HPI
- 493.0041
- Rent YoY
- ▼ -2.47%
- Metro
- Miami-Fort Lauderdale-Pompano Beach, FL
- State GDP YoY
- ▲ 3.28%
- F500 in state
- 36
Industry mix (Fortune 500 HQ in FL)
| Industry | F500 HQs | Revenue |
|---|---|---|
| Industrial Technology | 2 | $29B |
|
||
| Insurance | 2 | $17B |
|
||
| Retail | 1 | $60B |
|
||
| Technology Distribution | 1 | $58B |
|
||
| Homebuilding | 1 | $35B |
|
||
| Technology Manufacturing | 1 | $35B |
|
||
Price history
+42.9% since first listed16 events — show timeline
- 2026-05-13 Price Changed $40,000 Beaches MLS
- 2026-04-24 Listing Removed — Beaches MLS
- 2026-04-21 Listed $49,900 Beaches MLS
- 2026-04-09 Listed $49,900 Beaches MLS
- 2019-06-18 Listing Removed — Beaches MLS
- 2019-05-07 Listed $55,000 Beaches MLS
- 2000-10-19 Sold (Public Records) $30,000 Public Records
- 2000-10-02 Sold (MLS) $30,000 Beaches MLS
- 2000-08-27 Listing Removed — Beaches MLS
- 2000-08-23 Listed $32,000 Beaches MLS
- 1999-06-15 Sold (Public Records) $24,000 Public Records
- 1999-06-10 Sold (MLS) $24,500 Beaches MLS
- 1999-05-11 Listed $27,000 Beaches MLS
- 1998-04-28 Listing Removed — Beaches MLS
- 1997-12-18 Listed $29,000 Beaches MLS
- 1995-03-10 Sold (Public Records) $28,000 Public Records
Property tax history
+2.8%/yrLatest (2025): $296 · +3.1% YoY. Source: county tax records.
Cash-flow waterfall
monthlySold comps — $/sqft
last 12 mo · ≤1 miLoading sold comps…