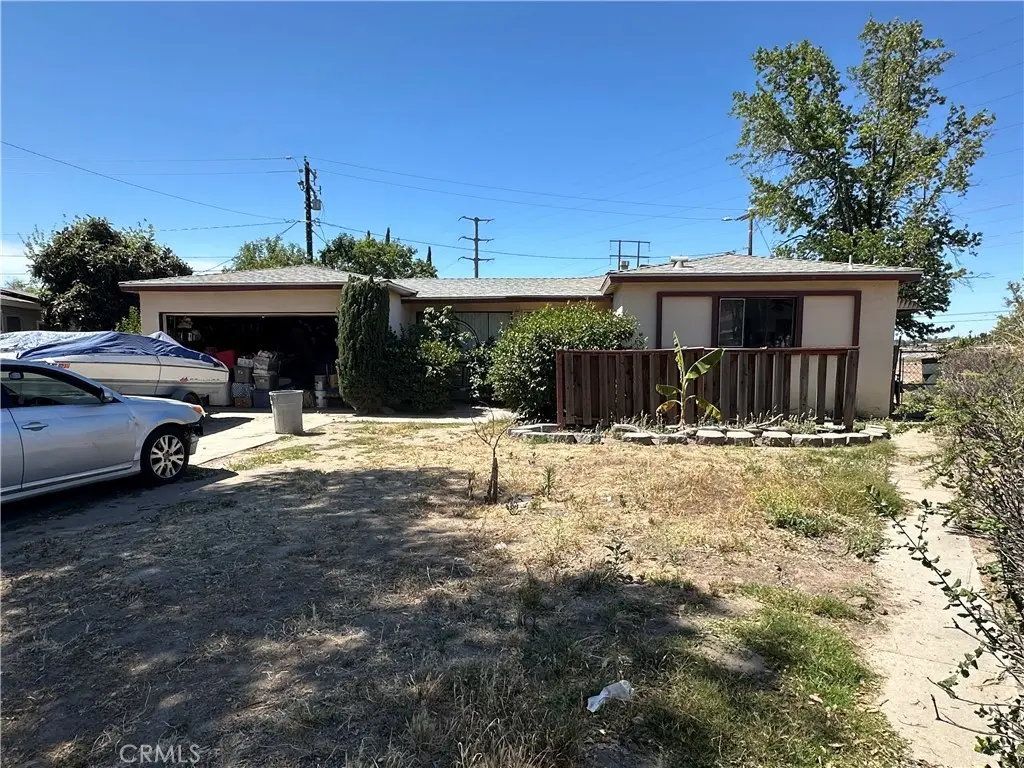
1875 Vine · San Bernardino, CA
Flood risk 1/10 · Minimal
- FEMA flood zone
- X (unshaded)
- Chance of flooding over 30 yrs
- 0.0%
- Est. flood insurance / yr
- $507 – $1,088
Fire risk 2/10 · Minimal
- Est. fire insurance / yr
- $659 – $1,223
Heat risk 8/10 · Major
- Hot days now (above 102°F)
- 7 days/yr
- Hot days in 30 yrs
- 21 days/yr
Wind risk 1/10 · Minimal
- Chance of severe wind over 30 yrs
- —
Air-quality risk 10/10 · Severe
- Unhealthy air days now
- 25 days/yr
- Unhealthy air days in 30 yrs
- 31 days/yr
Risk factors via First Street. Map © Google.
Why this score? — see what drove the C+ grade
The composite is a weighted blend of 9 inputs, each scored 0–100. Each bar is that input's sub-score; the figure is the points it added to the 100-point composite (weight × sub-score).
- Cash flow +18.9/30.0
- ARV discount +15.0/15.0
- Appreciation +10.0/10.0
- DSCR +6.0/10.0
- 1% rule +3.7/10.0
- Schools +3.1/10.0
- Livability +3.0/5.0
- Rent growth +2.5/5.0
- Condition / age +2.5/5.0
$350,000
🖨 Deal sheet 📄 Offer letter ✓ Due diligence
Listing remarks
3 Bedroom, 2 Bath Home with Bonus Room – Investor Opportunity! This 3-bedroom, 2-bath home with a bonus room sits on a spacious 9,500 sq. ft. lot in a well-established neighborhood. Conveniently located close to schools and shopping centers, this property offers great potential for investors looking to add to their portfolio. All cash sale – sold AS-IS. No repairs will be made by the seller. Don’t miss this opportunity to unlock the potential of this property! ONLY SHOWINGS ON SAT MAY 30,2026 From 12-2 pm
Key facts
- 9,500 sq ft lot
- 2 garage spots
- Built 1954
Property features AI
Finance
- Other: Property has one total unit
- HOA & community: Curbs and sidewalks in the neighborhood
Exterior
- Parking: Attached garage with space for 2 vehicles; Total parking for 2 vehicles
- Utilities: Public sewer; District/public water
- Home design: Single-story; No shared/common walls; No ADU on property
- Construction: Year built per public records
- Exterior features: House (single-family structure); No pool
Interior
- Bedrooms: Bedroom(s) located on the main level
- Bathrooms: Two full bathrooms
- Heating & cooling: Central heating (furnace); Central cooling
- Interior features: One-level home; All bedrooms on the main floor; Main level has one bedroom and one full bathroom
- Laundry & utility: Laundry area in the garage
Neighborhood map
What this means for you Summary
Snapshot
- This is a 3-bed/2.0-bath single-family listed at $350k.
Deal economics
- At list price, monthly cash flow is $362 ($4k/yr) — positive.
- The deal already cash-flows at list — no discount required.
- To meet the 1% rule (rent ≥ 1% of price), the offer needs to be $304k (13.1% below list).
- Recommended offer: $304k (13.1% below list) — sets the bar for 1% rule.
- Cap rate 7.5% vs local median 3.5% in San Bernardino — top-decile yield for the area; either an underpriced asset or a hidden risk that comps aren't pricing in. Stress-test before assuming the spread holds.
Location & tenants
- Location reads 59/100 on livability (#661 in CA) — a working-class tenant base; expect higher turnover. Strengths: commute A+, housing A; Watch: schools D, employment D, crime F.
- San Bernardino City Unified (urban): math 27% / reading 40% proficiency, ranked #959 of 1,400 in CA (top 68%) — families likely to look elsewhere, expect single-tenant / working-renter base with shorter leases; 81% free/reduced lunch — lower-income household profile, screen leases tightly.
- Market conditions: 40 active listings in the ZIP; 10 comparable units currently listed for rent nearby; rentals at typical pace (median 25d on market — plan ~3-4 weeks tenant-placement turnaround); 5,458 units permitted in San Bernardino County in 2024 (1,500 in 5+ unit buildings).
- At $3,041/mo this rent would consume 67% of the median local household income ($54k/yr) (locally 956% of renters already pay >50% of income on rent) — very limited rent-growth headroom before tenants either downsize or default.
Forward outlook
- In year one you build about $37k of equity ($2k loan paydown + $35k appreciation (10.0% local appreciation)).
- San Bernardino County population projected at +15% by 2050 — modest demand growth; plan on rents tracking national, not racing it.
- At projected returns (10.0% appreciation + 3.0% rent growth), your $98k cash investment doubles in ~3 years — after that, you're playing with house money.
- By year 2, paydown + projected appreciation supports a ~$60k cash-out refi (75% LTV) — recoverable capital for the next deal without selling this one.
Negotiation context
- It's been on market 29 days — a 2% lower offer ($345k) is reasonable based on typical stale-listing flexibility.
Risks & watch-outs
- Watch-outs: built in 1954 — expect roof / HVAC / electrical / plumbing capex.
- Climate carrying-cost: extreme-heat days projected 7→21/yr by 2055 (HVAC capex compounding) — expect insurance premiums to compound above CPI over the hold.
Questions for the listing agent
- Built in 1954 — when were the roof, HVAC, electrical panel, plumbing, and water heater last replaced?
- Is there a deadline driving the sale (1031 exchange, divorce, estate, relocation)? That informs how much negotiation room exists.
- Schools are D-rated, which usually means shorter tenancies and higher turnover. Who's the typical renter profile here, and what's been the actual vacancy rate?
- Crime grade is F in this area — have there been break-ins, vandalism, or insurance claims at this property in the last 3 years? What carrier currently insures it and at what premium?
- What's the average days-on-market for RENTAL listings here right now (not sales)? A rising rental-DOM trend means longer vacancies and softer asking-rent achievability than the comps imply.
- What's the recent tenant-quality profile in this submarket — average credit score on applications, eviction rate, late-payment / NSF rate, and stable-employment percentage? A property-management company in the area should have these aggregated.
- How much new for-sale + rental construction is in the pipeline within 1–3 miles? Heavy new supply typically softens prices + rents 12–24 months out; constrained supply supports both.
Investment metrics
- 1% rule
- 0.87% ✗
- Cap rate
- 7.53%
- Cash-on-cash
- 4.43%
- DSCR
- 1.20
- GRM
- 9.6
CMA / ARV
- ARV (on-the-fly)
- $517,440
- Comps found
- 10
Show comp detail 10 sales within ~0.75 mi
| Address | Dist | Beds/Ba | Sqft | Sold | Price | $/sf | Match |
|---|---|---|---|---|---|---|---|
| 1804 W 7th | 0.09mi | 3/2.0 | 1,499 (-4%) | 4mo | $495,000 | $330 | 85 |
| 1464 N W 6th St Dr | 0.63mi | 4/2.0 (+1) | 1,607 (+2%) | 6mo | $510,000 | $317 | 56 |
| 2279 W 7th St | 0.68mi | 3/2.0 | 1,644 (+5%) | 6mo | $518,900 | $316 | 55 |
| 1654 W 8th St | 0.32mi | 4/2.0 (+1) | 1,420 (-9%) | 14mo | $399,000 | $281 | 53 |
| 2286 Kyla Ct | 0.66mi | 4/2.0 (+1) | 1,653 (+5%) | 7mo | $560,000 | $339 | 49 |
| 804 Terrace | 0.73mi | 3/2.0 | 1,377 (-12%) | 5mo | $580,000 | $421 | 42 |
| 1077 Ramona Ave | 0.62mi | 4/2.0 (+1) | 1,609 (+3%) | 24mo | $560,000 | $348 | 42 |
| 1384 W 8th St | 0.73mi | 3/2.0 | 1,647 (+5%) | 21mo | $490,000 | $298 | 40 |
| 1474 W 9th St | 0.64mi | 3/1.0 | 1,358 (-13%) | 14mo | $431,000 | $317 | 32 |
| 1364 Vine St | 0.74mi | 3/1.0 | 1,352 (-14%) | 11mo | $454,000 | $336 | 30 |
Match score weights: distance 35% · size 25% · config 20% · recency 20%. Top-matched comps best support the ARV.
Projected returns pro-forma
10.0% appreciation · 3.0% rent growth · sell at horizon
- IRR
- 27.5%
- Equity multiple
- 3.18×
- Total profit
- $213,474
- Equity at exit
- $315,308
- IRR
- 24.0%
- Equity multiple
- 7.23×
- Total profit
- $610,156
- Equity at exit
- $679,973
Cash invested: $98,000 (down + closing). Projections, not guarantees.
Landlord ↔ Tenant lean methodology
- Overall (STATE)
- 18 Strongly Tenant-Friendly
- State California
- 18 Strongly Tenant-Friendly · D+13
- County
- — inherits STATE
- City
- — inherits STATE
ZIP-level market 92411
- Home prices YoY
- 3.9%
- Active inventory
- 40
- Price-to-rent
- 9.6×
Monthly cashflow live
- Estimated rent
- $3,041 high interval (Pro) →
- Mortgage (P&I)
- −$1,835
- Tax from tax record
- −$59 /mo · $714/yr
- Insurance
- −$146
- HOA
- −$0
- Vacancy / Maint / Mgmt
- −$639
- Net cashflow
- $362
Break-even live
UW: 25.0% down · 7.5% · 30yr · 1.5% tax · 5.0% vac · 8.0% maint · 8.0% mgmt
Financing live
Cash to close
- Down payment
- $87,500
- Closing costs
- $10,500
- Reserves months
- —
- Total cash needed
- —
Loan-product check · same deal, 3 products live
Conventional
25% down · 7.5% · 30yr
- Down + closing
- —
- Monthly P&I
- —
- Monthly cashflow
- —
- DSCR
- —
- Eligible?
- —
Personal DTI + credit; lowest rate.
DSCR
20% down · 8.5% · 30yr
- Down + closing
- —
- Monthly P&I
- —
- Monthly cashflow
- —
- DSCR
- —
- Eligible?
- —
No personal income docs; deal must DSCR.
Hard money
10% down · 12.0% · 12mo
- Down + closing
- —
- Monthly P&I
- —
- Monthly cashflow
- —
- DSCR
- —
- Eligible?
- —
Short-term bridge; refi at stabilization.
Rent comps 10 comps
| Address | Beds | Baths | Sqft | Rent | $/sqft | DOM | Units | Dist |
|---|---|---|---|---|---|---|---|---|
| 1432 W 9th St San Bernardino, CA | 3.0 | 1.0 | 1225 | $2,700 | $2.20 | 44d | 1 | 0.67mi |
| 1855 W 13th St San Bernardino, CA | 4.0 | 2.0 | 1480 | $3,100 | $2.09 | 24d | 1 | 0.68mi |
| 1121 W Base Line St San Bernardino, CA | 2.0 | 1.0 | 1100 | $2,000 | $1.82 | 44d | 1 | 1.23mi |
| 2714 9th St Rialto, CA | 4.0 | 2.0 | 1480 | $2,995 | $2.02 | 24d | 1 | 1.23mi |
| 2616 W 2nd St San Bernardino, CA | 3.0 | 2.5 | 1560 | $3,275 | $2.10 | 2d | 1 | 1.34mi |
| 176 N Sutter Ave San Bernardino, CA | 3.0 | 2.5 | 1560 | $3,300 | $2.12 | 2d | 1 | 1.36mi |
| 114 N Lassen Ave San Bernardino, CA | 3.0 | 2.5 | 1561 | $3,225 | $2.07 | 10d | 1 | 1.37mi |
| 1356 W Trenton St Unit A San Bernardino, CA | 3.0 | 1.0 | 1300 | $2,500 | $1.92 | 18d | 1 | 1.38mi |
| 144 N Sutter Ave San Bernardino, CA | 4.0 | 3.0 | 1861 | $3,500 | $1.88 | 44d | 1 | 1.38mi |
| 1360 Poplar St San Bernardino, CA | 3.0 | 2.0 | 1250 | $2,495 | $2.00 | 18d | 1 | 1.43mi |
Listing history 14 events
-
2026-06-18days on market $350,000 Active 29 DOM
-
2026-06-17days on market $350,000 Active 28 DOM
-
2026-06-16days on market $350,000 Active 27 DOM
-
2026-06-15days on market $350,000 Active 26 DOM
-
2026-06-13days on market $350,000 Active 24 DOM
-
2026-06-09days on market $350,000 Active 20 DOM
-
2026-06-08days on market $350,000 Active 19 DOM
-
2026-06-07days on market $350,000 Active 18 DOM
-
2026-06-04days on market $350,000 Active 15 DOM
-
2026-06-03days on market $350,000 Active 14 DOM
-
2026-06-02days on market $350,000 Active 13 DOM
-
2026-06-01days on market $350,000 Active 12 DOM
-
2026-05-31days on market $350,000 Active 11 DOM
-
2026-05-20$350,000 Active
ⓘ Source: listings_history table (triggers on properties + properties_extension) + one-shot
backfill from property_details.listing_events for pre-trigger history.
Tax reassessment forecast CA · Resets to sale price
- Current annual tax
- $714 · $59/mo
- Projected year-2 tax
- $2,660 · $222/mo
- Expected delta
- +$1,946/yr (+$162/mo · 272.7%)
ⓘ Screening estimate from a state-policy table — verify with the county assessor before closing.
Climate risk First Street
- Flood 1/10 Low FEMA zone X (unshaded) · 0% chance over 30 yrs
- Wildfire 2/10 Low
- Heat 8/10 Severe 7 d/yr ≥102°F today · 21 d/yr by 30 yrs out
- Wind 1/10 Low
- Air quality 10/10 Extreme 25 unhealthy d/yr today · 31 by 30 yrs out
Nearby sold comps map
Loading sold comps map…
Walkable amenities ~0.75 mi
Loading nearby amenities…
Taxation est. · year 1
- Rental income
- $36,494
- − Mortgage interest
- −$19,605
- − Property taxes
- −$714
- − Insurance
- −$1,750
- − Repairs & maintenance
- −$2,920
- − Management
- −$2,920
- − Depreciation
- −$10,182
- Taxable loss
- −$1,596
- Est. tax savings @ 24.0%
- +$383
- After-tax cash flow
- $4,724/yr
For passive investors: Depreciation is non-cash, so a rental often shows a tax loss while cash-flowing — sheltering income. Rental losses are passive: they offset passive income freely, and up to $25,000/yr can offset ordinary (W-2) income if you actively participate and your MAGI is under $100k (phasing out to $0 by $150k); unused losses carry forward. On sale, claimed depreciation is recaptured at up to 25%, and gains may owe capital-gains tax (a 1031 exchange can defer both). Figures are a year-1 estimate at your 24.0% rate — not tax advice; consult a CPA.
Schools (NCES district)
- District
- San Bernardino City Unified
- NCES district ID
- 0634170
- Math proficiency
- 27% ▲ 1.00%
- Reading proficiency
- 40% ▬ 0.00%
- Median HH income
- $39,758
- Composite
- 30.8/100
- National rank
- #11385
- State rank
- #959 of 1400 in CA
Livability — San Bernardino
- Score
- 59/100
- State rank
- #661
- US rank
- #20479
Category grades
Schools grade is shown separately in the Schools card above.
Census & demographics
- Census place
- San Bernardino, CA
- County
- San Bernardino County · 2,030,291 people
- City population
- 255,614
- Metro
- Riverside-San Bernardino-Ontario, CA
- Population (ZIP)
- 27,249
- Household income
- $54,324
- Rent vs Own
- Severe rent burden
- 956.0
Population outlook (San Bernardino County) Hauer SSP2
- Today (2025)
- 2,300,329 people
- By 2030
- 2,378,907 · +3.4%
- By 2040
- 2,523,137 · +9.7%
- By 2050
- 2,642,388 · +14.9%
- By 2075
- 2,880,769 · +25.2%
- By 2100
- 2,909,436 · +26.5%
Race, ethnicity, and origin ACS 2023
- Neighborhood character
- Predominantly Hispanic (83%)
- Race & ethnicity
- Hispanic / Latino 83% Two or more races 15% Black 9% White 3% Asian 2%
- Hispanic origin (detail)
- Mexican 77%
- Foreign-born
- 27% · Canada, Vietnam
- Languages at home
- 34% English-only · Spanish 64% Other Asian/Pacific 1% Tagalog/Filipino 1%
Political lean MEDSL · San Bernardino
- 2024 margin
- Toss-up / Even · D 47.5% · R 49.7% · Other 2.8%
- 2008→2024 swing
- -8.5pp toward R · 2008: 6.3pp · 2024: -2.1pp
- All cycles
- 2024: R+2.1 2020: D+10.7 2016: D+9.8 2012: D+5.4 2008: D+6.3
Not yet ingested
- Civics
- —
Market trends
- HPI YoY
- ▲ 23.96%
- Current HPI
- 633.7636
- Rent YoY
- —
- Metro
- Riverside-San Bernardino-Ontario, CA
- State GDP YoY
- ▲ 3.21%
- F500 in state
- 116
Industry mix (Fortune 500 HQ in CA)
| Industry | F500 HQs | Revenue |
|---|---|---|
| Technology | 27 | $1,492B |
|
||
| Financial Services | 3 | $174B |
|
||
| Retail | 3 | $44B |
|
||
| Insurance | 3 | $26B |
|
||
| Media / Entertainment | 2 | $115B |
|
||
| Pharmaceuticals / Biotech | 2 | $62B |
|
||
Price history
1 event — show timeline
- 2026-05-20 Listed $350,000 CRMLS
Property tax history
+3.6%/yrLatest (2025): $714 · -44.3% YoY. Source: county tax records.
Cash-flow waterfall
monthlySold comps — $/sqft
last 12 mo · ≤1 miLoading sold comps…