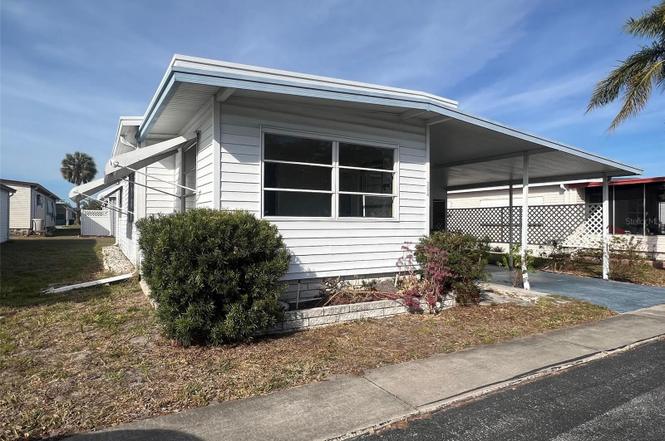
354 King Palm St · Largo, FL
Flood risk 1/10 · Minimal
- FEMA flood zone
- X (unshaded)
- Chance of flooding over 30 yrs
- 0.0%
- Est. flood insurance / yr
- $507 – $1,088
Fire risk 1/10 · Minimal
- Est. fire insurance / yr
- $947 – $1,759
Heat risk 10/10 · Severe
- Hot days now (above 108°F)
- 6 days/yr
- Hot days in 30 yrs
- 18 days/yr
Wind risk 10/10 · Severe
- Chance of severe wind over 30 yrs
- 99.0%
Air-quality risk 3/10 · Minor
- Unhealthy air days now
- 2 days/yr
- Unhealthy air days in 30 yrs
- 3 days/yr
Risk factors via First Street. Map © Google.
Why this score? — see what drove the B+ grade
The composite is a weighted blend of 9 inputs, each scored 0–100. Each bar is that input's sub-score; the figure is the points it added to the 100-point composite (weight × sub-score).
- Cash flow +30.0/30.0
- ARV discount +13.3/15.0
- 1% rule +10.0/10.0
- DSCR +10.0/10.0
- Schools +4.3/10.0
- Livability +4.1/5.0
- Rent growth +2.8/5.0
- Condition / age +2.5/5.0
- Appreciation +0.0/10.0
$58,200
🖨 Deal sheet 📄 Offer letter ✓ Due diligence
Listing remarks
Perfectly positioned within Palm Hill Country Club, a 55+ community, this two-bedroom, one-and-a-half-bath residence enjoys a prime location directly across from the clubhouse and pool, placing recreation and leisure just steps from your front door. The $595.00 monthly maintenance fee includes water, sewer, garbage pickup, lawn service, cable, and internet—making for hassle-free living with bundled utilities. Residents have plenty to enjoy: a nine-hole golf course, two clubhouses, three swimming pools, two jacuzzis, three tennis courts, two bocce courts, two shuffleboard complexes (one fully enclosed), two billiards rooms, horseshoe pits, and a pickleball court. With so many activitie
Key facts
- Two jacuzzis
- Three swimming pools
- Two bocce courts
Tags
Property features AI
Finance
- Other: Partially furnished
- Financial info: Total monthly fees $554; total annual fees $6,648; Lease restrictions apply
- HOA & community: Has HOA; monthly fee $554 (includes cable TV, pool, internet, grounds maintenance, management, recreational facilities, sewer, trash, water, escrow reserves fund); Association amenities: clubhouse, golf course, laundry, pickleball court(s), pool, recreation facilities, shuffleboard court, spa/hot tub, tennis court(s); Association approval required; Buyer approval required; Senior community; Pets not allowed; Golf carts allowed; Community mailbox; Sidewalks; Association contact: Megan DiBello
Exterior
- Parking: Carport (1 space)
- Utilities: Public water; Public sewer; Cable available; High-speed internet available; Electricity available and connected; Water connected; Sewer connected; BB/HS internet available
- Home design: Residential mobile home (double wide); One story; Faces south; Entry level: One
- Construction: Vinyl siding; Roof over; Crawlspace foundation; Building area total 1492 sq ft
- Exterior features: Enclosed patio/porch; Sidewalk; Sliding doors; Shed(s)
Interior
- Kitchen: Dishwasher; Microwave; Range; Refrigerator; Electric water heater
- Bedrooms: 2 bedrooms
- Flooring: Ceramic tile; Laminate; Vinyl
- Bathrooms: 1 full bath; 1 half bath
- Heating & cooling: Central heating; Central air
- Interior features: Ceiling fans; Eat-in kitchen; Thermostat; Window treatments; Florida room
- Laundry & utility: Washer; Dryer; Laundry: other
Neighborhood map
What this means for you Summary
Snapshot
- This is a 2-bed/2.0-bath manufactured listed at $58k.
Deal economics
- At list price, monthly cash flow is $580 ($7k/yr) — positive.
- The deal already cash-flows at list — no discount required.
- Meets the 1% rule at list price ($2k rent vs $58k).
- Recommended offer: $53k (9.0% below list) — sets the bar for market timing.
- Cap rate 18.2% vs local median 4.2% in Largo — top-decile yield for the area; either an underpriced asset or a hidden risk that comps aren't pricing in. Stress-test before assuming the spread holds.
Location & tenants
- Location reads 82/100 on livability (#82 in FL, #1,240 nationally) — a professional / high-income tenant draw. Strengths: commute A+, cost of living A+, housing A+; Watch: employment D+, amenities F.
- Pinellas (suburban): math 51% / reading 51% proficiency, ranked #31 of 73 in FL (top 42%) — acceptable for families but not a draw, mixed tenant base, ~2y average lease.
- Market conditions: Rents rising (+1.4%/yr); 139 active listings in the ZIP; 35 comparable units currently listed for rent nearby; rentals leasing fast (median 8d on market — plan ~1-2 weeks tenant-placement turnaround); 2,676 units permitted in Pinellas County in 2024 (1,422 in 5+ unit buildings).
- This rent runs 35% of the median local income ($65k/yr) — at the standard rent-burdened threshold; future hikes will face affordability resistance.
Forward outlook
- Local home prices are declining (-3.0%/yr); year-one equity from $402 of loan paydown is wiped out by about $2k of value loss. Plan a longer hold.
- Pinellas County population projected at +14% by 2050 — modest demand growth; plan on rents tracking national, not racing it.
- At projected returns (-3.0% appreciation + 1.4% rent growth), your $16k cash investment doubles in ~3 years — after that, you're playing with house money.
Negotiation context
- It's been on market 113 days — a 9% lower offer ($53k) is reasonable based on typical stale-listing flexibility.
- 2 sale attempts since 4y ago; this cycle's ask has dropped $7k (10%) from the opening price — seller is motivated, your offer sets the floor, not the list.
Risks & watch-outs
- Watch-outs: HOA is 29% of rent.
- Climate carrying-cost: severe wind risk, 99% chance of damaging wind over 30y; extreme-heat days projected 6→18/yr by 2055 (HVAC capex compounding) — expect insurance premiums to compound above CPI over the hold.
Questions for the listing agent
- It's been on market 113 days. Have you received any prior offers? Is the seller open to a 9% concession, seller financing, or rate buy-down credit?
- Built in 1975 — when were the roof, HVAC, electrical panel, plumbing, and water heater last replaced?
- What does the HOA fee cover, when was the last increase, and are there any pending special assessments or reserve-fund shortfalls?
- Why hasn't it sold? Are there any deal-killer items the seller is aware of (foundation, flood, title, zoning, code violations)?
- Is there a deadline driving the sale (1031 exchange, divorce, estate, relocation)? That informs how much negotiation room exists.
- What's the average days-on-market for RENTAL listings here right now (not sales)? A rising rental-DOM trend means longer vacancies and softer asking-rent achievability than the comps imply.
- What's the recent tenant-quality profile in this submarket — average credit score on applications, eviction rate, late-payment / NSF rate, and stable-employment percentage? A property-management company in the area should have these aggregated.
- How much new for-sale + rental construction is in the pipeline within 1–3 miles? Heavy new supply typically softens prices + rents 12–24 months out; constrained supply supports both.
Investment metrics
- 1% rule
- 3.25% ✓
- Cap rate
- 18.24%
- Cash-on-cash
- 42.68%
- DSCR
- 2.90
- GRM
- 2.6
CMA / ARV
- ARV (on-the-fly)
- $66,816
- Comps found
- 5
Show comp detail 5 sales within ~0.75 mi
| Address | Dist | Beds/Ba | Sqft | Sold | Price | $/sf | Match |
|---|---|---|---|---|---|---|---|
| 21 Frangipani Cir | 0.56mi | 2/2.0 | 785 (+2%) | 9mo | $49,000 | $62 | 63 |
| 13 Pindo Palm St E | 0.51mi | 2/1.0 | 720 (-6%) | 1mo | $47,000 | $65 | 61 |
| 95 Pindo Palm St E | 0.24mi | 2/2.0 | 672 (-12%) | 15mo | $89,000 | $132 | 55 |
| 38 Pindo Palm St E | 0.33mi | 2/2.0 | 864 (+12%) | 19mo | $135,000 | $156 | 48 |
| 13 Frangipani Cir | 0.57mi | 2/2.0 | 864 (+12%) | 11mo | $75,000 | $87 | 44 |
Match score weights: distance 35% · size 25% · config 20% · recency 20%. Top-matched comps best support the ARV.
Projected returns pro-forma
-3.0% appreciation · 1.38% rent growth · sell at horizon
- IRR
- 36.9%
- Equity multiple
- 2.52×
- Total profit
- $24,790
- Equity at exit
- $8,678
- IRR
- 42.4%
- Equity multiple
- 4.59×
- Total profit
- $58,460
- Equity at exit
- $5,032
Cash invested: $16,296 (down + closing). Projections, not guarantees.
Landlord ↔ Tenant lean methodology
- Overall (STATE)
- 87 Strongly Landlord-Friendly
- State Florida
- 87 Strongly Landlord-Friendly · R+3
- County
- — inherits STATE
- City
- — inherits STATE
ZIP-level market 33778
- Rents YoY
- 1.4%
- Active inventory
- 139
- Price-to-rent
- 2.6×
Monthly cashflow live
- Estimated rent
- $1,891 high interval (Pro) →
- Mortgage (P&I)
- −$305
- Tax from tax record
- −$31 /mo · $372/yr
- Insurance
- −$24
- HOA
- −$554
- Vacancy / Maint / Mgmt
- −$397
- Net cashflow
- $580
Break-even live
UW: 25.0% down · 7.5% · 30yr · 1.5% tax · 5.0% vac · 8.0% maint · 8.0% mgmt
Financing live
Cash to close
- Down payment
- $14,550
- Closing costs
- $1,746
- Reserves months
- —
- Total cash needed
- —
Loan-product check · same deal, 3 products live
Conventional
25% down · 7.5% · 30yr
- Down + closing
- —
- Monthly P&I
- —
- Monthly cashflow
- —
- DSCR
- —
- Eligible?
- —
Personal DTI + credit; lowest rate.
DSCR
20% down · 8.5% · 30yr
- Down + closing
- —
- Monthly P&I
- —
- Monthly cashflow
- —
- DSCR
- —
- Eligible?
- —
No personal income docs; deal must DSCR.
Hard money
10% down · 12.0% · 12mo
- Down + closing
- —
- Monthly P&I
- —
- Monthly cashflow
- —
- DSCR
- —
- Eligible?
- —
Short-term bridge; refi at stabilization.
Rent comps 35 comps
| Address | Beds | Baths | Sqft | Rent | $/sqft | DOM | Units | Dist |
|---|---|---|---|---|---|---|---|---|
| 253 Sago Palm St Largo, FL | 2.0 | 2.0 | 1000 | $1,295 | $1.29 | 24d | 1 | 0.03mi |
| 2098 Seminole Blvd Largo, FL | 1.0–3.0 | 1.0–2.0 | 1018 | $2,395 | $2.35 | 2d | 23 | 0.26mi |
| 775 Royal Palm Cir Largo, FL | 2.0 | 2.0 | 1008 | $1,700 | $1.69 | 3d | 1 | 0.26mi |
| 2131 Ridge Rd S #105 Largo, FL | 2.0 | 1.5 | 1035 | $1,850 | $1.79 | 24d | 1 | 0.28mi |
| 1201 Seminole Blvd Largo, FL | 1.0–3.0 | 1.0–2.0 | 1067 | $1,870 | $1.75 | 1d | 1 | 0.35mi |
| 13333 Ridge Rd Largo, FL | 1.0–2.0 | 1.0–1.5 | 860 | $1,765 | $2.05 | 7d | 1 | 0.67mi |
| 910 9th Ave SW Largo, FL | 3.0 | 2.0 | 1120 | $2,100 | $1.88 | 3d | 1 | 0.78mi |
| 705 Redbud LN Largo, FL | 1.0–2.0 | 1.0–2.0 | 986 | $2,615 | $2.65 | 1d | 189 | 0.80mi |
| 1448 Oak St Largo, FL | 2.0 | 2.0 | 1070 | $2,300 | $2.15 | 3d | 1 | 0.90mi |
| 1517 16th Cir SE Largo, FL | 1.0 | 1.0 | 625 | $1,250 | $2.00 | 3d | 1 | 0.92mi |
| 157 2nd Ave SW Unit A Largo, FL | 2.0 | 1.0 | 678 | $1,600 | $2.36 | 24d | 1 | 0.92mi |
| 12651 Seminole Blvd #44 Largo, FL | 2.0 | 1.5 | 1000 | $1,450 | $1.45 | 24d | 1 | 1.01mi |
| 911 Washington Ave #212 Largo, FL | 2.0 | 2.0 | 885 | $1,675 | $1.89 | 4d | 1 | 1.06mi |
| 11960 133rd Ave Largo, FL | 3.0 | 1.0 | 936 | $2,150 | $2.30 | 7d | 1 | 1.07mi |
| 1825 134th Ave Largo, FL | 3.0 | 2.0 | 1005 | $2,200 | $2.19 | 24d | 1 | 1.10mi |
| 13001 120th St Largo, FL | 3.0 | 1.0 | 1044 | $1,950 | $1.87 | 7d | 1 | 1.14mi |
| 11666 126th Ter Largo, FL | 3.0 | 1.0 | 1056 | $2,183 | $2.07 | 24d | 1 | 1.15mi |
| 11201 122nd Ave Largo, FL | 1.0–2.0 | 1.0–2.0 | 867 | $2,300 | $2.65 | 4d | 2 | 1.18mi |
| 417 Woodrow Ave Largo, FL | 1.0 | 1.0 | 650 | $1,175 | $1.81 | 17d | 1 | 1.26mi |
| 264 Ridge Rd N Largo, FL | 3.0 | 1.5 | 981 | $2,400 | $2.45 | 24d | 1 | 1.30mi |
| 12100 Seminole Blvd Largo, FL | 2.0 | 2.0 | 1050 | $1,750 | $1.67 | 24d | 1 | 1.31mi |
| 2272 16th Ave SW Unit C Largo, FL | 2.0 | 1.0 | 1031 | $2,600 | $2.52 | 24d | 1 | 1.32mi |
| 605 4th Ave NW Largo, FL | 1.0–2.0 | 1.0–2.0 | 1032 | $2,350 | $2.28 | 3d | 6 | 1.36mi |
| 1100 East Bay Dr #104 Largo, FL | 2.0 | 2.0 | 840 | $1,950 | $2.32 | 3d | 1 | 1.36mi |
| 705 3rd Ave NE Unit C Largo, FL | 3.0 | 2.0 | 1113 | $2,195 | $1.97 | 3d | 1 | 1.36mi |
| 1741 Trotter Rd Unit A Largo, FL | 2.0 | 1.0 | 800 | $1,350 | $1.69 | 24d | 1 | 1.38mi |
| 428 4th St NW Largo, FL | 2.0 | 1.0 | 850 | $1,900 | $2.24 | 24d | 1 | 1.40mi |
| 1320 1st Ave NW Largo, FL | 2.0 | 1.0 | 1100 | $2,100 | $1.91 | 24d | 1 | 1.41mi |
| 423 4th St NW Largo, FL | 3.0 | 1.0 | 960 | $1,500 | $1.56 | 4d | 1 | 1.41mi |
| 1500 West Bay Dr Largo, FL | 2.0 | 1.0 | 740 | $1,595 | $2.16 | 14d | 1 | 1.44mi |
| 516 5th Ave NE Largo, FL | 3.0 | 2.0 | 1057 | $2,250 | $2.13 | 23d | 1 | 1.47mi |
| 516 5th Ave NE Largo, FL | 3.0 | 2.0 | 1073 | $2,250 | $2.10 | 14d | 1 | 1.47mi |
| 556 Clearwater Largo Rd Unit 1 Largo, FL | 2.0 | 1.0 | 750 | $1,600 | $2.13 | 1d | 1 | 1.49mi |
| 558 Clearwater Largo Rd Unit 1 Largo, FL | 1.0 | 1.0 | 620 | $1,400 | $2.26 | 1d | 1 | 1.49mi |
| 447 6th Ave NE Unit B Largo, FL | 2.0 | 1.0 | 840 | $1,650 | $1.96 | 10d | 1 | 1.50mi |
HOA detail
- Monthly dues
- $554 · $6,648/yr
- Likely covers
- watersewertrashinternetcablepool
Listing history 19 events
-
2026-06-18days on market $58,200 Active 113 DOM
-
2026-06-17days on market $58,200 Active 112 DOM
-
2026-06-16days on market $58,200 Active 111 DOM
-
2026-06-15days on market $58,200 Active 110 DOM
-
2026-06-13days on market $58,200 Active 108 DOM
-
2026-06-09days on market $58,200 Active 104 DOM
-
2026-06-08days on market $58,200 Active 103 DOM
-
2026-06-07days on market $58,200 Active 102 DOM
-
2026-06-04days on market $58,200 Active 99 DOM
-
2026-06-03days on market $58,200 Active 98 DOM
-
2026-06-01days on market $58,200 Active 96 DOM
-
2026-05-31days on market $58,200 Active 95 DOM
-
2026-04-11price $58,200
-
2026-02-26$64,900 Active
-
2023-01-12historical
-
2022-12-14$139,500 Active
-
2006-03-01soldstatus $59,000
-
2005-10-01soldstatus $60,200
-
2001-11-20soldstatus $45,000
ⓘ Source: listings_history table (triggers on properties + properties_extension) + one-shot
backfill from property_details.listing_events for pre-trigger history.
Tax reassessment forecast FL · Resets to sale price
- Current annual tax
- $372 · $31/mo
- Projected year-2 tax
- $483 · $40/mo
- Expected delta
- +$111/yr (+$9/mo · 30.0%)
ⓘ Screening estimate from a state-policy table — verify with the county assessor before closing.
Climate risk First Street
- Flood 1/10 Low FEMA zone X (unshaded) · 0% chance over 30 yrs
- Wildfire 1/10 Low
- Heat 10/10 Extreme 6 d/yr ≥108°F today · 18 d/yr by 30 yrs out
- Wind 10/10 Extreme 99% chance of damaging wind over 30 yrs
- Air quality 3/10 Moderate 2 unhealthy d/yr today · 3 by 30 yrs out
Nearby sold comps map
Loading sold comps map…
Walkable amenities ~0.75 mi
Loading nearby amenities…
Taxation est. · year 1
- Rental income
- $22,693
- − Mortgage interest
- −$3,260
- − Property taxes
- −$372
- − Insurance
- −$291
- − Repairs & maintenance
- −$1,815
- − Management
- −$1,815
- − HOA
- −$6,648
- − Depreciation
- −$1,693
- Taxable income
- $6,798
- Est. tax owed @ 24.0%
- −$1,632
- After-tax cash flow
- $5,323/yr
For passive investors: Depreciation is non-cash, so a rental often shows a tax loss while cash-flowing — sheltering income. Rental losses are passive: they offset passive income freely, and up to $25,000/yr can offset ordinary (W-2) income if you actively participate and your MAGI is under $100k (phasing out to $0 by $150k); unused losses carry forward. On sale, claimed depreciation is recaptured at up to 25%, and gains may owe capital-gains tax (a 1031 exchange can defer both). Figures are a year-1 estimate at your 24.0% rate — not tax advice; consult a CPA.
Schools (NCES district)
- District
- Pinellas
- NCES district ID
- 1201560
- Math proficiency
- 51% ▼ -5.00%
- Reading proficiency
- 51% ▼ -3.00%
- Median HH income
- $46,270
- Composite
- 43.27/100
- National rank
- #3046
- State rank
- #31 of 73 in FL
Livability — Largo
- Score
- 82/100
- State rank
- #82
- US rank
- #1240
Category grades
Schools grade is shown separately in the Schools card above.
Census & demographics
- Census place
- Largo, FL
- County
- Pinellas County · 939,478 people
- City population
- 106,311
- Metro
- Tampa-St. Petersburg-Clearwater, FL
- Population (ZIP)
- 16,807
- Household income
- $65,355
- Rent vs Own
- Severe rent burden
- 261.0
Population outlook (Pinellas County) Hauer SSP2
- Today (2025)
- 1,027,532 people
- By 2030
- 1,063,586 · +3.5%
- By 2040
- 1,125,020 · +9.5%
- By 2050
- 1,168,637 · +13.7%
- By 2075
- 1,265,188 · +23.1%
- By 2100
- 1,260,357 · +22.7%
Race, ethnicity, and origin ACS 2023
- Neighborhood character
- Predominantly White (72%)
- Race & ethnicity
- White 72% Hispanic / Latino 15% Two or more races 11% Black 9% Asian 2%
- Hispanic origin (detail)
- Puerto Rican 3% Cuban 6%
- Common ancestry
- Romanian 3% Italian 3% Lithuanian 3%
- Foreign-born
- 13% · Canada, Vietnam, Jamaica
- Languages at home
- 85% English-only · Spanish 10% Vietnamese 1% French/Haitian/Cajun 1%
Political lean MEDSL · Pinellas
- 2024 margin
- Lean R (+5.2) · D 46.9% · R 52.1%
- 2008→2024 swing
- -13.5pp toward R · 2008: 8.3pp · 2024: -5.2pp
- All cycles
- 2024: R+5.2 2020: D+0.2 2016: R+1.1 2012: D+5.6 2008: D+8.3
Not yet ingested
- Civics
- —
Market trends
- HPI YoY
- ▼ -320.64%
- Current HPI
- 369.3008
- Rent YoY
- ▲ 1.38%
- Metro
- Tampa-St. Petersburg-Clearwater, FL
- State GDP YoY
- ▲ 3.28%
- F500 in state
- 36
Industry mix (Fortune 500 HQ in FL)
| Industry | F500 HQs | Revenue |
|---|---|---|
| Industrial Technology | 2 | $29B |
|
||
| Insurance | 2 | $17B |
|
||
| Retail | 1 | $60B |
|
||
| Technology Distribution | 1 | $58B |
|
||
| Homebuilding | 1 | $35B |
|
||
| Technology Manufacturing | 1 | $35B |
|
||
Price history
+29.3% since first listed7 events — show timeline
- 2026-04-11 Price Changed $58,200 Stellar MLS as Distributed by MLS Grid
- 2026-02-26 Listed $64,900 Stellar MLS as Distributed by MLS Grid
- 2023-01-12 Listing Removed — Stellar MLS as Distributed by MLS Grid
- 2022-12-14 Listed $139,500 Stellar MLS as Distributed by MLS Grid
- 2006-03-01 Sold (Public Records) $59,000 Public Records
- 2005-10-01 Sold (Public Records) $60,200 Public Records
- 2001-11-20 Sold (Public Records) $45,000 Public Records
Property tax history
-3.5%/yrLatest (2025): $372 · +6.2% YoY. Source: county tax records.
Cash-flow waterfall
monthlySold comps — $/sqft
last 12 mo · ≤1 miLoading sold comps…