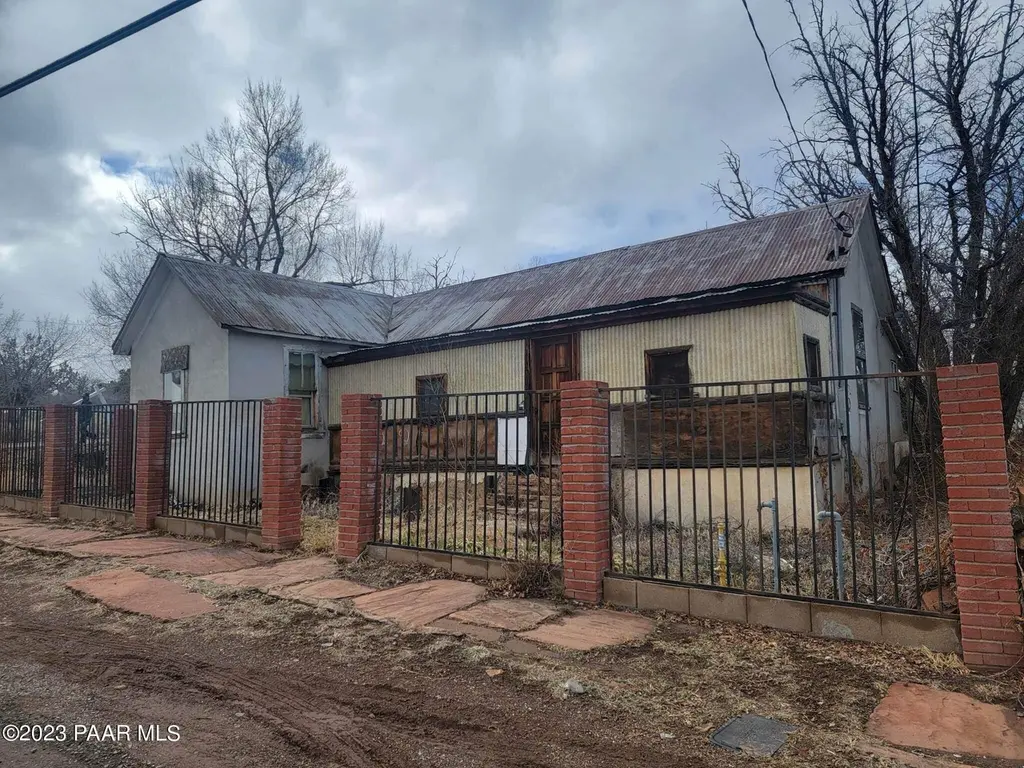
268 W Park Ave · Ash Fork, AZ
Flood risk 1/10 · Minimal
- FEMA flood zone
- X (unshaded)
- Chance of flooding over 30 yrs
- 0.0%
- Est. flood insurance / yr
- $507 – $1,088
Fire risk 5/10 · Moderate
- Est. fire insurance / yr
- $610 – $1,132
Heat risk 4/10 · Minor
- Hot days now (above 95°F)
- 7 days/yr
- Hot days in 30 yrs
- 17 days/yr
Wind risk 1/10 · Minimal
- Chance of severe wind over 30 yrs
- —
Air-quality risk 1/10 · Minimal
- Unhealthy air days now
- 0 days/yr
- Unhealthy air days in 30 yrs
- 0 days/yr
Risk factors via First Street. Map © Google.
Why this score? — see what drove the C+ grade
The composite is a weighted blend of 9 inputs, each scored 0–100. Each bar is that input's sub-score; the figure is the points it added to the 100-point composite (weight × sub-score).
- ARV discount +15.0/15.0
- Cash flow +14.1/30.0
- Appreciation +10.0/10.0
- Schools +5.5/10.0
- DSCR +4.3/10.0
- 1% rule +3.2/10.0
- Livability +3.2/5.0
- Rent growth +2.5/5.0
- Condition / age +2.5/5.0
$150,000
🖨 Deal sheet 📄 Offer letter ✓ Due diligence
Listing remarks
2 homes for the price of one . Great location , Great investment opportunity! both Homes need TLC
Key facts
- 8,712 sq ft lot
- Built 1914
- Listed 1203 days
Property features AI
Finance
- Other: Zoned C2-2; Lot size about 0.2 acres; Lot size source: county records; Road maintained by county; Subdivision: Ash Fork
- HOA & community: Not a senior community
Exterior
- Utilities: Public water; Electricity available; No water heater
- Home design: Single-family residence; 2 stories
- Construction: Block construction; Other roof; Piers foundation; Built area approximately 3,005
- Exterior features: Partial fencing; Corner lot; City street frontage with asphalt road
Interior
- Flooring: Other (see remarks)
- Bathrooms: 1 full bathroom; 1 half bathroom
- Heating & cooling: Forced gas heating
- Interior features: Wood-burning fireplace; Workshop
Neighborhood map
What this means for you Summary
Snapshot
- This is a 2-bed/0.5-bath single-family listed at $150k.
Deal economics
- At list price, monthly cash flow is $22 ($269/yr) — positive.
- The deal already cash-flows at list — no discount required.
- To meet the 1% rule (rent ≥ 1% of price), the offer needs to be $124k (17.5% below list).
- Recommended offer: $124k (17.5% below list) — sets the bar for 1% rule.
Location & tenants
- Location reads 65/100 on livability (#87 in AZ) — a middle-class / working-renter tenant base. Strengths: cost of living A+, housing A+; Watch: crime F, amenities F, commute F.
- Ash Fork Joint Unified District (4471) (rural): math 65% / reading 65% proficiency, ranked #58 of 501 in AZ (top 12%) — acceptable for families but not a draw, mixed tenant base, ~2y average lease; 87% free/reduced lunch — lower-income household profile, screen leases tightly.
- Market conditions: 155 active listings in the ZIP; 2,062 units permitted in Yavapai County in 2024 (98 in 5+ unit buildings).
Forward outlook
- In year one you build about $16k of equity ($1k loan paydown + $15k appreciation (10.0% local appreciation)).
- Yavapai County population projected at +10% by 2050 — modest demand growth; plan on rents tracking national, not racing it.
- At projected returns (10.0% appreciation + 3.0% rent growth), your $42k cash investment doubles in ~3 years — after that, you're playing with house money.
- By year 3, paydown + projected appreciation supports a ~$41k cash-out refi (75% LTV) — recoverable capital for the next deal without selling this one.
Negotiation context
- It's been on market 1204 days — a 12% lower offer ($132k) is reasonable based on typical stale-listing flexibility.
- 6 sale attempts since 5y ago with the ask held roughly flat each time — persistent listings suggest the price (not the market) is what's stuck; bring a comps-based counter.
- Current owner paid $14k; list at $150k implies a 934% gain — meaningful room to come down on a strong offer.
Risks & watch-outs
- Watch-outs: built in 1914 — expect roof / HVAC / electrical / plumbing capex.
- Climate carrying-cost: moderate wildfire risk — expect insurance premiums to compound above CPI over the hold.
Questions for the listing agent
- It's been on market 1204 days. Have you received any prior offers? Is the seller open to a 18% concession, seller financing, or rate buy-down credit?
- Built in 1914 — when were the roof, HVAC, electrical panel, plumbing, and water heater last replaced?
- Why hasn't it sold? Are there any deal-killer items the seller is aware of (foundation, flood, title, zoning, code violations)?
- Is there a deadline driving the sale (1031 exchange, divorce, estate, relocation)? That informs how much negotiation room exists.
- Crime grade is F in this area — have there been break-ins, vandalism, or insurance claims at this property in the last 3 years? What carrier currently insures it and at what premium?
- What's the average days-on-market for RENTAL listings here right now (not sales)? A rising rental-DOM trend means longer vacancies and softer asking-rent achievability than the comps imply.
- What's the recent tenant-quality profile in this submarket — average credit score on applications, eviction rate, late-payment / NSF rate, and stable-employment percentage? A property-management company in the area should have these aggregated.
- How much new for-sale + rental construction is in the pipeline within 1–3 miles? Heavy new supply typically softens prices + rents 12–24 months out; constrained supply supports both.
Investment metrics
- 1% rule
- 0.82% ✗
- Cap rate
- 6.47%
- Cash-on-cash
- 0.64%
- DSCR
- 1.03
- GRM
- 10.1
CMA / ARV
- ARV (median comp)
- $299,804
- List price
- $150,000
- Delta
- -49.97%
- Verdict
- UNDERPRICED
- Comps
- 1 within 2.0 mi
Show comp detail 1 sale within ~0.75 mi
| Address | Dist | Beds/Ba | Sqft | Sold | Price | $/sf | Match |
|---|---|---|---|---|---|---|---|
| 335 Park Ave | 0.08mi | 2/1.0 | 1,140 (-0%) | 10mo | $190,000 | $167 | 85 |
Match score weights: distance 35% · size 25% · config 20% · recency 20%. Top-matched comps best support the ARV.
Projected returns pro-forma
10.0% appreciation · 3.0% rent growth · sell at horizon
- IRR
- 24.7%
- Equity multiple
- 2.98×
- Total profit
- $83,090
- Equity at exit
- $135,132
- IRR
- 21.8%
- Equity multiple
- 6.80×
- Total profit
- $243,501
- Equity at exit
- $291,417
Cash invested: $42,000 (down + closing). Projections, not guarantees.
Landlord ↔ Tenant lean methodology
- Overall (STATE)
- 87 Strongly Landlord-Friendly
- State Arizona
- 87 Strongly Landlord-Friendly · R+3
- County
- — inherits STATE
- City
- — inherits STATE
ZIP-level market 86320
- Home prices YoY
- 4.0%
- Active inventory
- 155
- Price-to-rent
- 10.1×
Monthly cashflow live
- Estimated rent
- $1,237 medium interval (Pro) →
- Mortgage (P&I)
- −$787
- Tax from tax record
- −$106 /mo · $1,272/yr
- Insurance
- −$62
- HOA
- −$0
- Vacancy / Maint / Mgmt
- −$260
- Net cashflow
- $22
Break-even live
UW: 25.0% down · 7.5% · 30yr · 1.5% tax · 5.0% vac · 8.0% maint · 8.0% mgmt
Financing live
Cash to close
- Down payment
- $37,500
- Closing costs
- $4,500
- Reserves months
- —
- Total cash needed
- —
Loan-product check · same deal, 3 products live
Conventional
25% down · 7.5% · 30yr
- Down + closing
- —
- Monthly P&I
- —
- Monthly cashflow
- —
- DSCR
- —
- Eligible?
- —
Personal DTI + credit; lowest rate.
DSCR
20% down · 8.5% · 30yr
- Down + closing
- —
- Monthly P&I
- —
- Monthly cashflow
- —
- DSCR
- —
- Eligible?
- —
No personal income docs; deal must DSCR.
Hard money
10% down · 12.0% · 12mo
- Down + closing
- —
- Monthly P&I
- —
- Monthly cashflow
- —
- DSCR
- —
- Eligible?
- —
Short-term bridge; refi at stabilization.
Listing history 28 events
-
2026-06-19days on market $150,000 Active 1204 DOM
-
2026-06-18days on market $150,000 Active 1203 DOM
-
2026-06-17days on market $150,000 Active 1202 DOM
-
2026-06-16days on market $150,000 Active 1201 DOM
-
2026-06-15days on market $150,000 Active 1200 DOM
-
2026-06-14days on market $150,000 Active 1198 DOM
-
2026-06-12days on market $150,000 Active 1197 DOM
-
2026-06-09days on market $150,000 Active 1194 DOM
-
2026-06-08days on market $150,000 Active 1193 DOM
-
2026-06-07days on market $150,000 Active 1192 DOM
-
2026-06-07days on market $150,000 Active 1191 DOM
-
2026-06-04days on market $150,000 Active 1188 DOM
-
2026-06-02days on market $150,000 Active 1187 DOM
-
2026-06-01days on market $150,000 Active 1186 DOM
-
2026-05-31days on market $150,000 Active 1185 DOM
-
2026-05-31days on market $150,000 Active 1184 DOM
-
2025-12-19status Active
-
2025-11-21historical
-
2024-11-25status Active
-
2024-11-21historical
-
2024-09-02status Active
-
2024-08-27historical Active Under Contract
-
2024-02-17historical
-
2023-02-16$150,000 Active
-
2023-01-30$150,000 Active
-
2022-05-23historical
-
2021-11-17$150,000 Active
-
1997-05-29soldstatus $14,500
ⓘ Source: listings_history table (triggers on properties + properties_extension) + one-shot
backfill from property_details.listing_events for pre-trigger history.
Tax reassessment forecast AZ · Resets to sale price
- Current annual tax
- $1,272 · $106/mo
- Projected year-2 tax
- $1,272 · $106/mo
- Expected delta
- $0/yr ($0/mo · 0.0%)
ⓘ Screening estimate from a state-policy table — verify with the county assessor before closing.
Climate risk First Street
- Flood 1/10 Low FEMA zone X (unshaded) · 0% chance over 30 yrs
- Wildfire 5/10 Major
- Heat 4/10 Moderate 7 d/yr ≥95°F today · 17 d/yr by 30 yrs out
- Wind 1/10 Low
- Air quality 1/10 Low 0 unhealthy d/yr today · 0 by 30 yrs out
Nearby sold comps map
Loading sold comps map…
Walkable amenities ~0.75 mi
Loading nearby amenities…
Taxation est. · year 1
- Rental income
- $14,848
- − Mortgage interest
- −$8,402
- − Property taxes
- −$1,272
- − Insurance
- −$750
- − Repairs & maintenance
- −$1,188
- − Management
- −$1,188
- − Depreciation
- −$4,364
- Taxable loss
- −$2,315
- Est. tax savings @ 24.0%
- +$556
- After-tax cash flow
- $825/yr
For passive investors: Depreciation is non-cash, so a rental often shows a tax loss while cash-flowing — sheltering income. Rental losses are passive: they offset passive income freely, and up to $25,000/yr can offset ordinary (W-2) income if you actively participate and your MAGI is under $100k (phasing out to $0 by $150k); unused losses carry forward. On sale, claimed depreciation is recaptured at up to 25%, and gains may owe capital-gains tax (a 1031 exchange can defer both). Figures are a year-1 estimate at your 24.0% rate — not tax advice; consult a CPA.
Schools (NCES district)
- District
- Ash Fork Joint Unified District (4471)
- NCES district ID
- 0400910
- Math proficiency
- 65% ▲ 5.00%
- Reading proficiency
- 65% ▲ 10.00%
- Median HH income
- $30,345
- Composite
- 54.75/100
- National rank
- #2833
- State rank
- #58 of 501 in AZ
Livability — Ash Fork
- Score
- 65/100
- State rank
- #87
- US rank
- #13536
Category grades
Schools grade is shown separately in the Schools card above.
Census & demographics
- Census place
- Ash Fork, AZ
- Population (ZIP)
- 2,482
Population outlook (Yavapai County) Hauer SSP2
- Today (2025)
- 241,389 people
- By 2030
- 249,523 · +3.4%
- By 2040
- 259,966 · +7.7%
- By 2050
- 264,736 · +9.7%
- By 2075
- 269,334 · +11.6%
- By 2100
- 256,505 · +6.3%
Race, ethnicity, and origin ACS 2023
- Neighborhood character
- Predominantly White (68%)
- Race & ethnicity
- White 68% Hispanic / Latino 22% Two or more races 14%
- Hispanic origin (detail)
- Mexican 22%
- Common ancestry
- Slovak 7% Iranian 6% Lithuanian 5%
- Foreign-born
- 10% · Canada
- Languages at home
- 80% English-only · Spanish 20%
Political lean MEDSL · Yavapai
- 2024 margin
- Solid R (+33.9) · D 32.6% · R 66.5%
- 2008→2024 swing
- -9.5pp toward R · 2008: -24.4pp · 2024: -33.9pp
- All cycles
- 2024: R+33.9 2020: R+29.3 2016: R+31.4 2012: R+30.7 2008: R+24.4
Not yet ingested
- Civics
- —
Market trends
- HPI YoY
- ▲ 11.79%
- Current HPI
- 306.148
- Rent YoY
- —
- Metro
- —
- State GDP YoY
- ▲ 4.54%
- F500 in state
- 20
Industry mix (Fortune 500 HQ in AZ)
| Industry | F500 HQs | Revenue |
|---|---|---|
| Technology | 2 | $13B |
|
||
| Mining / Metals | 1 | $23B |
|
||
| Environmental Services | 1 | $16B |
|
||
| Metals / Steel | 1 | $14B |
|
||
| Technology Distribution | 1 | $9B |
|
||
| Homebuilding | 1 | $8B |
|
||
Price history
+934.5% since first listed12 events — show timeline
- 2025-12-19 Relisted — PAARMLS as Distributed by MLS Grid
- 2025-11-21 Listing Removed — PAARMLS as Distributed by MLS Grid
- 2024-11-25 Relisted — PAARMLS as Distributed by MLS Grid
- 2024-11-21 Listing Removed — PAARMLS as Distributed by MLS Grid
- 2024-09-02 Relisted — PAARMLS as Distributed by MLS Grid
- 2024-08-27 Contingent — PAARMLS as Distributed by MLS Grid
- 2024-02-17 Listing Removed — NAZMLS
- 2023-02-16 Listed $150,000 NAZMLS
- 2023-01-30 Listed $150,000 PAARMLS as Distributed by MLS Grid
- 2022-05-23 Listing Removed — PAARMLS as Distributed by MLS Grid
- 2021-11-17 Listed $150,000 PAARMLS as Distributed by MLS Grid
- 1997-05-29 Sold (Public Records) $14,500 Public Records
Property tax history
+4.7%/yrLatest (2025): $1,272 · +12.6% YoY. Source: county tax records.
Cash-flow waterfall
monthlySold comps — $/sqft
last 12 mo · ≤1 miLoading sold comps…