 Duplex
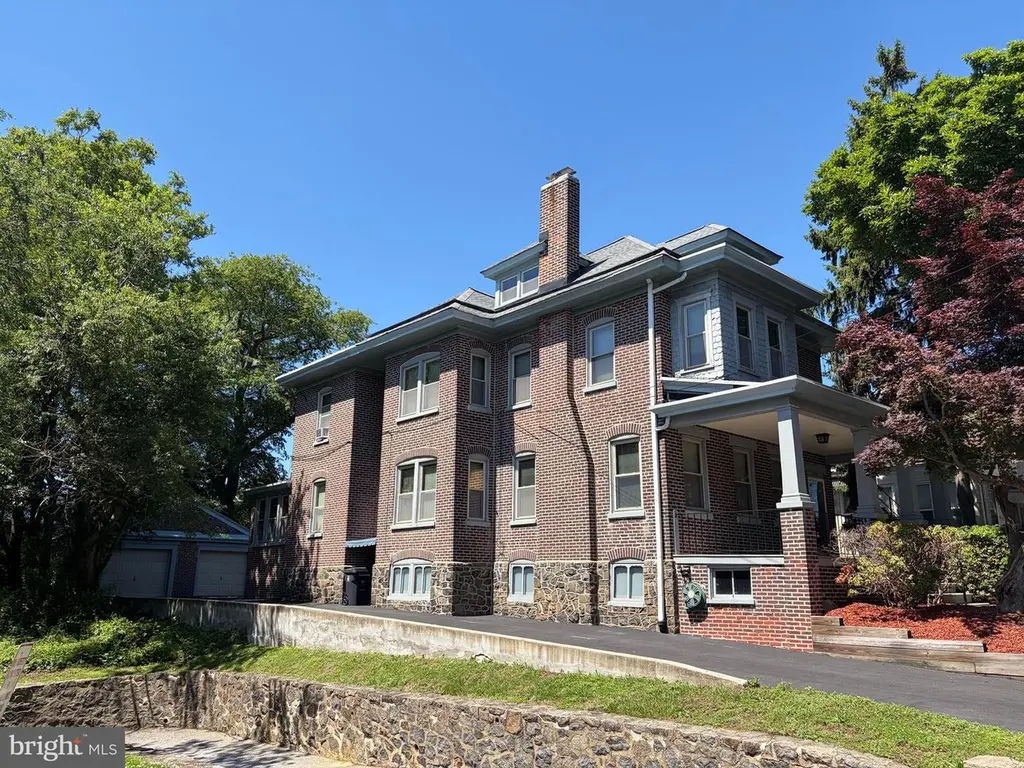
1402 W 8th St · Wilmington, DE
Flood risk 1/10 · Minimal
- FEMA flood zone
- X (unshaded)
- Chance of flooding over 30 yrs
- 0.0%
- Est. flood insurance / yr
- $473 – $860
Fire risk 1/10 · Minimal
- Est. fire insurance / yr
- $476 – $884
Heat risk 7/10 · Major
- Hot days now (above 103°F)
- 7 days/yr
- Hot days in 30 yrs
- 15 days/yr
Wind risk 6/10 · Moderate
- Chance of severe wind over 30 yrs
- 27.0%
Air-quality risk 3/10 · Minor
- Unhealthy air days now
- 3 days/yr
- Unhealthy air days in 30 yrs
- 4 days/yr
Risk factors via First Street. Map © Google.
Why this score? — see what drove the D+ grade
The composite is a weighted blend of 9 inputs, each scored 0–100. Each bar is that input's sub-score; the figure is the points it added to the 100-point composite (weight × sub-score).
- Cash flow +24.0/30.0
- DSCR +7.7/10.0
- 1% rule +5.0/10.0
- Rent growth +3.8/5.0
- Livability +3.2/5.0
- Schools +3.1/10.0
- Condition / age +2.5/5.0
- ARV discount +0.0/15.0
- Appreciation +0.0/10.0
$449,900
🖨 Deal sheet 📄 Offer letter ✓ Due diligence
Multi-family units
County records classify this as Multi-Family (2-4 Unit). Listing-text estimate: 2 units. confirmed
Listing remarks
Executive duplex in a great Cool Spring location. Upgrade your investment portfolio or live in one and rent the other. Great opportunity to own a beautifully maintained home in a prime city location. Lovingly maintained by long-time owner-occupants, this well-cared-for duplex blends timeless character with thoughtful updates and exceptional pride of ownership throughout. A welcoming covered front porch leads to a shared entrance. The first-floor residence opens into an inviting foyer, offering an immediate glimpse of the beautiful hardwood floors, custom millwork, and original architectural details that define the home. The spacious living room features a wood-burning fireplace, decorative
Key facts
- 5,227 sq ft lot
- 4 parking spots
- Built 1918
Property features AI
Finance
- Financial info: Ownership is Fee Simple; Property in excellent condition; Existing leases include month-to-month units; Total of 2 dwelling units with some units leased and some vacant (1 vacant, 2 leased, 1 month-to-month)
Exterior
- Parking: Off-street parking for 4 vehicles (total 4 spaces)
- Utilities: Public water; Public sewer; Natural gas hot water
- Home design: Detached property; 2 stories
- Construction: Brick construction; Stone foundation
- Exterior features: Lot dimensions approximately 40 x 132
Interior
- Bedrooms: One 1-bedroom unit; Three 3-bedroom units
- Flooring: Hardwood
- Heating & cooling: Hot water/radiator heating; Oil-fired heat; Central air conditioning (electric)
- Interior features: Wood floors; Fireplace (1)
- Laundry & utility: Washer and Dryer included
Neighborhood map
What this means for you Summary
Snapshot
- This is a 2 × 5-bed/?-bath units multifamily listed at $450k.
Deal economics
- At list price, monthly cash flow is $877 ($11k/yr) — positive. Per door: $439/mo.
- The deal already cash-flows at list — no discount required.
- To meet the 1% rule (rent ≥ 1% of price), the offer needs to be $448k (0.4% below list).
- Recommended offer: $448k (0.4% below list) — sets the bar for 1% rule.
- Cap rate 8.6% vs local median 5.6% in Wilmington — top-decile yield for the area; either an underpriced asset or a hidden risk that comps aren't pricing in. Stress-test before assuming the spread holds.
Location & tenants
- Location reads 64/100 on livability (#52 in DE) — a middle-class / working-renter tenant base. Strengths: cost of living A+, housing A; Watch: employment D+, schools D, commute D.
- Red Clay Consolidated School District (suburban): math 27% / reading 42% proficiency, ranked #12 of 26 in DE (top 46%) — families likely to look elsewhere, expect single-tenant / working-renter base with shorter leases.
- Market conditions: Rents rising fast (+5.1%/yr); 59 active listings in the ZIP; 7 comparable units currently listed for rent nearby; rentals at typical pace (median 19d on market — plan ~3-4 weeks tenant-placement turnaround); 43% of comp listings sitting > 30 days — soft ceiling on asking rent; solid renter incomes; 1,367 units permitted in New Castle County in 2024 (201 in 5+ unit buildings).
- At $4,479/mo this rent would consume 60% of the median local household income ($89k/yr) (locally 508% of renters already pay >50% of income on rent) — very limited rent-growth headroom before tenants either downsize or default.
Forward outlook
- Local home prices are declining (-3.0%/yr); year-one equity from $3k of loan paydown is wiped out by about $13k of value loss. Plan a longer hold.
- New Castle County population projected at +9% by 2050 — modest demand growth; plan on rents tracking national, not racing it.
- At projected returns (-3.0% appreciation + 5.1% rent growth), your $126k cash investment doubles in ~10 years — after that, you're playing with house money.
Negotiation context
- Only 6 days on market — expect competitive offers; lowballing is unlikely to land.
Risks & watch-outs
- Watch-outs: built in 1918 — expect roof / HVAC / electrical / plumbing capex.
- Climate carrying-cost: major wind risk, 27% chance of damaging wind over 30y; extreme-heat days projected 7→15/yr by 2055 (HVAC capex compounding) — expect insurance premiums to compound above CPI over the hold.
Questions for the listing agent
- Can we see the unit-by-unit rent roll, current vacancy, and any below-market leases? What's the average tenancy length?
- What capital expenditures (roof, boiler, parking lot, exteriors) have been made in the last 5 years, and what's planned in the next 2?
- Built in 1918 — when were the roof, HVAC, electrical panel, plumbing, and water heater last replaced?
- Is there a deadline driving the sale (1031 exchange, divorce, estate, relocation)? That informs how much negotiation room exists.
- Schools are D-rated, which usually means shorter tenancies and higher turnover. Who's the typical renter profile here, and what's been the actual vacancy rate?
- Crime grade is F in this area — have there been break-ins, vandalism, or insurance claims at this property in the last 3 years? What carrier currently insures it and at what premium?
- The area grade is low — what's the realistic commute time and amenity access for the typical tenant pool here? Any planned neighborhood developments (good or bad) we should know about?
- What's the average days-on-market for RENTAL listings here right now (not sales)? A rising rental-DOM trend means longer vacancies and softer asking-rent achievability than the comps imply.
- What's the recent tenant-quality profile in this submarket — average credit score on applications, eviction rate, late-payment / NSF rate, and stable-employment percentage? A property-management company in the area should have these aggregated.
- How much new apartment / multifamily construction is in the pipeline within 1–3 miles? Heavy new supply (>2% of stock underway) typically softens rents 12–24 months out; light construction supports rent growth.
Investment metrics
- 1% rule
- 1.00% ✗
- Cap rate
- 8.63%
- Cash-on-cash
- 8.36%
- DSCR
- 1.37
- GRM
- 8.4
CMA / ARV
- ARV (on-the-fly)
- $365,700
- Comps found
- 9
Show comp detail 9 sales within ~0.75 mi
| Address | Dist | Beds/Ba | Sqft | Sold | Price | $/sf | Match |
|---|---|---|---|---|---|---|---|
| 513 N Broom St | 0.12mi | 5/3.0 (+1) | 2,425 (+5%) | 14mo | $425,000 | $175 | 65 |
| 1329 N Dupont St | 0.48mi | 4/— | 2,225 (-3%) | 10mo | $495,000 | $222 | 64 |
| 804 N Van Buren St | 0.29mi | 3/— (-1) | 2,100 (-9%) | 10mo | $400,000 | $190 | 59 |
| 802 W 9th St | 0.47mi | 3/3.0 (-1) | 2,150 (-6%) | 2mo | $335,000 | $156 | 56 |
| 906 N Madison St | 0.57mi | 4/— | 2,500 (+9%) | 4mo | $370,000 | $148 | 56 |
| 414 Friend Ct | 0.73mi | 4/3.5 | 2,225 (-3%) | 1mo | $354,000 | $159 | 54 |
| 201 N Broom St | 0.34mi | 5/— (+1) | 2,625 (+14%) | 9mo | $319,000 | $122 | 48 |
| 1531 Delaware Ave | 0.57mi | 4/— | 1,975 (-14%) | 6mo | $501,000 | $254 | 45 |
| 613 W 10th St | 0.58mi | 4/3.0 | 2,575 (+12%) | 21mo | $308,000 | $120 | 32 |
Match score weights: distance 35% · size 25% · config 20% · recency 20%. Top-matched comps best support the ARV.
Projected returns pro-forma
-3.0% appreciation · 5.1% rent growth · sell at horizon
- IRR
- -1.6%
- Equity multiple
- 0.94×
- Total profit
- $-7,575
- Equity at exit
- $67,082
- IRR
- 10.0%
- Equity multiple
- 1.84×
- Total profit
- $105,895
- Equity at exit
- $38,899
Cash invested: $125,972 (down + closing). Projections, not guarantees.
Landlord ↔ Tenant lean methodology
- Overall (STATE)
- 70 Landlord-Friendly
- State Delaware
- 70 Landlord-Friendly · D+7
- County
- — inherits STATE
- City
- — inherits STATE
ZIP-level market 19806
- Rents YoY
- 5.1%
- Active inventory
- 59
- Price-to-rent
- 16.7×
Monthly cashflow live
- Estimated rent
- $4,479 medium interval (Pro) →
- Mortgage (P&I)
- −$2,359
- Tax from tax record
- −$114 /mo · $1,372/yr
- Insurance
- −$187
- HOA
- −$0
- Vacancy / Maint / Mgmt
- −$941
- Net cashflow
- $877
Break-even live
2-unit breakdown (identical units grouped — click to expand)
| Units | Beds | Baths | Est. rent |
|---|---|---|---|
| 2× units | 5 | — | $4,480 |
| #1 | 5 | — | $2,240 |
| #2 | 5 | — | $2,240 |
| Total (2 units) | $4,479 | ||
UW: 25.0% down · 7.5% · 30yr · 1.5% tax · 5.0% vac · 8.0% maint · 8.0% mgmt
Financing live
Cash to close
- Down payment
- $112,475
- Closing costs
- $13,497
- Reserves months
- —
- Total cash needed
- —
Loan-product check · same deal, 3 products live
Conventional
25% down · 7.5% · 30yr
- Down + closing
- —
- Monthly P&I
- —
- Monthly cashflow
- —
- DSCR
- —
- Eligible?
- —
Personal DTI + credit; lowest rate.
DSCR
20% down · 8.5% · 30yr
- Down + closing
- —
- Monthly P&I
- —
- Monthly cashflow
- —
- DSCR
- —
- Eligible?
- —
No personal income docs; deal must DSCR.
Hard money
10% down · 12.0% · 12mo
- Down + closing
- —
- Monthly P&I
- —
- Monthly cashflow
- —
- DSCR
- —
- Eligible?
- —
Short-term bridge; refi at stabilization.
Rent comps 7 comps
| Address | Beds | Baths | Sqft | Rent | $/sqft | DOM | Units | Dist |
|---|---|---|---|---|---|---|---|---|
| 1624 W 9th St Wilmington, DE | 3.0 | 2.5 | 1780 | $2,500 | $1.40 | 18d | 1 | 0.24mi |
| 1913 W 2nd St Unit 1913 Wilmington, DE | 5.0 | 1.5 | 1675 | $2,050 | $1.22 | 43d | 1 | 0.51mi |
| 1525 Beech St Wilmington, DE | 3.0 | 2.5 | 1850 | $2,400 | $1.30 | 5d | 1 | 0.71mi |
| 801 N Orange St Wilmington, DE | 3.0 | 1.0–3.0 | 1118 | $3,991 | $3.57 | 2d | 117 | 0.78mi |
| 21 Stroud St Unit 1 Wilmington, DE | 3.0 | 1.5 | 1875 | $1,900 | $1.01 | 43d | 1 | 0.89mi |
| 125 W 23rd St Wilmington, DE | 4.0 | 2.0 | 1672 | $1,995 | $1.19 | 43d | 1 | 1.35mi |
| 2401 N West St Wilmington, DE | 4.0 | 1.0 | 1650 | $1,900 | $1.15 | 15d | 1 | 1.40mi |
Listing history 15 events
-
2026-06-18status $449,900 Pending 6 DOM
-
2026-06-18days on market $449,900 Active 6 DOM
-
2026-06-17days on market $449,900 Active 5 DOM
-
2026-06-16days on market $449,900 Active 4 DOM
-
2026-06-15days on market $449,900 Active 3 DOM
-
2026-06-13remarks 699-char remark
-
2026-06-13statusdays on market $449,900 Active 1 DOM
-
2026-06-09days on market $449,900 Coming Soon 11 DOM
-
2026-06-08days on market $449,900 Coming Soon 10 DOM
-
2026-06-07days on market $449,900 Coming Soon 9 DOM
-
2026-06-04days on market $449,900 Coming Soon 6 DOM
-
2026-06-03days on market $449,900 Coming Soon 5 DOM
-
2026-06-02days on market $449,900 Coming Soon 4 DOM
-
2026-06-01days on market $449,900 Coming Soon 3 DOM
-
2026-05-31days on market $449,900 Coming Soon 2 DOM
ⓘ Source: listings_history table (triggers on properties + properties_extension) + one-shot
backfill from property_details.listing_events for pre-trigger history.
Tax reassessment forecast DE · Partial reset (capped growth)
- Current annual tax
- $1,372 · $114/mo
- Projected year-2 tax
- $1,991 · $166/mo
- Expected delta
- +$619/yr (+$52/mo · 45.1%)
ⓘ Screening estimate from a state-policy table — verify with the county assessor before closing.
Climate risk First Street
- Flood 1/10 Low FEMA zone X (unshaded) · 0% chance over 30 yrs
- Wildfire 1/10 Low
- Heat 7/10 Severe 7 d/yr ≥103°F today · 15 d/yr by 30 yrs out
- Wind 6/10 Major 27% chance of damaging wind over 30 yrs
- Air quality 3/10 Moderate 3 unhealthy d/yr today · 4 by 30 yrs out
Nearby sold comps map
Loading sold comps map…
Walkable amenities ~0.75 mi
Loading nearby amenities…
Taxation est. · year 1
- Rental income
- $53,748
- − Mortgage interest
- −$25,201
- − Property taxes
- −$1,372
- − Insurance
- −$2,250
- − Repairs & maintenance
- −$4,300
- − Management
- −$4,300
- − Depreciation
- −$13,088
- Taxable income
- $3,237
- Est. tax owed @ 24.0%
- −$777
- After-tax cash flow
- $9,750/yr
For passive investors: Depreciation is non-cash, so a rental often shows a tax loss while cash-flowing — sheltering income. Rental losses are passive: they offset passive income freely, and up to $25,000/yr can offset ordinary (W-2) income if you actively participate and your MAGI is under $100k (phasing out to $0 by $150k); unused losses carry forward. On sale, claimed depreciation is recaptured at up to 25%, and gains may owe capital-gains tax (a 1031 exchange can defer both). Figures are a year-1 estimate at your 24.0% rate — not tax advice; consult a CPA.
Schools (NCES district)
- District
- Red Clay Consolidated School District
- NCES district ID
- 1001300
- Math proficiency
- 27% ▼ -11.00%
- Reading proficiency
- 42% ▼ -7.00%
- Median HH income
- $64,298
- Composite
- 31.25/100
- National rank
- #6027
- State rank
- #12 of 26 in DE
Livability — Wilmington
- Score
- 64/100
- State rank
- #52
- US rank
- #14251
Category grades
Schools grade is shown separately in the Schools card above.
Census & demographics
- Census place
- Wilmington, DE
- County
- New Castle County · 483,412 people
- City population
- 173,480
- Metro
- Philadelphia-Camden-Wilmington, PA-NJ-DE-MD
- Population (ZIP)
- 9,777
- Household income
- $88,855
- Rent vs Own
- Severe rent burden
- 508.0
Population outlook (New Castle County) Hauer SSP2
- Today (2025)
- 594,686 people
- By 2030
- 609,164 · +2.4%
- By 2040
- 632,154 · +6.3%
- By 2050
- 649,068 · +9.1%
- By 2075
- 687,771 · +15.7%
- By 2100
- 694,961 · +16.9%
Race, ethnicity, and origin ACS 2023
- Neighborhood character
- Predominantly White (77%)
- Race & ethnicity
- White 77% Black 11% Two or more races 5% Hispanic / Latino 4% Asian 1%
- Common ancestry
- Romanian 7% Slovak 3% Lithuanian 2%
- Foreign-born
- 5% · Canada
- Languages at home
- 94% English-only · Other Indo-European 2% Spanish 2% Russian/Polish/Slavic 1%
Political lean MEDSL · New Castle
- 2024 margin
- Solid D (+32.6) · D 65.5% · R 32.9% · Other 1.6%
- 2008→2024 swing
- -8.1pp toward R · 2008: 40.6pp · 2024: 32.6pp
- All cycles
- 2024: D+32.6 2020: D+37.1 2016: D+29.6 2012: D+34.1 2008: D+40.6
Not yet ingested
- Civics
- —
Market trends
- HPI YoY
- ▼ -290.78%
- Current HPI
- 214.8382
- Rent YoY
- ▲ 5.10%
- Metro
- Philadelphia-Camden-Wilmington, PA-NJ-DE-MD
- State GDP YoY
- —
- F500 in state
- 0
Price history
1 event — show timeline
- 2026-05-29 Coming Soon $449,900 BRIGHT MLS
Property tax history
+1.0%/yrLatest (2024): $1,372 · +21.8% YoY. Source: county tax records.
Cash-flow waterfall
monthlySold comps — $/sqft
last 12 mo · ≤1 miLoading sold comps…