 Multi-family
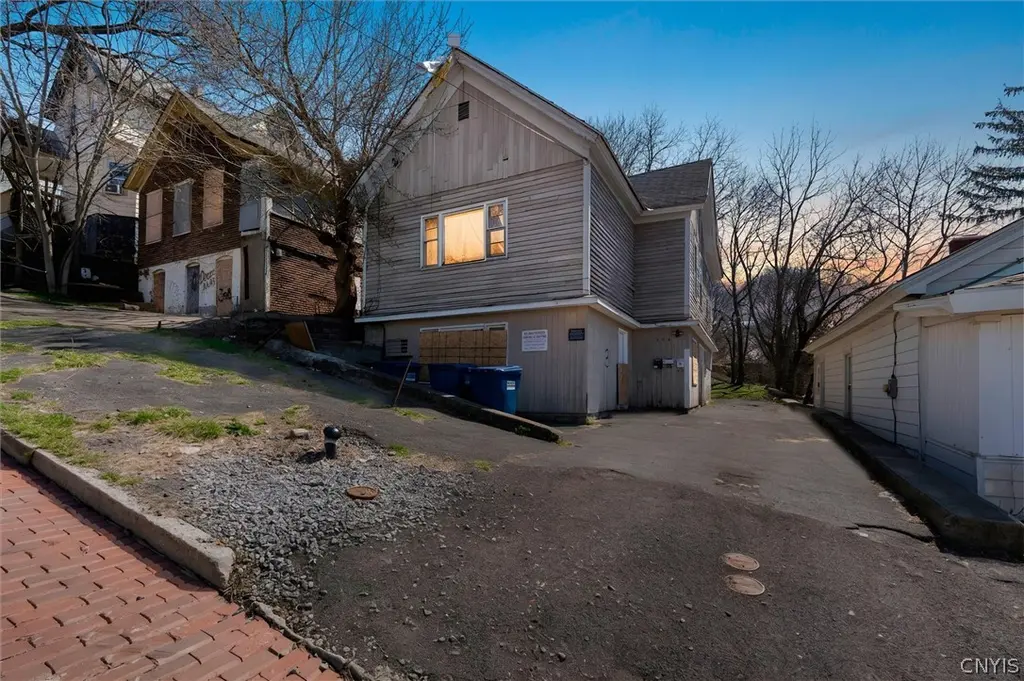
306 John St · Syracuse, NY
Flood risk 1/10 · Minimal
- FEMA flood zone
- X (unshaded)
- Chance of flooding over 30 yrs
- 0.0%
- Est. flood insurance / yr
- $473 – $860
Fire risk 1/10 · Minimal
- Est. fire insurance / yr
- $691 – $1,283
Heat risk 3/10 · Minor
- Hot days now (above 95°F)
- 7 days/yr
- Hot days in 30 yrs
- 16 days/yr
Wind risk 1/10 · Minimal
- Chance of severe wind over 30 yrs
- 0.0%
Air-quality risk 2/10 · Minimal
- Unhealthy air days now
- 0 days/yr
- Unhealthy air days in 30 yrs
- 1 days/yr
Risk factors via First Street. Map © Google.
Why this score? — see what drove the B grade
The composite is a weighted blend of 9 inputs, each scored 0–100. Each bar is that input's sub-score; the figure is the points it added to the 100-point composite (weight × sub-score).
- Cash flow +30.0/30.0
- 1% rule +10.0/10.0
- DSCR +10.0/10.0
- Appreciation +10.0/10.0
- Livability +3.9/5.0
- Rent growth +2.5/5.0
- Condition / age +2.5/5.0
- Schools +1.8/10.0
- ARV discount +0.0/15.0
$150,000
🖨 Deal sheet 📄 Offer letter ✓ Due diligence
Multi-family units
County records classify this as Multi-Family (2-4 Unit). Listing-text estimate: 1 unit. estimate disagrees with records
Key facts
- 3,889 sq ft lot
- 2 parking spots
- Built 1890
Neighborhood map
What this means for you Summary
Snapshot
- This is a 3-bed/3.0-bath multifamily listed at $150k.
Deal economics
- At list price, monthly cash flow is $1k ($17k/yr) — positive.
- The deal already cash-flows at list — no discount required.
- Meets the 1% rule at list price ($3k rent vs $150k).
- Recommended offer: $148k (1.5% below list) — sets the bar for market timing.
- Cap rate 17.4% vs local median 8.2% in Syracuse — top-decile yield for the area; either an underpriced asset or a hidden risk that comps aren't pricing in. Stress-test before assuming the spread holds.
Location & tenants
- Location reads 77/100 on livability (#187 in NY, #2,869 nationally) — a middle-class / working-renter tenant base. Strengths: amenities A+, commute A+, cost of living A+; Watch: schools D+, crime F, employment D-.
- Syracuse City School District (urban): math 18% / reading 26% proficiency, ranked #590 of 590 in NY (top 100%) — low school quality limits family demand, transient renter base, plan for 1-2y turnover; 74% free/reduced lunch — lower-income household profile, screen leases tightly.
- Market conditions: 99 active listings in the ZIP; 7 comparable units currently listed for rent nearby; rentals at typical pace (median 21d on market — plan ~3-4 weeks tenant-placement turnaround); 43% of comp listings sitting > 30 days — soft ceiling on asking rent; lower-income renter base — watch delinquency; 616 units permitted in Onondaga County in 2024 (256 in 5+ unit buildings).
- At $3,013/mo this rent would consume 81% of the median local household income ($45k/yr) (locally 1437% of renters already pay >50% of income on rent) — very limited rent-growth headroom before tenants either downsize or default.
Forward outlook
- In year one you build about $16k of equity ($1k loan paydown + $15k appreciation (10.0% local appreciation)).
- Onondaga County population projected to shrink 9% by 2050 — rents likely to lag national; underwrite the cash flow, not the appreciation.
- At projected returns (10.0% appreciation + 3.0% rent growth), your $42k cash investment doubles in ~2 years — after that, you're playing with house money.
- By year 3, paydown + projected appreciation supports a ~$41k cash-out refi (75% LTV) — recoverable capital for the next deal without selling this one.
Negotiation context
- It's been on market 26 days — a 2% lower offer ($148k) is reasonable based on typical stale-listing flexibility.
- 6 sale attempts since 14y ago with the ask held roughly flat each time — persistent listings suggest the price (not the market) is what's stuck; bring a comps-based counter.
Risks & watch-outs
- Watch-outs: built in 1890 — expect roof / HVAC / electrical / plumbing capex.
Questions for the listing agent
- Built in 1890 — when were the roof, HVAC, electrical panel, plumbing, and water heater last replaced?
- Is there a deadline driving the sale (1031 exchange, divorce, estate, relocation)? That informs how much negotiation room exists.
- Schools are D-rated, which usually means shorter tenancies and higher turnover. Who's the typical renter profile here, and what's been the actual vacancy rate?
- Crime grade is F in this area — have there been break-ins, vandalism, or insurance claims at this property in the last 3 years? What carrier currently insures it and at what premium?
- What's the average days-on-market for RENTAL listings here right now (not sales)? A rising rental-DOM trend means longer vacancies and softer asking-rent achievability than the comps imply.
- What's the recent tenant-quality profile in this submarket — average credit score on applications, eviction rate, late-payment / NSF rate, and stable-employment percentage? A property-management company in the area should have these aggregated.
- How much new apartment / multifamily construction is in the pipeline within 1–3 miles? Heavy new supply (>2% of stock underway) typically softens rents 12–24 months out; light construction supports rent growth.
Investment metrics
- 1% rule
- 2.01% ✓
- Cap rate
- 17.40%
- Cash-on-cash
- 39.66%
- DSCR
- 2.76
- GRM
- 4.1
CMA / ARV
- ARV (on-the-fly)
- $119,136
- Comps found
- 12
Show comp detail 12 sales within ~0.75 mi
| Address | Dist | Beds/Ba | Sqft | Sold | Price | $/sf | Match |
|---|---|---|---|---|---|---|---|
| 635 E Division St | 0.24mi | 4/2.0 (+1) | 2,376 (+2%) | 11mo | $110,000 | $46 | 68 |
| 501-503 Dewitt St | 0.58mi | 4/2.0 (+1) | 2,370 (+2%) | 2mo | $198,000 | $84 | 60 |
| 1215 Oak St #17 | 0.52mi | 4/2.0 (+1) | 2,482 (+6%) | 1mo | $218,200 | $88 | 56 |
| 1107 Butternut St | 0.11mi | 4/2.0 (+1) | 2,002 (-14%) | 9mo | $34,900 | $17 | 55 |
| 122 Josephine St | 0.31mi | 4/2.0 (+1) | 2,212 (-5%) | 16mo | $83,000 | $38 | 54 |
| 1021 N Townsend St | 0.44mi | 3/2.0 | 2,030 (-13%) | 6mo | $69,900 | $34 | 49 |
| 606 N Mcbride St | 0.64mi | 4/3.0 (+1) | 2,428 (+4%) | 15mo | $185,000 | $76 | 46 |
| 1004 Highland St #6 | 0.23mi | 4/2.0 (+1) | 2,034 (-13%) | 16mo | $84,000 | $41 | 46 |
| 317 E Division St | 0.46mi | 4/2.0 (+1) | 2,016 (-14%) | 2mo | $119,900 | $59 | 45 |
| 1412 N State St | 0.61mi | 4/2.0 (+1) | 2,168 (-7%) | 10mo | $70,000 | $32 | 42 |
| 313-315 Beecher St | 0.45mi | 4/2.0 (+1) | 2,132 (-9%) | 19mo | $109,000 | $51 | 40 |
| 608 Court St | 0.63mi | 4/2.0 (+1) | 2,016 (-14%) | 18mo | $149,000 | $74 | 24 |
Match score weights: distance 35% · size 25% · config 20% · recency 20%. Top-matched comps best support the ARV.
Projected returns pro-forma
10.0% appreciation · 3.0% rent growth · sell at horizon
- IRR
- 54.9%
- Equity multiple
- 5.05×
- Total profit
- $170,114
- Equity at exit
- $135,132
- IRR
- 48.5%
- Equity multiple
- 11.27×
- Total profit
- $431,476
- Equity at exit
- $291,417
Cash invested: $42,000 (down + closing). Projections, not guarantees.
Landlord ↔ Tenant lean methodology
- Overall (STATE)
- 15 Strongly Tenant-Friendly
- State New York
- 15 Strongly Tenant-Friendly · D+10
- County
- — inherits STATE
- City
- — inherits STATE
ZIP-level market 13208
- Home prices YoY
- 8.4%
- Active inventory
- 99
- Price-to-rent
- 8.3×
Monthly cashflow live
- Estimated rent
- $3,013 high interval (Pro) →
- Mortgage (P&I)
- −$787
- Tax from tax record
- −$143 /mo · $1,718/yr
- Insurance
- −$62
- HOA
- −$0
- Vacancy / Maint / Mgmt
- −$633
- Net cashflow
- $1,388
Break-even live
2-unit breakdown (identical units grouped — click to expand)
| Units | Beds | Baths | Est. rent |
|---|---|---|---|
| 2× units | 2 | 1 | $3,012 |
| #1 | 2 | 1 | $1,506 |
| #2 | 2 | 1 | $1,506 |
| Total (2 units) | $3,013 | ||
UW: 25.0% down · 7.5% · 30yr · 1.5% tax · 5.0% vac · 8.0% maint · 8.0% mgmt
Financing live
Cash to close
- Down payment
- $37,500
- Closing costs
- $4,500
- Reserves months
- —
- Total cash needed
- —
Loan-product check · same deal, 3 products live
Conventional
25% down · 7.5% · 30yr
- Down + closing
- —
- Monthly P&I
- —
- Monthly cashflow
- —
- DSCR
- —
- Eligible?
- —
Personal DTI + credit; lowest rate.
DSCR
20% down · 8.5% · 30yr
- Down + closing
- —
- Monthly P&I
- —
- Monthly cashflow
- —
- DSCR
- —
- Eligible?
- —
No personal income docs; deal must DSCR.
Hard money
10% down · 12.0% · 12mo
- Down + closing
- —
- Monthly P&I
- —
- Monthly cashflow
- —
- DSCR
- —
- Eligible?
- —
Short-term bridge; refi at stabilization.
Rent comps 7 comps
| Address | Beds | Baths | Sqft | Rent | $/sqft | DOM | Units | Dist |
|---|---|---|---|---|---|---|---|---|
| 214 1st North St Syracuse, NY | 2.0 | 1.0 | 2731 | $1,100 | $0.40 | 43d | 1 | 0.16mi |
| 712 Oak St Syracuse, NY | 3.0 | 1.0 | 2461 | $1,700 | $0.69 | 20d | 1 | 0.56mi |
| 210 W Division St Unit 3 Syracuse, NY | 2.0 | 2.0 | 2800 | $3,200 | $1.14 | 43d | 1 | 0.74mi |
| 244 Harding St #46 Syracuse, NY | 2.0 | 1.0 | 2200 | $1,395 | $0.63 | 43d | 1 | 1.02mi |
| 447 E Washington St Syracuse, NY | 3.0 | 1.5 | 2095 | $2,100 | $1.00 | 13d | 1 | 1.13mi |
| 319 S Salina St Syracuse, NY | 2.0 | 2.0 | 1860 | $2,000 | $1.08 | 20d | 1 | 1.27mi |
| 2340 Court St Syracuse, NY | 2.0 | 1.5 | 1965 | $2,200 | $1.12 | 13d | 1 | 1.30mi |
Listing history 23 events
-
2026-05-18status Pending
-
2026-04-24historical Active Under Contract
-
2026-04-21$150,000 Active
-
2025-07-14status Pending
-
2025-07-12$120,000 Active
-
2025-07-12historical
-
2025-05-31historical
-
2024-12-31$119,900 Active
-
2024-05-18historical
-
2023-11-18$134,900 Active
-
2022-03-08soldstatus $513,333
-
2017-08-01soldstatus $42,000
-
2017-07-11soldstatus $42,000 Closed Sale or Rented
-
2017-05-15status Pending Sale
-
2017-04-27historical Continue to Show- Under Contract
-
2017-03-17$49,900 Active
-
2013-02-19historical
-
2013-01-29soldstatus $40,000
-
2013-01-24soldstatus $47,500
-
2012-07-06$50,000
-
2007-07-13soldstatus $53,000
-
2006-04-19soldstatus $34,000
-
2006-03-28soldstatus $30,880
ⓘ Source: listings_history table (triggers on properties + properties_extension) + one-shot
backfill from property_details.listing_events for pre-trigger history.
Tax reassessment forecast NY · Partial reset (capped growth)
- Current annual tax
- $1,718 · $143/mo
- Projected year-2 tax
- $2,126 · $177/mo
- Expected delta
- +$409/yr (+$34/mo · 23.8%)
ⓘ Screening estimate from a state-policy table — verify with the county assessor before closing.
Climate risk First Street
- Flood 1/10 Low FEMA zone X (unshaded) · 0% chance over 30 yrs
- Wildfire 1/10 Low
- Heat 3/10 Moderate 7 d/yr ≥95°F today · 16 d/yr by 30 yrs out
- Wind 1/10 Low 0% chance of damaging wind over 30 yrs
- Air quality 2/10 Low 0 unhealthy d/yr today · 1 by 30 yrs out
Nearby sold comps map
Loading sold comps map…
Walkable amenities ~0.75 mi
Loading nearby amenities…
Taxation est. · year 1
- Rental income
- $36,156
- − Mortgage interest
- −$8,402
- − Property taxes
- −$1,718
- − Insurance
- −$750
- − Repairs & maintenance
- −$2,892
- − Management
- −$2,892
- − Depreciation
- −$4,364
- Taxable income
- $15,137
- Est. tax owed @ 24.0%
- −$3,633
- After-tax cash flow
- $13,023/yr
For passive investors: Depreciation is non-cash, so a rental often shows a tax loss while cash-flowing — sheltering income. Rental losses are passive: they offset passive income freely, and up to $25,000/yr can offset ordinary (W-2) income if you actively participate and your MAGI is under $100k (phasing out to $0 by $150k); unused losses carry forward. On sale, claimed depreciation is recaptured at up to 25%, and gains may owe capital-gains tax (a 1031 exchange can defer both). Figures are a year-1 estimate at your 24.0% rate — not tax advice; consult a CPA.
Schools (NCES district)
- District
- Syracuse City School District
- NCES district ID
- 3628590
- Math proficiency
- 18% ▼ -5.00%
- Reading proficiency
- 26% ▬ 0.00%
- Median HH income
- $32,097
- Composite
- 17.83/100
- National rank
- #9007
- State rank
- #590 of 590 in NY
Livability — Syracuse
- Score
- 77/100
- State rank
- #187
- US rank
- #2869
Category grades
Schools grade is shown separately in the Schools card above.
Census & demographics
- Census place
- Syracuse, NY
- County
- Onondaga County · 247,257 people
- City population
- 152,627
- Metro
- Syracuse, NY
- Population (ZIP)
- 22,993
- Household income
- $44,712
- Rent vs Own
- Severe rent burden
- 1437.0
Population outlook (Onondaga County) Hauer SSP2
- Today (2025)
- 467,894 people
- By 2030
- 463,381 · -1.0%
- By 2040
- 447,697 · -4.3%
- By 2050
- 426,399 · -8.9%
- By 2075
- 373,661 · -20.1%
- By 2100
- 307,967 · -34.2%
Race, ethnicity, and origin ACS 2023
- Neighborhood character
- Highly diverse neighborhood (Simpson 0.70)
- Race & ethnicity
- White 46% Black 24% Asian 14% Two or more races 10% Hispanic / Latino 6%
- Hispanic origin (detail)
- Puerto Rican 4% Dominican 1%
- Common ancestry
- Romanian 3% Swedish 3% Italian 1%
- Foreign-born
- 22% · Vietnam, Philippines, Canada
- Languages at home
- 70% English-only · Spanish 6% Other Asian/Pacific 5% Vietnamese 4%
Political lean MEDSL · Onondaga
- 2024 margin
- D (+17.3) · D 58.6% · R 41.4%
- 2008→2024 swing
- -3.0pp toward R · 2008: 20.3pp · 2024: 17.3pp
- All cycles
- 2024: D+17.3 2020: D+20.6 2016: D+12.8 2012: D+21.1 2008: D+20.3
Not yet ingested
- Civics
- —
Market trends
- HPI YoY
- ▲ 30.91%
- Current HPI
- 399.3284
- Rent YoY
- —
- Metro
- Syracuse, NY
- State GDP YoY
- ▲ 2.60%
- F500 in state
- 92
Industry mix (Fortune 500 HQ in NY)
| Industry | F500 HQs | Revenue |
|---|---|---|
| Financial Services | 10 | $950B |
|
||
| Consumer Goods | 9 | $162B |
|
||
| Insurance | 4 | $225B |
|
||
| Telecommunications | 2 | $144B |
|
||
| Pharmaceuticals | 2 | $112B |
|
||
| Media / Entertainment | 2 | $69B |
|
||
Price history
+385.8% since first listed23 events — show timeline
- 2026-05-18 Pending — CNYIS
- 2026-04-24 Contingent — CNYIS
- 2026-04-21 Listed $150,000 CNYIS
- 2025-07-14 Pending — CNYIS
- 2025-07-12 Listing Removed — CNYIS
- 2025-07-12 Listed $120,000 CNYIS
- 2025-05-31 Listing Removed — CNYIS
- 2024-12-31 Listed $119,900 CNYIS
- 2024-05-18 Listing Removed — CNYIS
- 2023-11-18 Listed $134,900 CNYIS
- 2022-03-08 Sold (Public Records) $513,333 Public Records
- 2017-08-01 Sold (Public Records) $42,000 Public Records
- 2017-07-11 Sold (MLS) $42,000 CNYIS
- 2017-05-15 Pending — CNYIS
- 2017-04-27 Contingent — CNYIS
- 2017-03-17 Listed $49,900 CNYIS
- 2013-02-19 Listing Removed — CNYIS
- 2013-01-29 Sold (MLS) $40,000 CNYIS
- 2013-01-24 Sold (Public Records) $47,500 Public Records
- 2012-07-06 Listed $50,000 CNYIS
- 2007-07-13 Sold (Public Records) $53,000 Public Records
- 2006-04-19 Sold (Public Records) $34,000 Public Records
- 2006-03-28 Sold (Public Records) $30,880 Public Records
Property tax history
-0.5%/yrLatest (2025): $1,718 · +0.0% YoY. Source: county tax records.
Cash-flow waterfall
monthlySold comps — $/sqft
last 12 mo · ≤1 miLoading sold comps…