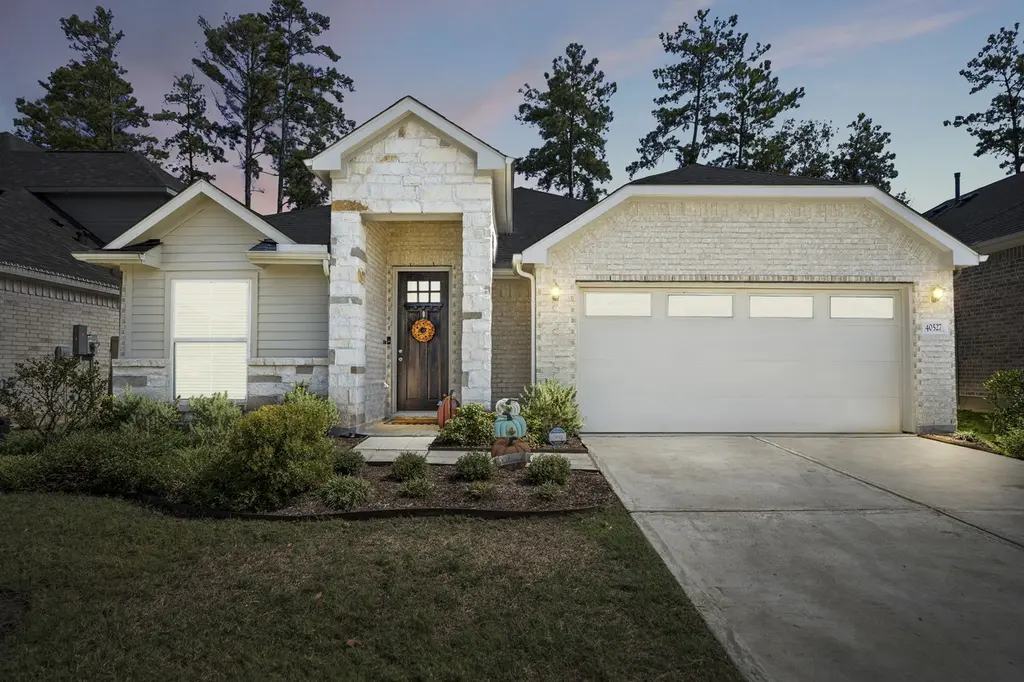
40527 Goldeneye Pl · Pinehurst, TX
Flood risk 6/10 · Moderate
- FEMA flood zone
- X (unshaded)
- Chance of flooding over 30 yrs
- 0.74%
- Est. flood insurance / yr
- $507 – $1,088
Fire risk 4/10 · Minor
- Est. fire insurance / yr
- $1,222 – $2,270
Heat risk 8/10 · Major
- Hot days now (above 111°F)
- 7 days/yr
- Hot days in 30 yrs
- 23 days/yr
Wind risk 8/10 · Major
- Chance of severe wind over 30 yrs
- 99.0%
Air-quality risk 2/10 · Minimal
- Unhealthy air days now
- 2 days/yr
- Unhealthy air days in 30 yrs
- 2 days/yr
Risk factors via First Street. Map © Google.
Why this score? — see what drove the C- grade
The composite is a weighted blend of 9 inputs, each scored 0–100. Each bar is that input's sub-score; the figure is the points it added to the 100-point composite (weight × sub-score).
- ARV discount +14.5/15.0
- Appreciation +10.0/10.0
- Cash flow +7.6/30.0
- Schools +3.9/10.0
- Condition / age +3.8/5.0
- 1% rule +3.5/10.0
- Livability +2.8/5.0
- Rent growth +2.6/5.0
- DSCR +1.7/10.0
$270,000
🖨 Deal sheet 📄 Offer letter ✓ Due diligence
Listing remarks MLS
Welcome to the Audubon community's finest! This 3-bedroom, 2-bathroom home, complete with an office, is a true gem. The kitchen boasts a custom butcher block island and a built-in beverage refrigerator, perfect for your entertaining needs. Throughout the home, you will discover numerous upgrades, from elegant custom light fixtures to the convenience of a sprinkler system. The designated office space offers a quiet and productive area to work from home. Step outside to your backyard oasis, with direct gated access to a serene walking trail – the perfect escape for outdoor enthusiasts. And here's the cherry on top: the HOA takes care of front yard grass cutting and shrub maintenance, ensuring hassle-free living. Audubon, a masterplanned community, is conveniently located near shopping, dining, entertainment and A-Rated Audubon Elementary School. Look no further and make this your new place to call home!
Key facts
- Direct gated access
- Backyard oasis
- Serene walking trail
Tags
Neighborhood map
What this means for you Summary
Snapshot
- This is a 3-bed/2.0-bath single-family listed at $270k. Condition is rated good.
Deal economics
- At list price, monthly cash flow is $-321 ($-4k/yr) — negative.
- To cash-flow at today's rent, offer at most $213k (21.0% below list).
- To meet the 1% rule (rent ≥ 1% of price), the offer needs to be $229k (15.1% below list).
- Recommended offer: $213k (21.0% below list) — sets the bar for cash-flow.
- Cap rate 4.9% vs local median 2.0% in Pinehurst — top-decile yield for the area; either an underpriced asset or a hidden risk that comps aren't pricing in. Stress-test before assuming the spread holds.
Location & tenants
- Location reads 55/100 on livability (#1,350 in TX) — a working-class tenant base; expect higher turnover. Strengths: cost of living A+, housing B+; Watch: employment C-, schools F, crime D-.
- Magnolia ISD (rural): math 42% / reading 45% proficiency, ranked #247 of 826 in TX (top 30%) — families likely to look elsewhere, expect single-tenant / working-renter base with shorter leases.
- Market conditions: Rents flat; 1604 active listings in the ZIP; 7 comparable units currently listed for rent nearby; rentals lingering (median 44d on market — plan ~5-8 weeks vacancy on turnover, expect pricing pressure); 57% of comp listings sitting > 30 days — soft ceiling on asking rent; high-income renter base; 13,259 units permitted in Montgomery County in 2024 (1,402 in 5+ unit buildings).
Forward outlook
- In year one you build about $29k of equity ($2k loan paydown + $27k appreciation (10.0% local appreciation)).
- Montgomery County population projected at +65% by 2050 — long-run rental-demand tailwind backs the buy-and-hold thesis.
- By year 2, paydown + projected appreciation supports a ~$46k cash-out refi (75% LTV) — recoverable capital for the next deal without selling this one.
Negotiation context
- It's been on market 63 days — a 6% lower offer ($254k) is reasonable based on typical stale-listing flexibility.
- 8 sale attempts since 5y ago with the ask held roughly flat each time — persistent listings suggest the price (not the market) is what's stuck; bring a comps-based counter.
Risks & watch-outs
- Climate carrying-cost: major flood risk; severe wind risk, 99% chance of damaging wind over 30y; extreme-heat days projected 7→23/yr by 2055 (HVAC capex compounding) — expect insurance premiums to compound above CPI over the hold.
Questions for the listing agent
- What do current leases actually rent for vs. the listed asking? Can we see a recent rent roll and the last 12 months of T-12 income?
- It's been on market 63 days. Have you received any prior offers? Is the seller open to a 21% concession, seller financing, or rate buy-down credit?
- What does the HOA fee cover, when was the last increase, and are there any pending special assessments or reserve-fund shortfalls?
- Why hasn't it sold? Are there any deal-killer items the seller is aware of (foundation, flood, title, zoning, code violations)?
- Is there a deadline driving the sale (1031 exchange, divorce, estate, relocation)? That informs how much negotiation room exists.
- Schools are F-rated, which usually means shorter tenancies and higher turnover. Who's the typical renter profile here, and what's been the actual vacancy rate?
- Crime grade is D in this area — have there been break-ins, vandalism, or insurance claims at this property in the last 3 years? What carrier currently insures it and at what premium?
- What's the average days-on-market for RENTAL listings here right now (not sales)? A rising rental-DOM trend means longer vacancies and softer asking-rent achievability than the comps imply.
- What's the recent tenant-quality profile in this submarket — average credit score on applications, eviction rate, late-payment / NSF rate, and stable-employment percentage? A property-management company in the area should have these aggregated.
- How much new for-sale + rental construction is in the pipeline within 1–3 miles? Heavy new supply typically softens prices + rents 12–24 months out; constrained supply supports both.
Investment metrics
- 1% rule
- 0.85% ✗
- Cap rate
- 4.87%
- Cash-on-cash
- -5.10%
- DSCR
- 0.77
- GRM
- 9.8
CMA / ARV
- ARV (median comp)
- $319,608
- List price
- $270,000
- Delta
- -15.52%
- Verdict
- UNDERPRICED
- Comps
- 20 within 1.0 mi
Show comp detail 12 sales within ~0.75 mi
| Address | Dist | Beds/Ba | Sqft | Sold | Price | $/sf | Match |
|---|---|---|---|---|---|---|---|
| 40443 Gerygone Ln | 0.23mi | 3/2.0 | 1,614 (-6%) | 5mo | $304,900 | $189 | 74 |
| 40431 Gerygone Ln | 0.21mi | 3/2.0 | 1,614 (-6%) | 10mo | $279,900 | $173 | 71 |
| 40511 Tyto Ln | 0.17mi | 3/2.0 | 1,492 (-14%) | 0mo | $235,000 | $158 | 70 |
| 40710 Barley Straw Dr | 0.45mi | 4/2.0 (+1) | 1,750 (+1%) | 2mo | $286,490 | $164 | 70 |
| 15122 Rose Willow Ln | 0.45mi | 3/2.0 | 1,575 (-9%) | 2mo | $279,990 | $178 | 63 |
| 14878 Whistling Duck Ln | 0.44mi | 3/2.0 | 1,950 (+13%) | 11mo | $416,900 | $214 | 49 |
| 40731 Barley Straw | 0.45mi | 4/2.0 (+1) | 1,476 (-14%) | 2mo | $264,990 | $180 | 48 |
| 40504 Warialda Trace Ln | 0.70mi | 4/2.0 (+1) | 1,820 (+6%) | 6mo | $245,000 | $135 | 48 |
| 14826 Whistling Duck Ln | 0.50mi | 3/2.0 | 1,950 (+13%) | 9mo | $419,900 | $215 | 48 |
| 14898 Whistling Duck Ln | 0.42mi | 4/3.0 (+1) | 1,942 (+13%) | 5mo | $369,900 | $190 | 46 |
| 14882 Whistling Duck Ln | 0.43mi | 4/3.0 (+1) | 1,942 (+13%) | 8mo | $460,900 | $237 | 43 |
| 14727 Band Tailed Pigeon Ct | 0.45mi | 4/3.0 (+1) | 1,942 (+13%) | 8mo | $340,900 | $176 | 42 |
Match score weights: distance 35% · size 25% · config 20% · recency 20%. Top-matched comps best support the ARV.
Projected returns pro-forma
10.0% appreciation · 0.32% rent growth · sell at horizon
- IRR
- 19.8%
- Equity multiple
- 2.60×
- Total profit
- $120,778
- Equity at exit
- $243,237
- IRR
- 17.6%
- Equity multiple
- 5.78×
- Total profit
- $361,212
- Equity at exit
- $524,551
Cash invested: $75,600 (down + closing). Projections, not guarantees.
Landlord ↔ Tenant lean methodology
- Overall (STATE)
- 87 Strongly Landlord-Friendly
- State Texas
- 87 Strongly Landlord-Friendly · R+5
- County
- — inherits STATE
- City
- — inherits STATE
ZIP-level market 77354
- Home prices YoY
- 2.4%
- Rents YoY
- 0.3%
- Active inventory
- 1604
- Price-to-rent
- 9.8×
Monthly cashflow live
- Estimated rent
- $2,294 high interval (Pro) →
- Mortgage (P&I)
- −$1,416
- Tax from tax record
- −$451 /mo · $5,407/yr
- Insurance
- −$112
- HOA
- −$154
- Vacancy / Maint / Mgmt
- −$482
- Net cashflow
- $-321
Break-even live
UW: 25.0% down · 7.5% · 30yr · 1.5% tax · 5.0% vac · 8.0% maint · 8.0% mgmt
Financing live
Cash to close
- Down payment
- $67,500
- Closing costs
- $8,100
- Reserves months
- —
- Total cash needed
- —
Loan-product check · same deal, 3 products live
Conventional
25% down · 7.5% · 30yr
- Down + closing
- —
- Monthly P&I
- —
- Monthly cashflow
- —
- DSCR
- —
- Eligible?
- —
Personal DTI + credit; lowest rate.
DSCR
20% down · 8.5% · 30yr
- Down + closing
- —
- Monthly P&I
- —
- Monthly cashflow
- —
- DSCR
- —
- Eligible?
- —
No personal income docs; deal must DSCR.
Hard money
10% down · 12.0% · 12mo
- Down + closing
- —
- Monthly P&I
- —
- Monthly cashflow
- —
- DSCR
- —
- Eligible?
- —
Short-term bridge; refi at stabilization.
Rent comps 7 comps
| Address | Beds | Baths | Sqft | Rent | $/sqft | DOM | Units | Dist |
|---|---|---|---|---|---|---|---|---|
| 40547 Berylline Ln Magnolia, TX | 4.0 | 2.0 | 1753 | $2,300 | $1.31 | 44d | 1 | 0.08mi |
| 40558 Berylline Ln Unit NA Magnolia, TX | 3.0 | 2.0 | 1499 | $2,150 | $1.43 | 24d | 1 | 0.11mi |
| 39899 Mill Creek Rd Magnolia, TX | 1.0–3.0 | 1.0–2.0 | 1104 | $2,726 | $2.47 | 1d | 40 | 0.17mi |
| 14727 Band Tailed Pigeon Ct Magnolia, TX | 4.0 | 3.0 | 1942 | $2,700 | $1.39 | 44d | 1 | 0.44mi |
| 14983 Clay Harvest Rdg Magnolia, TX | 4.0 | 3.0 | 2173 | $2,375 | $1.09 | 44d | 1 | 0.96mi |
| 40839 Hawthorne Glades St Magnolia, TX | 3.0 | 2.0 | 1156 | $2,100 | $1.82 | 44d | 1 | 1.27mi |
| 948 Oak Mist Ln Magnolia, TX | 3.0 | 2.0 | 1470 | $2,000 | $1.36 | 24d | 1 | 1.38mi |
HOA detail
- Monthly dues
- $154 · $1,848/yr
- Likely covers
- security
Listing history 30 events
-
2026-06-08days on market $270,000 Pending 63 DOM
-
2026-06-07days on market $270,000 Pending 62 DOM
-
2026-06-04statusdays on market $270,000 Pending 59 DOM
-
2026-06-03days on market $270,000 Active 58 DOM
-
2026-06-02days on market $270,000 Active 57 DOM
-
2026-06-01days on market $270,000 Active 56 DOM
-
2026-05-31days on market $270,000 Active 55 DOM
-
2026-04-06$270,000 Active 920-char remark
Show marketing remark (920 chars)
Welcome to the Audubon community's finest! This 3-bedroom, 2-bathroom home, complete with an office, is a true gem. The kitchen boasts a custom butcher block island and a built-in beverage refrigerator, perfect for your entertaining needs. Throughout the home, you will discover numerous upgrades, from elegant custom light fixtures to the convenience of a sprinkler system. The designated office space offers a quiet and productive area to work from home. Step outside to your backyard oasis, with direct gated access to a serene walking trail – the perfect escape for outdoor enthusiasts. And here's the cherry on top: the HOA takes care of front yard grass cutting and shrub maintenance, ensuring hassle-free living. Audubon, a masterplanned community, is conveniently located near shopping, dining, entertainment and A-Rated Audubon Elementary School. Look no further and make this your new place to call home!
-
2026-03-31historical $2,300
-
2026-03-30historical
-
2026-02-01status Active
-
2026-01-31historical
-
2026-01-11price $2,300
-
2026-01-10price $289,000
-
2025-11-21price $299,000
-
2025-11-01$2,350
-
2025-10-30$315,000 Active
-
2023-11-14historical
-
2023-11-01price $283,000
-
2023-11-01status Active
-
2023-10-27status Option Pending
-
2023-10-20price $289,000
-
2023-10-12historical $2,200
-
2023-09-28$2,200
-
2023-09-20$298,000 Active
-
2021-10-15soldstatus Sold
-
2021-08-16status Pending
-
2021-06-07price $279,990
-
2021-05-07price $275,990
-
2021-05-07$283,628 Active
ⓘ Source: listings_history table (triggers on properties + properties_extension) + one-shot
backfill from property_details.listing_events for pre-trigger history.
Tax reassessment forecast TX · Resets to sale price
- Current annual tax
- $5,407 · $451/mo
- Projected year-2 tax
- $5,407 · $451/mo
- Expected delta
- $0/yr ($0/mo · 0.0%)
ⓘ Screening estimate from a state-policy table — verify with the county assessor before closing.
Climate risk First Street
- Flood 6/10 Major FEMA zone X (unshaded) · 74% chance over 30 yrs
- Wildfire 4/10 Moderate
- Heat 8/10 Severe 7 d/yr ≥111°F today · 23 d/yr by 30 yrs out
- Wind 8/10 Severe 99% chance of damaging wind over 30 yrs
- Air quality 2/10 Low 2 unhealthy d/yr today · 2 by 30 yrs out
Nearby sold comps map
Loading sold comps map…
Walkable amenities ~0.75 mi
Loading nearby amenities…
Taxation est. · year 1
- Rental income
- $27,523
- − Mortgage interest
- −$15,124
- − Property taxes
- −$5,407
- − Insurance
- −$1,350
- − Repairs & maintenance
- −$2,202
- − Management
- −$2,202
- − HOA
- −$1,848
- − Depreciation
- −$7,855
- Taxable loss
- −$8,464
- Est. tax savings @ 24.0%
- +$2,031
- After-tax cash flow
- $-1,821/yr
For passive investors: Depreciation is non-cash, so a rental often shows a tax loss while cash-flowing — sheltering income. Rental losses are passive: they offset passive income freely, and up to $25,000/yr can offset ordinary (W-2) income if you actively participate and your MAGI is under $100k (phasing out to $0 by $150k); unused losses carry forward. On sale, claimed depreciation is recaptured at up to 25%, and gains may owe capital-gains tax (a 1031 exchange can defer both). Figures are a year-1 estimate at your 24.0% rate — not tax advice; consult a CPA.
Condition & rehab AI · 1 photo
This well-maintained single-family home in Pinehurst, TX, offers a good condition with cosmetic updates needed for a fresh look and increased value.
Value-add opportunities
- Both Painting exterior and interior walls — Enhances curb appeal and interior aesthetics.
- Both Landscaping improvements — Enhances curb appeal and outdoor living space.
- Rental HVAC maintenance — Ensures comfort and energy efficiency for tenants.
Renovation cost estimate screening
Value-add ROI direction
- Both Painting exterior and interior walls — Enhances curb appeal and interior aesthetics. ↑
- Both Landscaping improvements — Enhances curb appeal and outdoor living space. ↑
- Rental HVAC maintenance — Ensures comfort and energy efficiency for tenants. ↑
ⓘ Cost ranges are severity-bucket heuristics (US national rule-of-thumb). Get contractor quotes + a written scope before underwriting a rehab budget.
Schools (NCES district)
- District
- Magnolia ISD
- NCES district ID
- 4828740
- Math proficiency
- 42% ▼ -7.00%
- Reading proficiency
- 45% ▼ -4.00%
- Median HH income
- $71,692
- Composite
- 39.46/100
- National rank
- #3958
- State rank
- #247 of 826 in TX
Livability — Pinehurst
- Score
- 55/100
- State rank
- #1350
- US rank
- #23272
Category grades
Schools grade is shown separately in the Schools card above.
Census & demographics
- County
- Montgomery County · 663,713 people
- Metro
- Houston-The Woodlands-Sugar Land, TX
- Population (ZIP)
- 44,900
- Household income
- $112,504
- Rent vs Own
- Severe rent burden
- 586.0
Population outlook (Montgomery County) Hauer SSP2
- Today (2025)
- 713,896 people
- By 2030
- 805,263 · +12.8%
- By 2040
- 992,708 · +39.1%
- By 2050
- 1,179,590 · +65.2%
- By 2075
- 1,628,084 · +128.1%
- By 2100
- 1,937,880 · +171.5%
Race, ethnicity, and origin ACS 2023
- Neighborhood character
- Predominantly White (66%)
- Race & ethnicity
- White 66% Hispanic / Latino 25% Two or more races 18% Black 3% Asian 1%
- Hispanic origin (detail)
- Mexican 14% Puerto Rican 1%
- Common ancestry
- Lithuanian 4% Slovak 2% Italian 2%
- Foreign-born
- 11% · Canada, Vietnam
- Languages at home
- 83% English-only · Spanish 15% Other Indo-European 1% German/W. Germanic 1%
Political lean MEDSL · Montgomery
- 2024 margin
- Solid R (+45.5) · D 26.8% · R 72.3%
- 2008→2024 swing
- +7.2pp toward D · 2008: -52.7pp · 2024: -45.5pp
- All cycles
- 2024: R+45.5 2020: R+43.8 2016: R+51.4 2012: R+60.7 2008: R+52.7
Not yet ingested
- Civics
- —
Market trends
- HPI YoY
- ▲ 12.09%
- Current HPI
- 512.87
- Rent YoY
- ▲ 0.32%
- Metro
- Houston-The Woodlands-Sugar Land, TX
- State GDP YoY
- ▲ 3.95%
- F500 in state
- 110
Industry mix (Fortune 500 HQ in TX)
| Industry | F500 HQs | Revenue |
|---|---|---|
| Energy | 16 | $1,198B |
|
||
| Technology | 5 | $198B |
|
||
| Engineering / Construction | 4 | $72B |
|
||
| Energy Services | 3 | $60B |
|
||
| Utilities | 3 | $41B |
|
||
| Healthcare | 2 | $330B |
|
||
Price history
-4.8% since first listed23 events — show timeline
- 2026-04-06 Listed $270,000 HARMLS
- 2026-03-31 Rental Removed $2,300 HARMLS
- 2026-03-30 Listing Removed — HARMLS
- 2026-02-01 Relisted — HARMLS
- 2026-01-31 Listing Removed — HARMLS
- 2026-01-11 Price Changed $2,300 HARMLS
- 2026-01-10 Price Changed $289,000 HARMLS
- 2025-11-21 Price Changed $299,000 HARMLS
- 2025-11-01 Listed for Rent $2,350 HARMLS
- 2025-10-30 Listed $315,000 HARMLS
- 2023-11-14 Listing Removed — HARMLS
- 2023-11-01 Price Changed $283,000 HARMLS
- 2023-11-01 Relisted — HARMLS
- 2023-10-27 Pending — HARMLS
- 2023-10-20 Price Changed $289,000 HARMLS
- 2023-10-12 Rental Removed $2,200 HARMLS
- 2023-09-28 Listed for Rent $2,200 HARMLS
- 2023-09-20 Listed $298,000 HARMLS
- 2021-10-15 Sold (MLS) — HARMLS
- 2021-08-16 Pending — HARMLS
- 2021-06-07 Price Changed $279,990 HARMLS
- 2021-05-07 Price Changed $275,990 HARMLS
- 2021-05-07 Listed $283,628 HARMLS
Property tax history
+78.0%/yrLatest (2025): $5,407 · +0.9% YoY. Source: county tax records.
Cash-flow waterfall
monthlySold comps — $/sqft
last 12 mo · ≤1 miLoading sold comps…