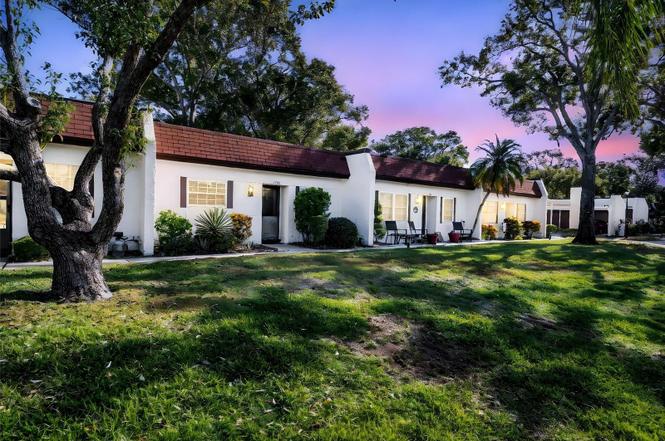
3109 Mission Grove Dr Unit D · Palm Harbor, FL
Flood risk 1/10 · Minimal
- FEMA flood zone
- X (unshaded)
- Chance of flooding over 30 yrs
- 0.0%
- Est. flood insurance / yr
- $507 – $1,088
Fire risk 1/10 · Minimal
- Est. fire insurance / yr
- $947 – $1,759
Heat risk 10/10 · Severe
- Hot days now (above 108°F)
- 7 days/yr
- Hot days in 30 yrs
- 26 days/yr
Wind risk 10/10 · Severe
- Chance of severe wind over 30 yrs
- 99.0%
Air-quality risk 3/10 · Minor
- Unhealthy air days now
- 2 days/yr
- Unhealthy air days in 30 yrs
- 2 days/yr
Risk factors via First Street. Map © Google.
Why this score? — see what drove the D grade
The composite is a weighted blend of 9 inputs, each scored 0–100. Each bar is that input's sub-score; the figure is the points it added to the 100-point composite (weight × sub-score).
- 1% rule +10.0/10.0
- Cash flow +8.9/30.0
- ARV discount +7.5/15.0
- Schools +4.3/10.0
- Livability +4.0/5.0
- DSCR +2.5/10.0
- Condition / age +2.5/5.0
- Rent growth +1.2/5.0
- Appreciation +0.0/10.0
$118,500
🖨 Deal sheet 📄 Offer letter ✓ Due diligence
Listing remarks
Bright & Open 2-Bedroom Villa in a Highly Desirable 55+ Active Community Welcome to this light-filled 2 bedroom, 2 full bath villa offering an inviting open floor plan and easy-maintenance tile flooring throughout. Enjoy peaceful mornings and relaxing evenings in the enclosed lanai overlooking a beautifully landscaped green space. From the front of the home—and the front bedroom—you’ll appreciate serene pond views that enhance the home’s tranquil setting. Convenience is built in with a private carport and an attached storage closet, providing extra space for bikes, beach gear, tools, and more. Located in a sought-after 55+ active community, this villa includes
Key facts
- Serene pond views
- Open floor plan
- Private carport
Tags
Property features AI
Finance
- Other: Directions available; Unit is unfurnished; Floor number: 1
- Financial info: Monthly condo fee: $614; Total monthly fees reported: $778; Total annual fees reported: $9,336; Lease restrictions apply
- HOA & community: HOA required (Frankly Coastal - Jean Chadwick); Monthly HOA fee: $164 (includes cable TV, internet, management, maintenance of structure and grounds, pest control, pool and recreational facilities, sewer, trash, water, common area taxes, escrow reserves); Community pool, clubhouse, tennis courts, shuffleboard, sidewalks; Buyer/association approval required; Senior community; No pets allowed
Exterior
- Parking: Assigned covered parking; Carport (1 space); Golf cart parking; Guest parking; Reserved parking; Ground-level parking; Other parking spaces
- Utilities: Public water; Public sewer; Electricity connected; Cable connected; Sewer connected; Water connected
- Home design: Residential condominium; One story; South-facing; Completed condition
- Construction: Block and stucco construction; Shingle roof; Slab foundation; Building contains storage
- Exterior features: Front porch; Rear porch; Outdoor lighting; Sidewalks; Storage
Interior
- Kitchen: Dishwasher; Range; Microwave; Refrigerator; Electric water heater
- Bedrooms: 2 bedrooms
- Flooring: Tile
- Bathrooms: 2 full bathrooms
- Heating & cooling: Central heating (electric); Central air conditioning
- Interior features: Open floorplan; Living room/dining room combo; Split bedroom layout; Programmable thermostat
- Laundry & utility: Washer hookup inside; Electric dryer hookup
Neighborhood map
What this means for you Summary
Snapshot
- This is a 2-bed/2.0-bath condo listed at $118k.
Deal economics
- At list price, monthly cash flow is $-96 ($-1k/yr) — negative.
- To cash-flow at today's rent, offer at most $105k (11.7% below list).
- Meets the 1% rule at list price ($2k rent vs $118k).
- Recommended offer: $104k (12.0% below list) — sets the bar for market timing.
- Cap rate 5.3% vs local median 3.1% in Palm Harbor — top-decile yield for the area; either an underpriced asset or a hidden risk that comps aren't pricing in. Stress-test before assuming the spread holds.
Location & tenants
- Location reads 81/100 on livability (#95 in FL, #1,470 nationally) — a professional / high-income tenant draw. Strengths: schools A+, housing A+, commute A; Watch: amenities F.
- Pinellas (suburban): math 51% / reading 51% proficiency, ranked #31 of 73 in FL (top 42%) — acceptable for families but not a draw, mixed tenant base, ~2y average lease.
- Market conditions: Rents falling (-5.2%/yr); 371 active listings in the ZIP; 19 comparable units currently listed for rent nearby; rentals at typical pace (median 18d on market — plan ~3-4 weeks tenant-placement turnaround); 2,676 units permitted in Pinellas County in 2024 (1,422 in 5+ unit buildings).
- This rent runs 32% of the median local income ($72k/yr) — at the standard rent-burdened threshold; future hikes will face affordability resistance.
Forward outlook
- Local home prices are declining (-3.0%/yr); year-one equity from $819 of loan paydown is wiped out by about $4k of value loss. Plan a longer hold.
- Pinellas County population projected at +14% by 2050 — modest demand growth; plan on rents tracking national, not racing it.
Negotiation context
- It's been on market 215 days — a 12% lower offer ($104k) is reasonable based on typical stale-listing flexibility.
- 2 sale attempts; this cycle's ask has dropped $40k (25%) from the opening price — seller is motivated, your offer sets the floor, not the list.
Risks & watch-outs
- Watch-outs: HOA is 41% of rent.
- Climate carrying-cost: severe wind risk, 99% chance of damaging wind over 30y; extreme-heat days projected 7→26/yr by 2055 (HVAC capex compounding) — expect insurance premiums to compound above CPI over the hold.
Questions for the listing agent
- What do current leases actually rent for vs. the listed asking? Can we see a recent rent roll and the last 12 months of T-12 income?
- It's been on market 215 days. Have you received any prior offers? Is the seller open to a 12% concession, seller financing, or rate buy-down credit?
- Built in 1976 — when were the roof, HVAC, electrical panel, plumbing, and water heater last replaced?
- What does the HOA fee cover, when was the last increase, and are there any pending special assessments or reserve-fund shortfalls?
- Any open or pending special assessments — roof, HVAC, plumbing, elevator, façade? What's the per-unit balance and payoff schedule, and is the seller paying it off at close or rolling it to the buyer?
- Why hasn't it sold? Are there any deal-killer items the seller is aware of (foundation, flood, title, zoning, code violations)?
- Is there a deadline driving the sale (1031 exchange, divorce, estate, relocation)? That informs how much negotiation room exists.
- Schools are A-rated — typically a magnet for longer-tenancy family renters. What's the average tenant stay here, and is there a school-zone premium baked into asking?
- The area grade is low — what's the realistic commute time and amenity access for the typical tenant pool here? Any planned neighborhood developments (good or bad) we should know about?
- What's the average days-on-market for RENTAL listings here right now (not sales)? A rising rental-DOM trend means longer vacancies and softer asking-rent achievability than the comps imply.
- What's the recent tenant-quality profile in this submarket — average credit score on applications, eviction rate, late-payment / NSF rate, and stable-employment percentage? A property-management company in the area should have these aggregated.
- How much new apartment / multifamily construction is in the pipeline within 1–3 miles? Heavy new supply (>2% of stock underway) typically softens rents 12–24 months out; light construction supports rent growth.
Investment metrics
- 1% rule
- 1.60% ✓
- Cap rate
- 5.32%
- Cash-on-cash
- -3.46%
- DSCR
- 0.85
- GRM
- 5.2
CMA / ARV
No comps found within radius.
Projected returns pro-forma
-3.0% appreciation · 0.0% rent growth · sell at horizon
- IRR
- -28.9%
- Equity multiple
- 0.08×
- Total profit
- $-30,363
- Equity at exit
- $17,669
- IRR
- -79.4%
- Equity multiple
- -0.62×
- Total profit
- $-53,755
- Equity at exit
- $10,246
Cash invested: $33,180 (down + closing). Projections, not guarantees.
Landlord ↔ Tenant lean methodology
- Overall (STATE)
- 87 Strongly Landlord-Friendly
- State Florida
- 87 Strongly Landlord-Friendly · R+3
- County
- — inherits STATE
- City
- — inherits STATE
ZIP-level market 34684
- Rents YoY
- -5.2%
- Active inventory
- 371
- Price-to-rent
- 5.2×
Monthly cashflow live
- Estimated rent
- $1,900 high interval (Pro) →
- Mortgage (P&I)
- −$621
- Tax est. 1.5%
- −$148 /mo · $1,778/yr
- Insurance
- −$49
- HOA
- −$778
- Vacancy / Maint / Mgmt
- −$399
- Net cashflow
- $-96
Break-even live
UW: 25.0% down · 7.5% · 30yr · 1.5% tax · 5.0% vac · 8.0% maint · 8.0% mgmt
Financing live
Cash to close
- Down payment
- $29,625
- Closing costs
- $3,555
- Reserves months
- —
- Total cash needed
- —
Loan-product check · same deal, 3 products live
Conventional
25% down · 7.5% · 30yr
- Down + closing
- —
- Monthly P&I
- —
- Monthly cashflow
- —
- DSCR
- —
- Eligible?
- —
Personal DTI + credit; lowest rate.
DSCR
20% down · 8.5% · 30yr
- Down + closing
- —
- Monthly P&I
- —
- Monthly cashflow
- —
- DSCR
- —
- Eligible?
- —
No personal income docs; deal must DSCR.
Hard money
10% down · 12.0% · 12mo
- Down + closing
- —
- Monthly P&I
- —
- Monthly cashflow
- —
- DSCR
- —
- Eligible?
- —
Short-term bridge; refi at stabilization.
Rent comps 19 comps
| Address | Beds | Baths | Sqft | Rent | $/sqft | DOM | Units | Dist |
|---|---|---|---|---|---|---|---|---|
| 2833 Orange Tree Cir N Unit C Palm Harbor, FL | 2.0 | 2.0 | 960 | $1,845 | $1.92 | 24d | 1 | 0.37mi |
| 2700 Nebraska Ave Unit 4-106 Palm Harbor, FL | 1.0 | 1.0 | 730 | $1,400 | $1.92 | 24d | 1 | 0.52mi |
| 2690 Coral Landings Blvd Palm Harbor, FL | 2.0–3.0 | 2.0 | 1135 | $1,700 | $1.50 | 11d | 2 | 0.66mi |
| 3462 Maclaren Dr Palm Harbor, FL | 2.0 | 2.0 | 1076 | $2,150 | $2.00 | 7d | 1 | 0.68mi |
| 2575 Pine Ridge Way S Unit A2 Palm Harbor, FL | 2.0 | 2.0 | 1104 | $1,590 | $1.44 | 24d | 1 | 0.68mi |
| 2523 Pine Ridge Way S Unit C2 Palm Harbor, FL | 2.0 | 2.0 | 1038 | $1,750 | $1.69 | 24d | 1 | 0.70mi |
| 2803 Northcote Dr Palm Harbor, FL | 3.0 | 2.0 | 1050 | $2,300 | $2.19 | 21d | 1 | 1.17mi |
| 212 Katherine Blvd Palm Harbor, FL | 1.0–4.0 | 1.0–2.5 | 1164 | $1,775 | $1.52 | 1d | 15 | 1.24mi |
| 3975 Country Place Ln Palm Harbor, FL | 1.0–2.0 | 1.0–2.0 | 788 | $1,637 | $2.08 | 1d | 16 | 1.27mi |
| 2764 Kavalier Dr Palm Harbor, FL | 3.0 | 2.0 | 1088 | $2,300 | $2.11 | 17d | 1 | 1.27mi |
| 2764 Kavalier Dr Palm Harbor, FL | 3.0 | 2.0 | 1088 | $2,300 | $2.11 | 14d | 1 | 1.27mi |
| 2764 Kavalier Dr Palm Harbor, FL | 3.0 | 2.0 | 1088 | $2,300 | $2.11 | 24d | 1 | 1.27mi |
| 3781 Lake Shore Dr Palm Harbor, FL | 3.0 | 2.0 | 1055 | $2,500 | $2.37 | 24d | 1 | 1.38mi |
| 220 Calibre Downs Ln Palm Harbor, FL | 1.0–2.0 | 1.0–2.5 | 1052 | $2,299 | $2.19 | 24d | 13 | 1.42mi |
| 31790 US Highway 19 N Palm Harbor, FL | 1.0–2.0 | 1.0–2.0 | 842 | $2,066 | $2.45 | 11d | 16 | 1.45mi |
| 1350 Seagate Dr Palm Harbor, FL | 1.0–4.0 | 1.0–2.0 | 1044 | $1,913 | $1.83 | 1d | 19 | 1.46mi |
| 2678 Markham Ct Palm Harbor, FL | 2.0 | 2.0 | 923 | $1,999 | $2.17 | 24d | 1 | 1.48mi |
| 3726 Albion Ct Palm Harbor, FL | 3.0 | 2.0 | 1060 | $2,350 | $2.22 | 13d | 1 | 1.48mi |
| 3726 Albion Ct Palm Harbor, FL | 3.0 | 2.0 | 1060 | $2,350 | $2.22 | 13d | 1 | 1.48mi |
HOA detail condo
- Monthly dues
- $778 · $9,336/yr
- Assessments
- None detected in remarks — confirm with the listing agent.
Listing history 21 events
-
2026-06-18days on market $118,500 Active 215 DOM
-
2026-06-17days on market $118,500 Active 214 DOM
-
2026-06-16days on market $118,500 Active 213 DOM
-
2026-06-15days on market $118,500 Active 212 DOM
-
2026-06-13days on market $118,500 Active 210 DOM
-
2026-06-09days on market $118,500 Active 206 DOM
-
2026-06-08days on market $118,500 Active 205 DOM
-
2026-06-07days on market $118,500 Active 204 DOM
-
2026-06-04days on market $118,500 Active 201 DOM
-
2026-06-03pricedays on market $118,500 Active 200 DOM
-
2026-06-01days on market $124,900 Active 198 DOM
-
2026-05-31days on market $124,900 Active 197 DOM
-
2026-04-17price $124,900
-
2026-04-15status Active
-
2026-04-14historical
-
2026-03-27price $129,500
-
2026-03-02price $134,500
-
2026-02-11price $145,000
-
2026-01-15price $149,000
-
2026-01-09price $150,000
-
2025-11-14$159,000 Active
ⓘ Source: listings_history table (triggers on properties + properties_extension) + one-shot
backfill from property_details.listing_events for pre-trigger history.
Climate risk First Street
- Flood 1/10 Low FEMA zone X (unshaded) · 0% chance over 30 yrs
- Wildfire 1/10 Low
- Heat 10/10 Extreme 7 d/yr ≥108°F today · 26 d/yr by 30 yrs out
- Wind 10/10 Extreme 99% chance of damaging wind over 30 yrs
- Air quality 3/10 Moderate 2 unhealthy d/yr today · 2 by 30 yrs out
Nearby sold comps map
Loading sold comps map…
Walkable amenities ~0.75 mi
Loading nearby amenities…
Taxation est. · year 1
- Rental income
- $22,803
- − Mortgage interest
- −$6,638
- − Property taxes
- −$1,778
- − Insurance
- −$592
- − Repairs & maintenance
- −$1,824
- − Management
- −$1,824
- − HOA
- −$9,336
- − Depreciation
- −$3,447
- Taxable loss
- −$2,637
- Est. tax savings @ 24.0%
- +$633
- After-tax cash flow
- $-516/yr
For passive investors: Depreciation is non-cash, so a rental often shows a tax loss while cash-flowing — sheltering income. Rental losses are passive: they offset passive income freely, and up to $25,000/yr can offset ordinary (W-2) income if you actively participate and your MAGI is under $100k (phasing out to $0 by $150k); unused losses carry forward. On sale, claimed depreciation is recaptured at up to 25%, and gains may owe capital-gains tax (a 1031 exchange can defer both). Figures are a year-1 estimate at your 24.0% rate — not tax advice; consult a CPA.
Schools (NCES district)
- District
- Pinellas
- NCES district ID
- 1201560
- Math proficiency
- 51% ▼ -5.00%
- Reading proficiency
- 51% ▼ -3.00%
- Median HH income
- $46,270
- Composite
- 43.27/100
- National rank
- #3046
- State rank
- #31 of 73 in FL
Livability — Palm Harbor
- Score
- 81/100
- State rank
- #95
- US rank
- #1470
Category grades
Schools grade is shown separately in the Schools card above.
Census & demographics
- Census place
- Palm Harbor, FL
- County
- Pinellas County · 939,478 people
- City population
- 79,072
- Metro
- Tampa-St. Petersburg-Clearwater, FL
- Population (ZIP)
- 27,029
- Household income
- $72,145
- Rent vs Own
- Severe rent burden
- 1495.0
Population outlook (Pinellas County) Hauer SSP2
- Today (2025)
- 1,027,532 people
- By 2030
- 1,063,586 · +3.5%
- By 2040
- 1,125,020 · +9.5%
- By 2050
- 1,168,637 · +13.7%
- By 2075
- 1,265,188 · +23.1%
- By 2100
- 1,260,357 · +22.7%
Race, ethnicity, and origin ACS 2023
- Neighborhood character
- Predominantly White (81%)
- Race & ethnicity
- White 81% Hispanic / Latino 10% Two or more races 8% Asian 4% Black 3%
- Hispanic origin (detail)
- Puerto Rican 2% Cuban 2%
- Common ancestry
- Lithuanian 5% Romanian 5% Scotch-Irish 3%
- Foreign-born
- 13% · Canada, Jamaica, China
- Languages at home
- 84% English-only · Spanish 6% Russian/Polish/Slavic 3% Other Indo-European 2%
Political lean MEDSL · Pinellas
- 2024 margin
- Lean R (+5.2) · D 46.9% · R 52.1%
- 2008→2024 swing
- -13.5pp toward R · 2008: 8.3pp · 2024: -5.2pp
- All cycles
- 2024: R+5.2 2020: D+0.2 2016: R+1.1 2012: D+5.6 2008: D+8.3
Not yet ingested
- Civics
- —
Market trends
- HPI YoY
- ▼ -296.23%
- Current HPI
- 301.651
- Rent YoY
- ▼ -5.17%
- Metro
- Tampa-St. Petersburg-Clearwater, FL
- State GDP YoY
- ▲ 3.28%
- F500 in state
- 36
Industry mix (Fortune 500 HQ in FL)
| Industry | F500 HQs | Revenue |
|---|---|---|
| Industrial Technology | 2 | $29B |
|
||
| Insurance | 2 | $17B |
|
||
| Retail | 1 | $60B |
|
||
| Technology Distribution | 1 | $58B |
|
||
| Homebuilding | 1 | $35B |
|
||
| Technology Manufacturing | 1 | $35B |
|
||
Price history
-21.4% since first listed9 events — show timeline
- 2026-04-17 Price Changed $124,900 Stellar MLS as Distributed by MLS Grid
- 2026-04-15 Relisted — Stellar MLS as Distributed by MLS Grid
- 2026-04-14 Listing Removed — Stellar MLS as Distributed by MLS Grid
- 2026-03-27 Price Changed $129,500 Stellar MLS as Distributed by MLS Grid
- 2026-03-02 Price Changed $134,500 Stellar MLS as Distributed by MLS Grid
- 2026-02-11 Price Changed $145,000 Stellar MLS as Distributed by MLS Grid
- 2026-01-15 Price Changed $149,000 Stellar MLS as Distributed by MLS Grid
- 2026-01-09 Price Changed $150,000 Stellar MLS as Distributed by MLS Grid
- 2025-11-14 Listed $159,000 Stellar MLS as Distributed by MLS Grid
Cash-flow waterfall
monthlySold comps — $/sqft
last 12 mo · ≤1 miLoading sold comps…