2985 N Montgomery Co Line Rd · Union, OH
Flood risk 5/10 · Moderate
- FEMA flood zone
- A
- Chance of flooding over 30 yrs
- 0.66%
- Est. flood insurance / yr
- $946 – $6,584
Fire risk 1/10 · Minimal
- Est. fire insurance / yr
- $713 – $1,323
Heat risk 3/10 · Minor
- Hot days now (above 99°F)
- 7 days/yr
- Hot days in 30 yrs
- 18 days/yr
Wind risk 2/10 · Minimal
- Chance of severe wind over 30 yrs
- 1.0%
Air-quality risk 2/10 · Minimal
- Unhealthy air days now
- 1 days/yr
- Unhealthy air days in 30 yrs
- 2 days/yr
Risk factors via First Street. Map © Google.
Why this score? — see what drove the D+ grade
The composite is a weighted blend of 9 inputs, each scored 0–100. Each bar is that input's sub-score; the figure is the points it added to the 100-point composite (weight × sub-score).
- Cash flow +15.0/30.0
- ARV discount +7.5/15.0
- Schools +6.3/10.0
- 1% rule +5.0/10.0
- DSCR +5.0/10.0
- Livability +3.5/5.0
- Rent growth +2.5/5.0
- Condition / age +2.5/5.0
- Appreciation +0.0/10.0
$25,000
🖨 Deal sheet 📄 Offer letter ✓ Due diligence
Listing remarks
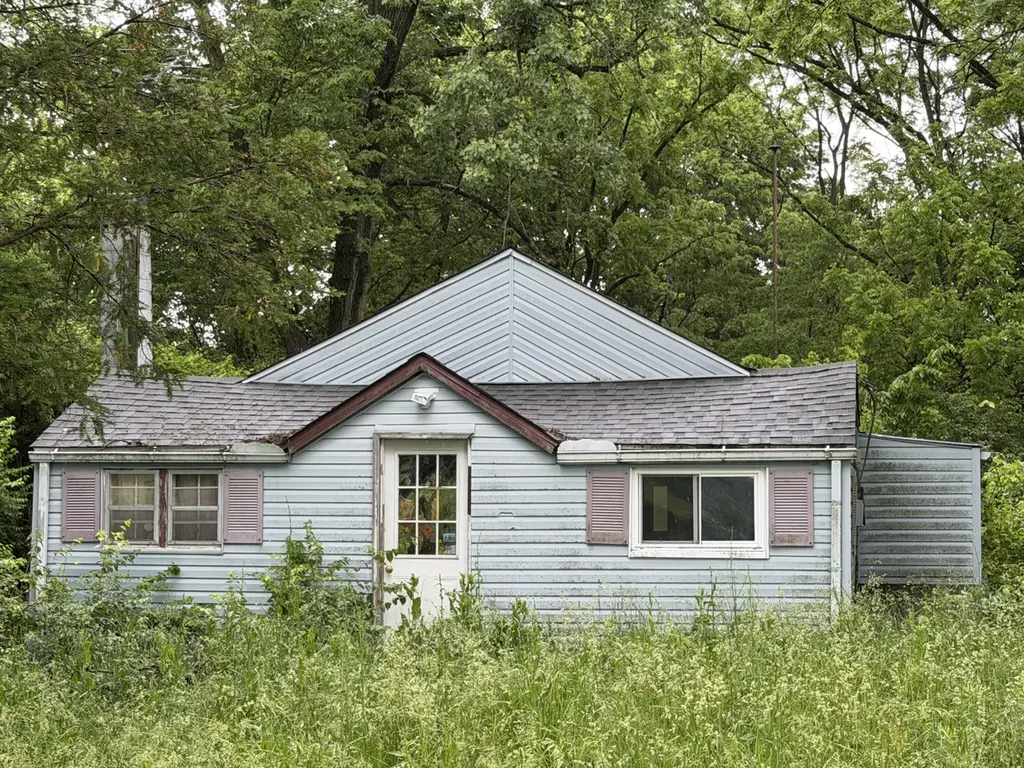
Don't miss this diamond in the rough. 1 bedroom 1 bath home with detached garage. Almost 1/2 acre located in Tipp City School district. This one needs some work but it's priced cheaper than most new cars. This is not a foreclosure or bank owned. Selling as is no contingencies of any kind. This property is being offered on the Fink Auction and Appraisal website. The opening bid is the list price plus a buyer premium as the reserve price. Bidding will start shortly, and once a bid is placed, it will sell to the highest bidder. The auction will begin to close on June 15th 2026, at 7:00 PM. This property is being sold as-is, where-is, with no contingencies. Full details and terms are available
Key facts
- 0.48 acre lot
- 2 garage spots
- Built 1950
Property features AI
Exterior
- Parking: Garage with 2 spaces
- Utilities: Septic tank sewer; Well water
- Home design: Single-family residential property; Built in 1950
- Construction: Vinyl siding construction; Unfinished basement; Built in 1950
- Exterior features: Residential lot; Water from a private well; Vinyl siding
Interior
- Kitchen: Kitchen
- Bedrooms: Bedroom 1
- Bathrooms: 1 full bathroom (1 total)
- Heating & cooling: Has heating (type: Other — see remarks); Has cooling (type: Other — see remarks)
- Interior features: 3 total rooms; Unfinished basement
Neighborhood map
What this means for you Summary
Snapshot
- This is a 1-bed/1.0-bath single-family listed at $25k.
Deal economics
- At list price, monthly cash flow is $455 ($5k/yr) — positive.
- The deal already cash-flows at list — no discount required.
- Meets the 1% rule at list price ($1k rent vs $25k).
- Recommended offer: $25k (1.5% below list) — sets the bar for market timing.
- Cap rate 43.2% vs local median 5.3% in Union — top-decile yield for the area; either an underpriced asset or a hidden risk that comps aren't pricing in. Stress-test before assuming the spread holds.
Location & tenants
- Location reads 70/100 on livability (#487 in OH) — a middle-class / working-renter tenant base. Strengths: crime A+, cost of living A+, housing A+; Watch: amenities F, commute F, health & safety F.
- Tipp City Exempted Village (suburban): math 70% / reading 76% proficiency, ranked #108 of 656 in OH (top 16%) — strong family-tenant draw, lease renewals of 3-5y typical; only 14% free/reduced lunch — higher-income household profile.
- Market conditions: 250 active listings in the ZIP; solid renter incomes; 326 units permitted in Miami County in 2024 (0 in 5+ unit buildings).
- This rent is only 16% of the median local income ($94k/yr) — well below the 30% rent-burden line; pricing power to push rent on renewal without tenant pushback.
Forward outlook
- Local home prices are declining (-3.0%/yr); year-one equity from $173 of loan paydown is wiped out by about $750 of value loss. Plan a longer hold.
- At projected returns (-3.0% appreciation + 3.0% rent growth), your $7k cash investment doubles in ~2 years — after that, you're playing with house money.
Negotiation context
- It's been on market 18 days — a 2% lower offer ($25k) is reasonable based on typical stale-listing flexibility.
Risks & watch-outs
- Watch-outs: property tax is 4.4% of price; flood insurance adds $314/mo; built in 1950 — expect roof / HVAC / electrical / plumbing capex.
- Climate carrying-cost: in FEMA flood zone A (mandatory federal flood insurance) — expect insurance premiums to compound above CPI over the hold.
Questions for the listing agent
- Built in 1950 — when were the roof, HVAC, electrical panel, plumbing, and water heater last replaced?
- Property tax is high relative to price — has the assessment been appealed recently, and will the sale trigger a re-assessment?
- What's the actual annual flood-insurance premium (NFIP or private), and is the property in a SFHA with mandatory coverage?
- Is there a deadline driving the sale (1031 exchange, divorce, estate, relocation)? That informs how much negotiation room exists.
- Schools are B-rated — typically a magnet for longer-tenancy family renters. What's the average tenant stay here, and is there a school-zone premium baked into asking?
- The area grade is low — what's the realistic commute time and amenity access for the typical tenant pool here? Any planned neighborhood developments (good or bad) we should know about?
- What's the average days-on-market for RENTAL listings here right now (not sales)? A rising rental-DOM trend means longer vacancies and softer asking-rent achievability than the comps imply.
- What's the recent tenant-quality profile in this submarket — average credit score on applications, eviction rate, late-payment / NSF rate, and stable-employment percentage? A property-management company in the area should have these aggregated.
- How much new for-sale + rental construction is in the pipeline within 1–3 miles? Heavy new supply typically softens prices + rents 12–24 months out; constrained supply supports both.
Investment metrics
- 1% rule
- 5.08% ✓
- Cap rate
- 43.19%
- Cash-on-cash
- 131.76%
- DSCR
- 6.86
- GRM
- 1.6
CMA / ARV
No comps found within radius.
Projected returns pro-forma
-3.0% appreciation · 3.0% rent growth · sell at horizon
- IRR
- 78.4%
- Equity multiple
- 4.60×
- Total profit
- $25,168
- Equity at exit
- $3,728
- IRR
- 82.0%
- Equity multiple
- 9.60×
- Total profit
- $60,233
- Equity at exit
- $2,162
Cash invested: $7,000 (down + closing). Projections, not guarantees.
Landlord ↔ Tenant lean methodology
- Overall (STATE)
- 73 Landlord-Friendly
- State Ohio
- 73 Landlord-Friendly · R+6
- County
- — inherits STATE
- City
- — inherits STATE
ZIP-level market 45371
- Active inventory
- 250
- Price-to-rent
- 1.6×
Monthly cashflow live
- Estimated rent
- $1,269 medium interval (Pro) →
- Mortgage (P&I)
- −$131
- Tax from tax record
- −$92 /mo · $1,107/yr
- Insurance
- −$10
- Flood insurance flood zone
- −$314 /mo · $3,765/yr
- HOA
- −$0
- Vacancy / Maint / Mgmt
- −$266
- Net cashflow
- $455
Break-even live
UW: 25.0% down · 7.5% · 30yr · 1.5% tax · 5.0% vac · 8.0% maint · 8.0% mgmt
Financing live
Cash to close
- Down payment
- $6,250
- Closing costs
- $750
- Reserves months
- —
- Total cash needed
- —
Loan-product check · same deal, 3 products live
Conventional
25% down · 7.5% · 30yr
- Down + closing
- —
- Monthly P&I
- —
- Monthly cashflow
- —
- DSCR
- —
- Eligible?
- —
Personal DTI + credit; lowest rate.
DSCR
20% down · 8.5% · 30yr
- Down + closing
- —
- Monthly P&I
- —
- Monthly cashflow
- —
- DSCR
- —
- Eligible?
- —
No personal income docs; deal must DSCR.
Hard money
10% down · 12.0% · 12mo
- Down + closing
- —
- Monthly P&I
- —
- Monthly cashflow
- —
- DSCR
- —
- Eligible?
- —
Short-term bridge; refi at stabilization.
Listing history 13 events
-
2026-06-16status $25,000 Pending 18 DOM
-
2026-06-15days on market $25,000 Active 18 DOM
-
2026-06-14days on market $25,000 Active 16 DOM
-
2026-06-10days on market $25,000 Active 13 DOM
-
2026-06-09days on market $25,000 Active 12 DOM
-
2026-06-08days on market $25,000 Active 11 DOM
-
2026-06-07days on market $25,000 Active 10 DOM
-
2026-06-03days on market $25,000 Active 6 DOM
-
2026-06-02days on market $25,000 Active 5 DOM
-
2026-06-01days on market $25,000 Active 4 DOM
-
2026-05-31days on market $25,000 Active 3 DOM
-
2026-05-31days on market $25,000 Active 2 DOM
-
2026-05-28$25,000 Active
ⓘ Source: listings_history table (triggers on properties + properties_extension) + one-shot
backfill from property_details.listing_events for pre-trigger history.
Tax reassessment forecast OH · Partial reset (capped growth)
- Current annual tax
- $1,107 · $92/mo
- Projected year-2 tax
- $1,107 · $92/mo
- Expected delta
- $0/yr ($0/mo · 0.0%)
ⓘ Screening estimate from a state-policy table — verify with the county assessor before closing.
Climate risk First Street
- Flood 5/10 Major FEMA zone A · 66% chance over 30 yrs
- Wildfire 1/10 Low
- Heat 3/10 Moderate 7 d/yr ≥99°F today · 18 d/yr by 30 yrs out
- Wind 2/10 Low 100% chance of damaging wind over 30 yrs
- Air quality 2/10 Low 1 unhealthy d/yr today · 2 by 30 yrs out
Nearby sold comps map
Loading sold comps map…
Walkable amenities ~0.75 mi
Loading nearby amenities…
Taxation est. · year 1
- Rental income
- $15,225
- − Mortgage interest
- −$1,400
- − Property taxes
- −$1,107
- − Insurance
- −$3,890
- − Repairs & maintenance
- −$1,218
- − Management
- −$1,218
- − Depreciation
- −$727
- Taxable income
- $5,665
- Est. tax owed @ 24.0%
- −$1,360
- After-tax cash flow
- $4,099/yr
For passive investors: Depreciation is non-cash, so a rental often shows a tax loss while cash-flowing — sheltering income. Rental losses are passive: they offset passive income freely, and up to $25,000/yr can offset ordinary (W-2) income if you actively participate and your MAGI is under $100k (phasing out to $0 by $150k); unused losses carry forward. On sale, claimed depreciation is recaptured at up to 25%, and gains may owe capital-gains tax (a 1031 exchange can defer both). Figures are a year-1 estimate at your 24.0% rate — not tax advice; consult a CPA.
Schools (NCES district)
- District
- Tipp City Exempted Village
- NCES district ID
- 3904561
- Math proficiency
- 70% ▼ -9.00%
- Reading proficiency
- 76% ▼ -5.00%
- Median HH income
- $63,580
- Composite
- 63.13/100
- National rank
- #642
- State rank
- #108 of 656 in OH
Livability — Union
- Score
- 70/100
- State rank
- #487
- US rank
- #8108
Category grades
Schools grade is shown separately in the Schools card above.
Census & demographics
- County
- Miami County · 85,667 people
- City population
- 22,865
- Metro
- Dayton-Kettering, OH
- Population (ZIP)
- 22,865
- Household income
- $93,599
- Rent vs Own
- Severe rent burden
- 465.0
Population outlook (Miami County) Hauer SSP2
- Today (2025)
- 107,816 people
- By 2030
- 108,896 · +1.0%
- By 2040
- 109,581 · +1.6%
- By 2050
- 108,110 · +0.3%
- By 2075
- 101,523 · -5.8%
- By 2100
- 85,787 · -20.4%
Race, ethnicity, and origin ACS 2023
- Neighborhood character
- Predominantly White (88%)
- Race & ethnicity
- White 88% Two or more races 6% Asian 3% Hispanic / Latino 2% Black 2%
- Common ancestry
- Lithuanian 3% Romanian 3% Scotch-Irish 2%
- Foreign-born
- 6% · Canada
- Languages at home
- 92% English-only · Other Asian/Pacific 3% Russian/Polish/Slavic 1% Spanish 1%
Political lean MEDSL · Miami
- 2024 margin
- Solid R (+45.1) · D 27.0% · R 72.1%
- 2008→2024 swing
- -16.6pp toward R · 2008: -28.5pp · 2024: -45.1pp
- All cycles
- 2024: R+45.1 2020: R+44.3 2016: R+45.6 2012: R+35.6 2008: R+28.5
Not yet ingested
- Civics
- —
Market trends
- HPI YoY
- ▼ -178.63%
- Current HPI
- 205.0064
- Rent YoY
- —
- Metro
- Dayton-Kettering, OH
- State GDP YoY
- ▲ 1.98%
- F500 in state
- 48
Industry mix (Fortune 500 HQ in OH)
| Industry | F500 HQs | Revenue |
|---|---|---|
| Insurance | 3 | $145B |
|
||
| Industrial Machinery | 3 | $49B |
|
||
| Financial Services | 3 | $24B |
|
||
| Consumer Goods | 2 | $93B |
|
||
| Aerospace / Defense | 2 | $47B |
|
||
| Utilities | 2 | $33B |
|
||
Price history
1 event — show timeline
- 2026-05-28 Listed $25,000 WRIST
Property tax history
+1.7%/yrLatest (2025): $1,107 · -30.5% YoY. Source: county tax records.
Cash-flow waterfall
monthlySold comps — $/sqft
last 12 mo · ≤1 miLoading sold comps…