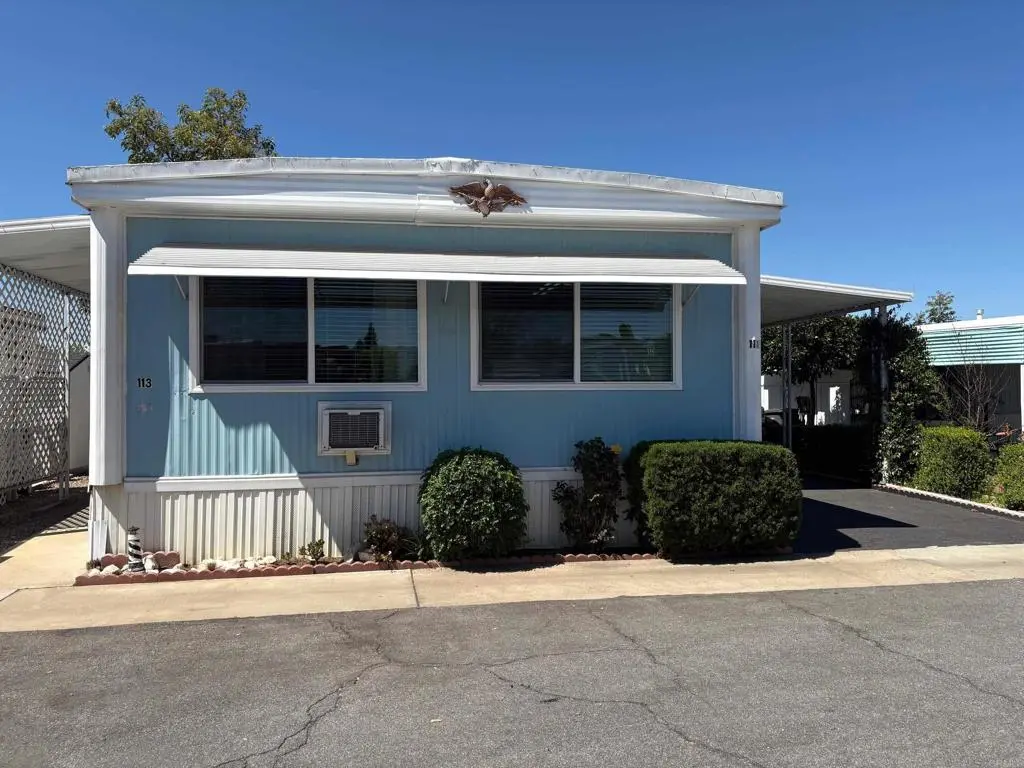
1174 E Main St #113 · El Cajon, CA
Flood risk 4/10 · Minor
- FEMA flood zone
- X (unshaded)
- Chance of flooding over 30 yrs
- 0.22%
- Est. flood insurance / yr
- $507 – $1,088
Fire risk 1/10 · Minimal
- Est. fire insurance / yr
- $659 – $1,223
Heat risk 5/10 · Moderate
- Hot days now (above 99°F)
- 6 days/yr
- Hot days in 30 yrs
- 17 days/yr
Wind risk 1/10 · Minimal
- Chance of severe wind over 30 yrs
- —
Air-quality risk 4/10 · Minor
- Unhealthy air days now
- 6 days/yr
- Unhealthy air days in 30 yrs
- 7 days/yr
Risk factors via First Street. Map © Google.
Why this score? — see what drove the B+ grade
The composite is a weighted blend of 9 inputs, each scored 0–100. Each bar is that input's sub-score; the figure is the points it added to the 100-point composite (weight × sub-score).
- Cash flow +30.0/30.0
- ARV discount +15.0/15.0
- 1% rule +10.0/10.0
- DSCR +10.0/10.0
- Schools +4.0/10.0
- Livability +3.5/5.0
- Condition / age +2.5/5.0
- Rent growth +2.3/5.0
- Appreciation +0.0/10.0
$89,500
🖨 Deal sheet 📄 Offer letter ✓ Due diligence
Listing remarks
Affordable 55+ Living - Welcome to this well-maintained 2-bedroom-1-bath mobile home. This comfortable home offers a functional layout with a dedicated indoor laundry closet, complete with washer & dryer. The kitchen comes fully equipped with stove, oven, microwave, refrigerator—all appliances included. Enjoy outdoor space in a side yard with a patio table & umbrella, along with a covered carport accommodating two vehicles. Two storage units provide plenty of extra room for your belongings. Ideally situated close to restaurants, shopping, and transportation, this home offers both convenience and accessibility. Residents enjoy amenities including a pool, clubhouse, rec room
Key facts
- 13 acre lot
- 2 parking spots
- Community pool
Property features AI
Finance
- Other: Located in Safari Mobile Lodge; Community features: park
- HOA & community: Senior community; Land lease of $1,025 (land lease applies)
Exterior
- Parking: Two parking spaces; Two carport spaces
- Utilities: Public sewer
- Home design: Mobile home (20' x 40') — mobile home remains on site; One story
- Construction: Year built: see remarks
- Exterior features: In-ground community pool; Lot is level/flat; Two sheds on the property; Located within a park community (Safari Mobile Lodge)
Interior
- Kitchen: Kitchen (details not specified)
- Bedrooms: All bedrooms on the main level
- Bathrooms: One full bathroom
- Heating & cooling: Wall/window cooling
- Interior features: Front door entry; Single-level home
- Laundry & utility: Laundry in closet
Neighborhood map
What this means for you Summary
Snapshot
- This is a 2-bed/1.0-bath manufactured listed at $90k.
Deal economics
- At list price, monthly cash flow is $1k ($12k/yr) — positive.
- The deal already cash-flows at list — no discount required.
- Meets the 1% rule at list price ($2k rent vs $90k).
- Recommended offer: $84k (6.0% below list) — sets the bar for market timing.
- Cap rate 20.3% vs local median 2.4% in El Cajon — top-decile yield for the area; either an underpriced asset or a hidden risk that comps aren't pricing in. Stress-test before assuming the spread holds.
Location & tenants
- Location reads 70/100 on livability (#230 in CA) — a middle-class / working-renter tenant base. Strengths: amenities A+, commute A+; Watch: health & safety C-, crime D+, cost of living F.
- Grossmont Union High (suburban): math 31% / reading 60% proficiency, ranked #173 of 517 in CA (top 34%) — families likely to look elsewhere, expect single-tenant / working-renter base with shorter leases; only 17% free/reduced lunch — higher-income household profile.
- Market conditions: Rents soft (-0.8%/yr); 238 active listings in the ZIP; 40 comparable units currently listed for rent nearby; rentals leasing fast (median 2d on market — plan ~1-2 weeks tenant-placement turnaround); 11,759 units permitted in San Diego County in 2024 (7,244 in 5+ unit buildings).
- This rent runs 34% of the median local income ($74k/yr) — at the standard rent-burdened threshold; future hikes will face affordability resistance.
Forward outlook
- Local home prices are declining (-3.0%/yr); year-one equity from $619 of loan paydown is wiped out by about $3k of value loss. Plan a longer hold.
- San Diego County population projected at +20% by 2050 — long-run rental-demand tailwind backs the buy-and-hold thesis.
- At projected returns (-3.0% appreciation + 0.0% rent growth), your $25k cash investment doubles in ~3 years — after that, you're playing with house money.
Negotiation context
- It's been on market 70 days — a 6% lower offer ($84k) is reasonable based on typical stale-listing flexibility.
- 4 sale attempts since 14y ago; this cycle's ask has dropped $8k (9%) from the opening price — seller is motivated, your offer sets the floor, not the list.
Risks & watch-outs
- Climate carrying-cost: extreme-heat days projected 6→17/yr by 2055 (HVAC capex compounding) — expect insurance premiums to compound above CPI over the hold.
Questions for the listing agent
- It's been on market 70 days. Have you received any prior offers? Is the seller open to a 6% concession, seller financing, or rate buy-down credit?
- Built in 1969 — when were the roof, HVAC, electrical panel, plumbing, and water heater last replaced?
- Why hasn't it sold? Are there any deal-killer items the seller is aware of (foundation, flood, title, zoning, code violations)?
- Is there a deadline driving the sale (1031 exchange, divorce, estate, relocation)? That informs how much negotiation room exists.
- Crime grade is D in this area — have there been break-ins, vandalism, or insurance claims at this property in the last 3 years? What carrier currently insures it and at what premium?
- What's the average days-on-market for RENTAL listings here right now (not sales)? A rising rental-DOM trend means longer vacancies and softer asking-rent achievability than the comps imply.
- What's the recent tenant-quality profile in this submarket — average credit score on applications, eviction rate, late-payment / NSF rate, and stable-employment percentage? A property-management company in the area should have these aggregated.
- How much new for-sale + rental construction is in the pipeline within 1–3 miles? Heavy new supply typically softens prices + rents 12–24 months out; constrained supply supports both.
Investment metrics
- 1% rule
- 2.35% ✓
- Cap rate
- 20.25%
- Cash-on-cash
- 49.86%
- DSCR
- 3.22
- GRM
- 3.6
CMA / ARV
- ARV (on-the-fly)
- $155,200
- Comps found
- 10
Show comp detail 10 sales within ~0.75 mi
| Address | Dist | Beds/Ba | Sqft | Sold | Price | $/sf | Match |
|---|---|---|---|---|---|---|---|
| 1174 E Main St Spc 92 | 0.02mi | 2/2.0 | 800 (0%) | 10mo | $139,000 | $174 | 86 |
| 187 Ballard St #15 | 0.19mi | 2/2.0 | 800 (0%) | 1mo | $120,000 | $150 | 86 |
| 1174 E Main St #62 | 0.00mi | 2/2.0 | 691 (-14%) | 2mo | $175,000 | $253 | 71 |
| 410 S 1st St #30 | 0.49mi | 2/1.0 | 784 (-2%) | 4mo | $85,000 | $108 | 70 |
| 410 S 1st St #126 | 0.49mi | 2/1.0 | 800 (0%) | 15mo | $107,500 | $134 | 65 |
| 1313 E Main #34 | 0.45mi | 2/2.0 | 833 (+4%) | 6mo | $162,000 | $194 | 63 |
| 410 S 1st St Spc 145 | 0.49mi | 2/1.5 | 742 (-7%) | 5mo | $85,575 | $115 | 59 |
| 1425 E Madison Ave #18 | 0.72mi | 2/1.0 | 748 (-6%) | 1mo | $147,000 | $197 | 55 |
| 998 E Main St Spc 68 | 0.38mi | 2/1.0 | 900 (+12%) | 13mo | $175,000 | $194 | 51 |
| 410 S 1st | 0.60mi | 2/2.0 | 880 (+10%) | 11mo | $175,000 | $199 | 43 |
Match score weights: distance 35% · size 25% · config 20% · recency 20%. Top-matched comps best support the ARV.
Projected returns pro-forma
-3.0% appreciation · 0.0% rent growth · sell at horizon
- IRR
- 44.1%
- Equity multiple
- 2.82×
- Total profit
- $45,683
- Equity at exit
- $13,345
- IRR
- 48.7%
- Equity multiple
- 5.05×
- Total profit
- $101,501
- Equity at exit
- $7,738
Cash invested: $25,060 (down + closing). Projections, not guarantees.
Landlord ↔ Tenant lean methodology
- Overall (STATE)
- 18 Strongly Tenant-Friendly
- State California
- 18 Strongly Tenant-Friendly · D+13
- County
- — inherits STATE
- City
- — inherits STATE
ZIP-level market 92021
- Rents YoY
- -0.8%
- Active inventory
- 238
- Price-to-rent
- 3.6×
Monthly cashflow live
- Estimated rent
- $2,101 high interval (Pro) →
- Mortgage (P&I)
- −$469
- Tax est. 1.5%
- −$112 /mo · $1,342/yr
- Insurance
- −$37
- HOA
- −$0
- Vacancy / Maint / Mgmt
- −$441
- Net cashflow
- $1,041
Break-even live
UW: 25.0% down · 7.5% · 30yr · 1.5% tax · 5.0% vac · 8.0% maint · 8.0% mgmt
Financing live
Cash to close
- Down payment
- $22,375
- Closing costs
- $2,685
- Reserves months
- —
- Total cash needed
- —
Loan-product check · same deal, 3 products live
Conventional
25% down · 7.5% · 30yr
- Down + closing
- —
- Monthly P&I
- —
- Monthly cashflow
- —
- DSCR
- —
- Eligible?
- —
Personal DTI + credit; lowest rate.
DSCR
20% down · 8.5% · 30yr
- Down + closing
- —
- Monthly P&I
- —
- Monthly cashflow
- —
- DSCR
- —
- Eligible?
- —
No personal income docs; deal must DSCR.
Hard money
10% down · 12.0% · 12mo
- Down + closing
- —
- Monthly P&I
- —
- Monthly cashflow
- —
- DSCR
- —
- Eligible?
- —
Short-term bridge; refi at stabilization.
Rent comps 40 comps
| Address | Beds | Baths | Sqft | Rent | $/sqft | DOM | Units | Dist |
|---|---|---|---|---|---|---|---|---|
| 368 Orlando St El Cajon, CA | 1.0 | 1.0 | 692 | $1,850 | $2.67 | 1d | 1 | 0.14mi |
| 368 Orlando St #21 El Cajon, CA | 1.0 | 1.0 | 692 | $1,850 | $2.67 | 10d | 1 | 0.14mi |
| 277 N 1st St El Cajon, CA | 2.0 | 2.0 | 825 | $2,130 | $2.58 | 1d | 1 | 0.15mi |
| 340 N 1st St El Cajon, CA | 2.0 | 1.0 | 751 | $1,980 | $2.64 | 1d | 3 | 0.18mi |
| 304 N 1st St El Cajon, CA | 2.0 | 1.0 | 769 | $2,300 | $2.99 | 1d | 1 | 0.20mi |
| 180 N 1st St El Cajon, CA | 1.0–2.0 | 1.0–2.0 | 830 | $2,125 | $2.56 | 1d | 3 | 0.20mi |
| 360 N 1st St El Cajon, CA | 2.0 | 2.0 | 725 | $1,995 | $2.75 | 16d | 1 | 0.22mi |
| 233 Shady Ln El Cajon, CA | 1.0 | 1.0 | 650 | $1,795 | $2.76 | 1d | 1 | 0.25mi |
| 187 Ballard St El Cajon, CA | 1.0–2.0 | 1.0–2.0 | 542 | $2,150 | $3.97 | 1d | 2 | 0.25mi |
| 301 Shady Ln El Cajon, CA | 1.0–2.0 | 1.0 | 720 | $2,250 | $3.12 | 1d | 8 | 0.27mi |
| 422 Shady Ln El Cajon, CA | 1.0–3.0 | 1.0–2.0 | 900 | $2,304 | $2.56 | 1d | 18 | 0.28mi |
| 541 N 1st St Apt 14 El Cajon, CA | 1.0 | 1.0 | 550 | $1,550 | $2.82 | 1d | 1 | 0.31mi |
| 421 Shady Ln El Cajon, CA | 1.0 | 1.0 | 575 | $1,708 | $2.97 | 1d | 3 | 0.31mi |
| 1137 E Lexington Ave El Cajon, CA | 2.0 | 1.0 | 900 | $1,995 | $2.22 | 1d | 1 | 0.31mi |
| 1072 E Madison Ave El Cajon, CA | 2.0 | 1.0 | 770 | $1,995 | $2.59 | 1d | 1 | 0.33mi |
| 1018 E Lexington Ave El Cajon, CA | 1.0 | 1.0 | 670 | $1,800 | $2.69 | 1d | 1 | 0.40mi |
| 1037 E Lexington Ave El Cajon, CA | 1.0–3.0 | 1.0–2.0 | 855 | $2,225 | $2.60 | 1d | 5 | 0.40mi |
| 1041-89 E Lexington Ave El Cajon, CA | 1.0–2.0 | 1.0–2.0 | 838 | $2,425 | $2.89 | 1d | 8 | 0.40mi |
| 265 S Anza St El Cajon, CA | 2.0 | 1.0 | 775 | $2,250 | $2.90 | 2d | 1 | 0.42mi |
| 233 N Mollison Ave El Cajon, CA | 1.0–2.0 | 1.0–2.0 | 843 | $2,202 | $2.61 | 1d | 10 | 0.47mi |
| 257 Jamacha Rd El Cajon, CA | 2.0 | 1.0 | 850 | $2,272 | $2.67 | 1d | 4 | 0.50mi |
| 432 Dominguez Way Unit 13 El Cajon, CA | 2.0 | 1.5 | 952 | $2,195 | $2.31 | 20d | 1 | 0.52mi |
| 291 Jamacha Rd El Cajon, CA | 1.0–2.0 | 1.0 | 825 | $2,095 | $2.54 | 1d | 4 | 0.53mi |
| 917 E Madison Ave El Cajon, CA | 2.0 | 1.0 | 750 | $2,195 | $2.93 | 1d | 1 | 0.54mi |
| 545 N Mollison Ave El Cajon, CA | 2.0 | 1.0 | 700 | $2,028 | $2.90 | 1d | 11 | 0.55mi |
| 545 N Mollison Ave El Cajon, CA | 2.0 | 1.0 | 700 | $2,000 | $2.86 | 7d | 9 | 0.55mi |
| 280 N Mollison Ave El Cajon, CA | 1.0–2.0 | 1.0 | 825 | $2,195 | $2.66 | 1d | 1 | 0.56mi |
| 1343 Oakdale Ave El Cajon, CA | 1.0–2.0 | 1.0–2.0 | 800 | $2,195 | $2.74 | 1d | 1 | 0.57mi |
| 244 N Mollison Ave El Cajon, CA | 2.0 | 1.0 | 858 | $2,110 | $2.46 | 1d | 2 | 0.58mi |
| 346 Jamacha Rd El Cajon, CA | 2.0 | 1.0–2.0 | 887 | $2,436 | $2.74 | 1d | 8 | 0.58mi |
| 1382 Ivory Ct Unit 1382B El Cajon, CA | 1.0 | 1.0 | 550 | $1,625 | $2.95 | 1d | 1 | 0.58mi |
| 279 S Mollison Ave El Cajon, CA | 1.0 | 1.0 | 570 | $1,950 | $3.42 | 1d | 1 | 0.59mi |
| 1360 E Madison Ave El Cajon, CA | 1.0–2.0 | 1.0 | 550 | $2,595 | $4.72 | 1d | 22 | 0.59mi |
| 595 S 2nd St El Cajon, CA | 2.0 | 1.0 | 800 | $2,290 | $2.86 | 1d | 1 | 0.60mi |
| 200 S Mollison Ave El Cajon, CA | 2.0 | 1.0 | 950 | $1,995 | $2.10 | 1d | 1 | 0.60mi |
| 421 S Mollison Ave El Cajon, CA | 1.0–2.0 | 1.0 | 726 | $1,900 | $2.62 | 1d | 2 | 0.61mi |
| 588 S Anza St El Cajon, CA | 1.0–2.0 | 1.0 | 767 | $2,100 | $2.74 | 1d | 6 | 0.61mi |
| 1377 Oakdale Ave Unit 03 El Cajon, CA | 2.0 | 2.0 | 900 | $2,425 | $2.69 | 1d | 1 | 0.64mi |
| 800 E Lexington Ave El Cajon, CA | 2.0–3.0 | 2.0 | 1040 | $2,390 | $2.30 | 1d | 5 | 0.64mi |
| 390 S Mollison Ave El Cajon, CA | 1.0 | 1.0 | 750 | $1,725 | $2.30 | 1d | 1 | 0.65mi |
Listing history 21 events
-
2026-06-18days on market $89,500 Active 70 DOM
-
2026-06-17days on market $89,500 Active 69 DOM
-
2026-06-16days on market $89,500 Active 68 DOM
-
2026-06-15days on market $89,500 Active 67 DOM
-
2026-06-13days on market $89,500 Active 65 DOM
-
2026-06-13status $89,500 Active 64 DOM
-
2026-06-03status $89,500 Pending Sale 64 DOM
-
2026-06-02days on market $89,500 Active 64 DOM
-
2026-06-01days on market $89,500 Active 63 DOM
-
2026-05-31days on market $89,500 Active 62 DOM
-
2026-05-12price $89,500
-
2026-03-28$98,000 Active
-
2012-10-02historical
-
2012-10-02historical
-
2012-09-19price $22,500
-
2012-08-31price $23,000
-
2012-06-19status Active
-
2012-06-12status Pending
-
2012-04-11price $23,500
-
2012-04-04$25,000 Active
-
2012-04-04$22,500
ⓘ Source: listings_history table (triggers on properties + properties_extension) + one-shot
backfill from property_details.listing_events for pre-trigger history.
Climate risk First Street
- Flood 4/10 Moderate FEMA zone X (unshaded) · 22% chance over 30 yrs
- Wildfire 1/10 Low
- Heat 5/10 Major 6 d/yr ≥99°F today · 17 d/yr by 30 yrs out
- Wind 1/10 Low
- Air quality 4/10 Moderate 6 unhealthy d/yr today · 7 by 30 yrs out
Nearby sold comps map
Loading sold comps map…
Walkable amenities ~0.75 mi
Loading nearby amenities…
Taxation est. · year 1
- Rental income
- $25,210
- − Mortgage interest
- −$5,013
- − Property taxes
- −$1,342
- − Insurance
- −$448
- − Repairs & maintenance
- −$2,017
- − Management
- −$2,017
- − Depreciation
- −$2,604
- Taxable income
- $11,769
- Est. tax owed @ 24.0%
- −$2,825
- After-tax cash flow
- $9,669/yr
For passive investors: Depreciation is non-cash, so a rental often shows a tax loss while cash-flowing — sheltering income. Rental losses are passive: they offset passive income freely, and up to $25,000/yr can offset ordinary (W-2) income if you actively participate and your MAGI is under $100k (phasing out to $0 by $150k); unused losses carry forward. On sale, claimed depreciation is recaptured at up to 25%, and gains may owe capital-gains tax (a 1031 exchange can defer both). Figures are a year-1 estimate at your 24.0% rate — not tax advice; consult a CPA.
Schools (NCES district)
- District
- Grossmont Union High
- NCES district ID
- 0616230
- Math proficiency
- 31% ▼ -1.00%
- Reading proficiency
- 60% ▲ 5.00%
- Median HH income
- $61,801
- Composite
- 40.07/100
- National rank
- #3810
- State rank
- #173 of 517 in CA
Livability — El Cajon
- Score
- 70/100
- State rank
- #230
- US rank
- #7531
Category grades
Schools grade is shown separately in the Schools card above.
Census & demographics
- Census place
- El Cajon, CA
- County
- San Diego County · 3,178,799 people
- City population
- 173,694
- Metro
- San Diego-Chula Vista-Carlsbad, CA
- Population (ZIP)
- 70,501
- Household income
- $74,013
- Rent vs Own
- Severe rent burden
- 4178.0
Population outlook (San Diego County) Hauer SSP2
- Today (2025)
- 3,678,185 people
- By 2030
- 3,856,546 · +4.8%
- By 2040
- 4,171,407 · +13.4%
- By 2050
- 4,421,607 · +20.2%
- By 2075
- 4,831,599 · +31.4%
- By 2100
- 4,832,502 · +31.4%
Race, ethnicity, and origin ACS 2023
- Neighborhood character
- Diverse neighborhood (Simpson 0.62)
- Race & ethnicity
- White 54% Hispanic / Latino 28% Two or more races 14% Black 6% Asian 5% Native American 2%
- Hispanic origin (detail)
- Mexican 24%
- Common ancestry
- Arab 6% Italian 2% Lithuanian 2%
- Foreign-born
- 22% · Canada
- Languages at home
- 65% English-only · Spanish 18% Arabic 7% Other Indo-European 3%
Political lean MEDSL · San Diego
- 2024 margin
- D (+16.8) · D 56.9% · R 40.1% · Other 2.9%
- 2008→2024 swing
- +6.6pp toward D · 2008: 10.2pp · 2024: 16.8pp
- All cycles
- 2024: D+16.8 2020: D+22.8 2016: D+17.8 2012: D+5.1 2008: D+10.2
Not yet ingested
- Civics
- —
Market trends
- HPI YoY
- ▼ -654.88%
- Current HPI
- 335.0617
- Rent YoY
- ▼ -0.83%
- Metro
- San Diego-Chula Vista-Carlsbad, CA
- State GDP YoY
- ▲ 3.21%
- F500 in state
- 116
Industry mix (Fortune 500 HQ in CA)
| Industry | F500 HQs | Revenue |
|---|---|---|
| Technology | 27 | $1,492B |
|
||
| Financial Services | 3 | $174B |
|
||
| Retail | 3 | $44B |
|
||
| Insurance | 3 | $26B |
|
||
| Media / Entertainment | 2 | $115B |
|
||
| Pharmaceuticals / Biotech | 2 | $62B |
|
||
Price history
+297.8% since first listed11 events — show timeline
- 2026-05-12 Price Changed $89,500 CRMLS
- 2026-03-28 Listed $98,000 CRMLS
- 2012-10-02 Listing Removed — SDMLS
- 2012-10-02 Listing Removed — CRMLS
- 2012-09-19 Price Changed $22,500 SDMLS
- 2012-08-31 Price Changed $23,000 SDMLS
- 2012-06-19 Relisted — SDMLS
- 2012-06-12 Pending — SDMLS
- 2012-04-11 Price Changed $23,500 SDMLS
- 2012-04-04 Listed $25,000 SDMLS
- 2012-04-04 Listed $22,500 CRMLS
Cash-flow waterfall
monthlySold comps — $/sqft
last 12 mo · ≤1 miLoading sold comps…