2800 NE 14th St · Pompano Beach, FL
Flood risk No data
- FEMA flood zone
- —
- Chance of flooding over 30 yrs
- —
- Est. flood insurance / yr
- —
Fire risk No data
- Est. fire insurance / yr
- —
Heat risk No data
- Hot days now (above threshold)
- —
- Hot days in 30 yrs
- —
Wind risk No data
- Chance of severe wind over 30 yrs
- —
Air-quality risk No data
- Unhealthy air days now
- —
- Unhealthy air days in 30 yrs
- —
Risk factors via First Street. Map © Google.
Why this score? — see what drove the D grade
The composite is a weighted blend of 9 inputs, each scored 0–100. Each bar is that input's sub-score; the figure is the points it added to the 100-point composite (weight × sub-score).
- Cash flow +13.0/30.0
- ARV discount +7.5/15.0
- Schools +4.1/10.0
- DSCR +3.9/10.0
- Condition / age +3.8/5.0
- 1% rule +3.7/10.0
- Livability +3.7/5.0
- Rent growth +2.4/5.0
- Appreciation +0.0/10.0
$315,000
🖨 Deal sheet (PDF) 📄 Offer letter ✓ Due diligence
Listing remarks
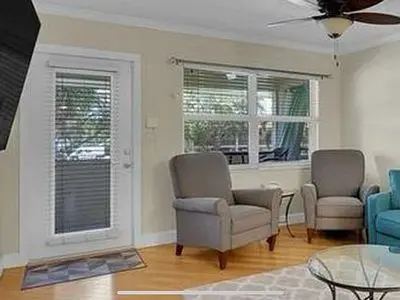
Welcome to the Beach! CAN RENT IMMEDIATELY!!! Three bedroom two bathroom WATERFRONT condo. Cute end unit close to the beach. Hardwood floors in living area and carpeted bedrooms. Two full bath. All hurricane windows and doors. Large screened lanai. Dock space when available
Key facts
- Waterfront condo
- Dock space
- Large screened lanai
Tags
Neighborhood map
What this means for you Summary
Snapshot
- This is a 3-bed/2.0-bath other listed at $315k. Condition is rated good.
Deal economics
- At list price, monthly cash flow is $-16 ($-196/yr) — negative.
- To cash-flow at today's rent, offer at most $313k (0.7% below list).
- To meet the 1% rule (rent ≥ 1% of price), the offer needs to be $273k (13.2% below list).
- Recommended offer: $273k (13.2% below list) — sets the bar for 1% rule.
- Cap rate 6.2% vs local median 3.1% in Pompano Beach — top-decile yield for the area; either an underpriced asset or a hidden risk that comps aren't pricing in. Stress-test before assuming the spread holds.
Location & tenants
- Location reads 74/100 on livability (#284 in FL, #4,541 nationally) — a middle-class / working-renter tenant base. Strengths: commute A+, housing A+, cost of living B+; Watch: employment D+, amenities F.
- Broward (suburban): math 42% / reading 53% proficiency, ranked #46 of 73 in FL (top 63%) — families likely to look elsewhere, expect single-tenant / working-renter base with shorter leases.
- Zoned schools: Nova Blanche Forman Elementary (math 35% / reading 55%, grade D-, #1,271 of 2,144 statewide, top 60%, 769 students, 72% FRL); Nova Middle School (math 44% / reading 53%, grade C-, #274 of 571 statewide, top 50%, 1,284 students, 68% FRL); Nova High School (math 22% / reading 56%, grade F, #312 of 667 statewide, top 48%, 2,227 students, 59% FRL) — zoned schools average 66% FRL vs 51% district-wide (15 pts higher); higher-poverty schools than district average — tighter screening recommended.
- Market conditions: Rents soft (-0.4%/yr); 851 active listings in the ZIP; 40 comparable units currently listed for rent nearby; rentals at typical pace (median 27d on market — plan ~3-4 weeks tenant-placement turnaround); solid renter incomes; 2,111 units permitted in Broward County in 2024 (1,265 in 5+ unit buildings).
- This rent runs 39% of the median local income ($84k/yr) — at the standard rent-burdened threshold; future hikes will face affordability resistance.
Forward outlook
- Local home prices are declining (-3.0%/yr); year-one equity from $2k of loan paydown is wiped out by about $9k of value loss. Plan a longer hold.
- Broward County population projected at +34% by 2050 — long-run rental-demand tailwind backs the buy-and-hold thesis.
Negotiation context
- It's been on market 26 days — a 2% lower offer ($310k) is reasonable based on typical stale-listing flexibility.
Questions for the listing agent
- What do current leases actually rent for vs. the listed asking? Can we see a recent rent roll and the last 12 months of T-12 income?
- Is there a deadline driving the sale (1031 exchange, divorce, estate, relocation)? That informs how much negotiation room exists.
- Schools are D-rated, which usually means shorter tenancies and higher turnover. Who's the typical renter profile here, and what's been the actual vacancy rate?
- The area grade is low — what's the realistic commute time and amenity access for the typical tenant pool here? Any planned neighborhood developments (good or bad) we should know about?
- What's the average days-on-market for RENTAL listings here right now (not sales)? A rising rental-DOM trend means longer vacancies and softer asking-rent achievability than the comps imply.
- What's the recent tenant-quality profile in this submarket — average credit score on applications, eviction rate, late-payment / NSF rate, and stable-employment percentage? A property-management company in the area should have these aggregated.
- How much new for-sale + rental construction is in the pipeline within 1–3 miles? Heavy new supply typically softens prices + rents 12–24 months out; constrained supply supports both.
Investment metrics
- 1% rule
- 0.87% ✗
- Cap rate
- 6.23%
- Cash-on-cash
- -0.22%
- DSCR
- 0.99
- GRM
- 9.6
CMA / ARV
No comps found within radius.
Projected returns pro-forma
-3.0% appreciation · 0.0% rent growth · sell at horizon
- IRR
- -20.1%
- Equity multiple
- 0.32×
- Total profit
- $-60,056
- Equity at exit
- $46,968
- IRR
- -21.4%
- Equity multiple
- 0.04×
- Total profit
- $-84,440
- Equity at exit
- $27,235
Cash invested: $88,200 (down + closing). Projections, not guarantees.
Landlord ↔ Tenant lean methodology
- Overall (STATE)
- 87 Strongly Landlord-Friendly
- State Florida
- 87 Strongly Landlord-Friendly · R+3
- County
- — inherits STATE
- City
- — inherits STATE
ZIP-level market 33062
- Rents YoY
- -0.4%
- Active inventory
- 851
- Price-to-rent
- 9.6×
Monthly cashflow live
- Estimated rent
- $2,735 high interval (Pro) →
- Mortgage (P&I)
- −$1,652
- Tax est. 1.5%
- −$394 /mo · $4,725/yr
- Insurance
- −$131
- HOA
- −$0
- Vacancy / Maint / Mgmt
- −$574
- Net cashflow
- $-16
Break-even live
Sensitivity live
| Price | -10% $201 | -5% $93 | +0% $-16 | +5% $-125 | +10% $-234 |
|---|---|---|---|---|---|
| Rent | -10% $-232 | -5% $-124 | +0% $-16 | +5% $92 | +10% $200 |
| Rate | -1.0pp $142 | -0.5pp $64 | base $-16 | +0.5pp $-98 | +1.0pp $-181 |
UW: 25.0% down · 7.5% · 30yr · 1.5% tax · 5.0% vac · 8.0% maint · 8.0% mgmt
Financing live
Cash to close
- Down payment
- $78,750
- Closing costs
- $9,450
- Reserves months
- —
- Total cash needed
- —
Loan-product check · same deal, 3 products live
Conventional
25% down · 7.5% · 30yr
- Down + closing
- —
- Monthly P&I
- —
- Monthly cashflow
- —
- DSCR
- —
- Eligible?
- —
Personal DTI + credit; lowest rate.
DSCR
20% down · 8.5% · 30yr
- Down + closing
- —
- Monthly P&I
- —
- Monthly cashflow
- —
- DSCR
- —
- Eligible?
- —
No personal income docs; deal must DSCR.
Hard money
10% down · 12.0% · 12mo
- Down + closing
- —
- Monthly P&I
- —
- Monthly cashflow
- —
- DSCR
- —
- Eligible?
- —
Short-term bridge; refi at stabilization.
Rent comps 40 comps
| Address | Beds | Baths | Sqft | Rent | $/sqft | DOM | Units | Dist |
|---|---|---|---|---|---|---|---|---|
| 2731 NE 14th St Unit 812 Pompano Beach, FL | 2.0 | 2.0 | 980 | $2,250 | $2.30 | 22d | 1 | 0.06mi |
| 1340 NE 28th Ave Pompano Beach, FL | 2.0 | 2.0 | 1065 | $2,450 | $2.30 | 26d | 2 | 0.07mi |
| 1340 NE 28th Ave Pompano Beach, FL | 2.0 | 2.0 | 1064 | $2,450 | $2.30 | 13d | 2 | 0.07mi |
| 1340 NE 28th Ave Pompano Beach, FL | 2.0 | 2.0 | 1064 | $2,450 | $2.30 | 12d | 2 | 0.07mi |
| 2731 NE 14th Street Cswy #103 Pompano Beach, FL | 2.0 | 2.0 | 980 | $2,195 | $2.24 | 26d | 1 | 0.07mi |
| 2731 NE 14th Street Cswy #205 Pompano Beach, FL | 2.0 | 2.0 | 1100 | $2,000 | $1.82 | 26d | 1 | 0.07mi |
| 1340 NE 28th Ave #242 Pompano Beach, FL | 2.0 | 2.0 | 1065 | $2,800 | $2.63 | 24d | 1 | 0.07mi |
| 2850 NE 14th Street Cswy Unit 210B Pompano Beach, FL | 2.0 | 2.0 | 894 | $1,900 | $2.13 | 26d | 1 | 0.09mi |
| 2850 NE 14th Street Cswy Unit 308b Pompano Beach, FL | 2.0 | 2.0 | 835 | $2,200 | $2.63 | 26d | 1 | 0.09mi |
| 2731 NE 14th Street Cswy #421 Pompano Beach, FL | 2.0 | 2.0 | 980 | $2,400 | $2.45 | 26d | 1 | 0.10mi |
| 2845 NE 15th St Pompano Beach, FL | 2.0 | 2.5 | 1008 | $2,450 | $2.43 | 26d | 1 | 0.10mi |
| 2855 NE 15th St #2855 Pompano Beach, FL | 2.0 | 2.5 | 1008 | $2,700 | $2.68 | 21d | 1 | 0.12mi |
| 2879 NE 15th St Pompano Beach, FL | 2.0 | 2.5 | 1018 | $2,650 | $2.60 | 6d | 1 | 0.15mi |
| 2683 NE 15th St #2683 Pompano Beach, FL | 2.0 | 2.0 | 1008 | $2,800 | $2.78 | 24d | 1 | 0.20mi |
| 1311 NE 26th Ter Pompano Beach, FL | 3.0 | 2.0 | 1248 | $6,500 | $5.21 | 26d | 1 | 0.22mi |
| 1211 NE 27th Ave Pompano Beach, FL | 2.0 | 2.0 | 1438 | $2,900 | $2.02 | 26d | 1 | 0.26mi |
| 2589 NE 15th St Pompano Beach, FL | 2.0 | 2.5 | 1008 | $2,500 | $2.48 | 5d | 1 | 0.27mi |
| 2521 NE 15th St Pompano Beach, FL | 2.0 | 2.5 | 1008 | $2,500 | $2.48 | 10d | 1 | 0.30mi |
| 1401 N Riverside Dr Pompano Beach, FL | 1.0–2.0 | 1.0–2.0 | 903 | $3,650 | $4.04 | 1d | 2 | 0.30mi |
| 1401 N Riverside Dr Pompano Beach, FL | 1.0–2.0 | 1.0–2.0 | 971 | $4,200 | $4.33 | 24d | 4 | 0.30mi |
| 1505 N Riverside Dr Pompano Beach, FL | 2.0 | 2.0 | 1069 | $2,750 | $2.57 | 0d | 2 | 0.33mi |
| 1505 N Riverside Dr Pompano Beach, FL | 2.0 | 2.0 | 1069 | $2,700 | $2.53 | 26d | 4 | 0.33mi |
| 2350 NE 14th Street Cswy Pompano Beach, FL | 2.0 | 2.0 | 1080 | $1,950 | $1.81 | 26d | 1 | 0.33mi |
| 1450 N Riverside Dr Pompano Beach, FL | 1.0–2.0 | 1.0–2.0 | 931 | $3,000 | $3.22 | 5d | 2 | 0.35mi |
| 999 N Riverside Dr Pompano Beach, FL | 1.0–2.0 | 1.0–2.0 | 975 | $2,700 | $2.77 | 15d | 2 | 0.35mi |
| 3220 NE 15th St Pompano Beach, FL | 2.0 | 1.0 | 750 | $2,995 | $3.99 | 26d | 1 | 0.38mi |
| 3249 NE 10th St Pompano Beach, FL | 2.0 | 2.0 | 800 | $3,500 | $4.38 | 26d | 1 | 0.43mi |
| 3201 NE 8th St #206 Pompano Beach, FL | 2.0 | 2.0 | 1100 | $2,500 | $2.27 | 14d | 1 | 0.44mi |
| 1009 N Ocean Blvd #401 Pompano Beach, FL | 2.0 | 1.5 | 942 | $2,500 | $2.65 | 26d | 1 | 0.45mi |
| 1100 NE 25th Ave Pompano Beach, FL | 2.0 | 2.0 | 1000 | $2,300 | $2.30 | 26d | 1 | 0.46mi |
| 2611 NE 20th St Pompano Beach, FL | 2.0 | 1.0 | 910 | $3,600 | $3.96 | 26d | 1 | 0.47mi |
| 1012 N Ocean Blvd #602 Pompano Beach, FL | 2.0 | 2.0 | 1310 | $3,200 | $2.44 | 26d | 1 | 0.50mi |
| 801 N Ocean Blvd #802 Pompano Beach, FL | 2.0 | 2.0 | 933 | $2,400 | $2.57 | 26d | 1 | 0.51mi |
| 801 N Ocean Blvd #802 Pompano Beach, FL | 2.0 | 2.0 | 933 | $2,300 | $2.47 | 15d | 1 | 0.51mi |
| 1500 N Ocean Blvd Pompano Beach, FL | 2.0 | 2.0 | 1325 | $5,250 | $3.96 | 14d | 2 | 0.52mi |
| 1630 N Ocean Blvd #314 Pompano Beach, FL | 2.0 | 2.0 | 975 | $2,900 | $2.97 | 26d | 1 | 0.53mi |
| 900 N Ocean Blvd Pompano Beach, FL | 1.0–3.0 | 1.5–3.5 | 1834 | $18,500 | $10.09 | 7d | 6 | 0.54mi |
| 1060 NE 23rd Ter Pompano Beach, FL | 2.0 | 2.0 | 1150 | $1,975 | $1.72 | 26d | 1 | 0.54mi |
| 1021 NE 24th Ave #12 Pompano Beach, FL | 2.0 | 1.0 | 763 | $1,700 | $2.23 | 26d | 1 | 0.55mi |
| 750 N Ocean Blvd Pompano Beach, FL | 2.0 | 2.0 | 1140 | $3,900 | $3.42 | 26d | 3 | 0.56mi |
Listing history 14 events
-
2026-06-21days on market $315,000 Active 26 DOM
-
2026-06-18days on market $315,000 Active 23 DOM
-
2026-06-17days on market $315,000 Active 22 DOM
-
2026-06-16days on market $315,000 Active 21 DOM
-
2026-06-15days on market $315,000 Active 20 DOM
-
2026-06-13days on market $315,000 Active 18 DOM
-
2026-06-09days on market $315,000 Active 14 DOM
-
2026-06-07days on market $315,000 Active 12 DOM
-
2026-06-04days on market $315,000 Active 9 DOM
-
2026-06-03days on market $315,000 Active 8 DOM
-
2026-06-02days on market $315,000 Active 7 DOM
-
2026-06-01days on market $315,000 Active 6 DOM
-
2026-05-31days on market $315,000 Active 5 DOM
-
2026-05-26$315,000 Active
ⓘ Source: listings_history table (triggers on properties + properties_extension) + one-shot
backfill from property_details.listing_events for pre-trigger history.
Nearby sold comps map
Loading sold comps map…
Walkable amenities ~0.75 mi
Loading nearby amenities…
Taxation est. · year 1
- Rental income
- $32,819
- − Mortgage interest
- −$17,645
- − Property taxes
- −$4,725
- − Insurance
- −$1,575
- − Repairs & maintenance
- −$2,626
- − Management
- −$2,626
- − Depreciation
- −$9,164
- Taxable loss
- −$5,541
- Est. tax savings @ 24.0%
- +$1,330
- After-tax cash flow
- $1,134/yr
For passive investors: Depreciation is non-cash, so a rental often shows a tax loss while cash-flowing — sheltering income. Rental losses are passive: they offset passive income freely, and up to $25,000/yr can offset ordinary (W-2) income if you actively participate and your MAGI is under $100k (phasing out to $0 by $150k); unused losses carry forward. On sale, claimed depreciation is recaptured at up to 25%, and gains may owe capital-gains tax (a 1031 exchange can defer both). Figures are a year-1 estimate at your 24.0% rate — not tax advice; consult a CPA.
Condition & rehab AI · 1 photo
This waterfront condo is in good condition with fresh paint and hardwood floors. It requires minor touch-ups and updates to the kitchen and bathrooms to maximize its resale and rental value.
Value-add opportunities
- Both Paint touch-ups — Fresh paint enhances curb appeal and interior aesthetics
- Both Landscaping — Landscaping improves curb appeal and enhances the waterfront view
- Both HVAC maintenance — Ensures comfort and energy efficiency
- Both Kitchen and bathroom updates — Modernizing these spaces can significantly increase value
Renovation cost estimate screening
Value-add ROI direction
- Both Paint touch-ups — Fresh paint enhances curb appeal and interior aesthetics ↑
- Both Landscaping — Landscaping improves curb appeal and enhances the waterfront view ↑
- Both HVAC maintenance — Ensures comfort and energy efficiency ↑
- Both Kitchen and bathroom updates — Modernizing these spaces can significantly increase value ↑
ⓘ Cost ranges are severity-bucket heuristics (US national rule-of-thumb). Get contractor quotes + a written scope before underwriting a rehab budget.
Schools (NCES district)
- District
- Broward
- NCES district ID
- 1200180
- Math proficiency
- 42% ▼ -18.00%
- Reading proficiency
- 53% ▼ -5.00%
- Median HH income
- $52,139
- Composite
- 40.88/100
- National rank
- #3621
- State rank
- #46 of 73 in FL
Livability — Pompano Beach
- Score
- 74/100
- State rank
- #284
- US rank
- #4541
Category grades
Schools grade is shown separately in the Schools card above.
Census & demographics
- Census place
- Pompano Beach, FL
- County
- Broward County · 1,963,430 people
- City population
- 155,861
- Metro
- Miami-Fort Lauderdale-Pompano Beach, FL
- Population (ZIP)
- 24,920
- Household income
- $83,582
- Rent vs Own
- Severe rent burden
- 1298.0
Population outlook (Broward County) Hauer SSP2
- Today (2025)
- 2,207,033 people
- By 2030
- 2,360,704 · +7.0%
- By 2040
- 2,661,208 · +20.6%
- By 2050
- 2,946,698 · +33.5%
- By 2075
- 3,602,273 · +63.2%
- By 2100
- 3,970,984 · +79.9%
Race, ethnicity, and origin ACS 2023
- Neighborhood character
- Predominantly White (76%)
- Race & ethnicity
- White 76% Hispanic / Latino 16% Two or more races 12% Black 3%
- Hispanic origin (detail)
- Puerto Rican 4% Cuban 3%
- Common ancestry
- Romanian 4% Italian 3% Scotch-Irish 2%
- Foreign-born
- 22% · Canada, Jamaica, Dominican Republic
- Languages at home
- 74% English-only · Spanish 14% Other Indo-European 4% Russian/Polish/Slavic 2%
Political lean MEDSL · Broward
- 2024 margin
- D (+17.0) · D 58.0% · R 41.0%
- 2008→2024 swing
- -17.8pp toward R · 2008: 34.7pp · 2024: 17.0pp
- All cycles
- 2024: D+17.0 2020: D+29.8 2016: D+35.0 2012: D+34.9 2008: D+34.7
Not yet ingested
- Civics
- —
Market trends
- HPI YoY
- ▼ -427.01%
- Current HPI
- 342.9461
- Rent YoY
- ▼ -0.36%
- Metro
- Miami-Fort Lauderdale-Pompano Beach, FL
- State GDP YoY
- ▲ 3.28%
- F500 in state
- 36
Industry mix (Fortune 500 HQ in FL)
| Industry | F500 HQs | Revenue |
|---|---|---|
| Industrial Technology | 2 | $29B |
|
||
| Insurance | 2 | $17B |
|
||
| Retail | 1 | $60B |
|
||
| Technology Distribution | 1 | $58B |
|
||
| Homebuilding | 1 | $35B |
|
||
| Technology Manufacturing | 1 | $35B |
|
||
Price history
1 event — show timeline
- 2026-05-26 Listed $315,000 FSBO.com
Cash-flow waterfall
monthlySold comps — $/sqft
last 12 mo · ≤1 miLoading sold comps…