310 Old Chatham Rd Unit A-21 · South Dennis, MA
Flood risk 1/10 · Minimal
- FEMA flood zone
- X (unshaded)
- Chance of flooding over 30 yrs
- 0.0%
- Est. flood insurance / yr
- $507 – $1,088
Fire risk 3/10 · Minor
- Est. fire insurance / yr
- $915 – $1,699
Heat risk 5/10 · Moderate
- Hot days now (above 85°F)
- 7 days/yr
- Hot days in 30 yrs
- 20 days/yr
Wind risk 8/10 · Major
- Chance of severe wind over 30 yrs
- 80.0%
Air-quality risk 2/10 · Minimal
- Unhealthy air days now
- 2 days/yr
- Unhealthy air days in 30 yrs
- 2 days/yr
Risk factors via First Street. Map © Google.
Why this score? — see what drove the B+ grade
The composite is a weighted blend of 9 inputs, each scored 0–100. Each bar is that input's sub-score; the figure is the points it added to the 100-point composite (weight × sub-score).
- Cash flow +30.0/30.0
- ARV discount +12.7/15.0
- 1% rule +10.0/10.0
- DSCR +10.0/10.0
- Condition / age +3.8/5.0
- Schools +3.2/10.0
- Livability +3.2/5.0
- Rent growth +2.5/5.0
- Appreciation +0.0/10.0
$72,900
🖨 Deal sheet 📄 Offer letter ✓ Due diligence
Listing remarks MLS
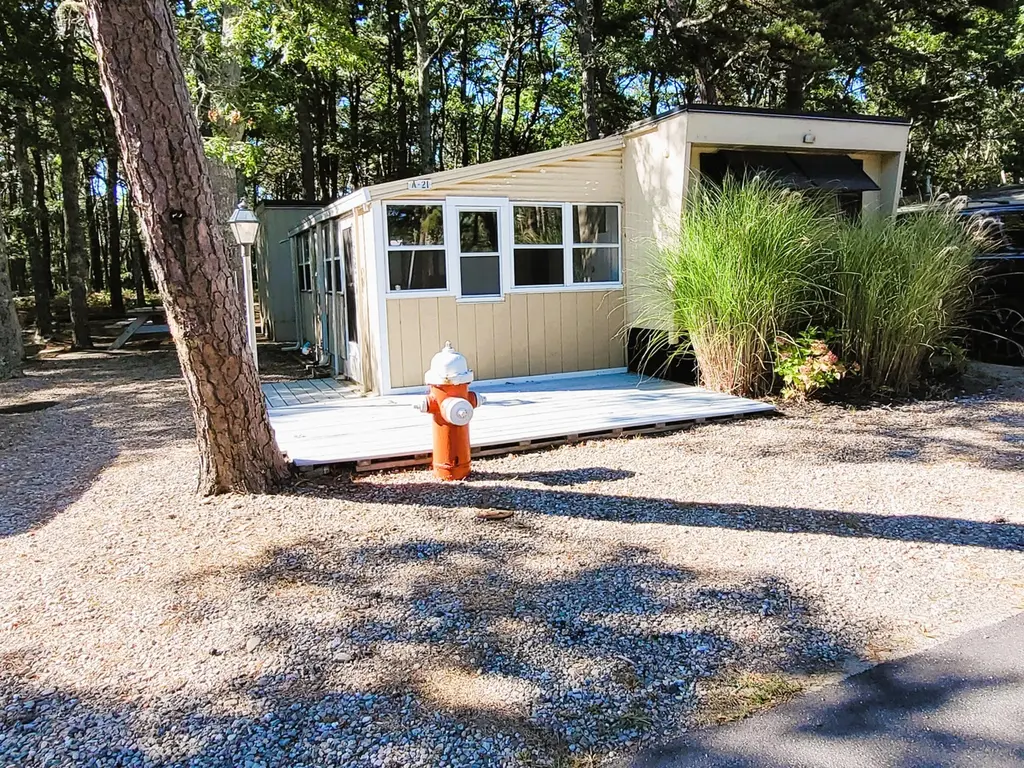
Beware: ZILLOW adds WRONG info to listings-NO RENTALS allowed in this park. NO YEAR ROUND LIVING // 3-Bedroom seasonal home for sale in Old Chatham Resort, Dennis, Cape Cod. Set on a spacious Elite lot that backs up to the woods, it has a great yard & plenty of space on the stone parking area. Summer only: May 1st to Oct. 31st, Recently updated kitchen with New soft close kitchen cabinets, newer bathroom, new interior paint throughout. The site also has a front deck, a side patio with an extra large custom made picnic table that stays, an outdoor shower, a huge backyard and a firepit. Being sold furnished (with a few exceptions). Old Chatham resort has great amenities: beautiful pool, new playground, basketball, Volleyball, horseshoe & bocci courts, clubhouse/game room & picnic area. Annual fees will be $9,996.00 for 2026 for the buyer. Fees incl. lease of land, sewer, water, taxes, daily trash pick-up, amenities & on site management. Pets are allowed with some restrictions. NO FINANCING available for seasonal park, cash sale only by bill of sale. All buyers must get park approval (Cori background check) prior to closing.
Key facts
- Front deck
- Newer bathroom
- Spacious lot
Tags
Neighborhood map
What this means for you Summary
Snapshot
- This is a 3-bed/1.0-bath single-family listed at $73k. Condition is rated good.
Deal economics
- At list price, monthly cash flow is $896 ($11k/yr) — positive.
- The deal already cash-flows at list — no discount required.
- Meets the 1% rule at list price ($2k rent vs $73k).
- Recommended offer: $69k (6.0% below list) — sets the bar for market timing.
- Cap rate 21.0% vs local median 2.1% in South Dennis — top-decile yield for the area; either an underpriced asset or a hidden risk that comps aren't pricing in. Stress-test before assuming the spread holds.
Location & tenants
- Location reads 65/100 on livability (#183 in MA) — a middle-class / working-renter tenant base. Strengths: crime A+, health & safety A, employment A-; Watch: schools D+, amenities F, commute F.
- Dennis-Yarmouth (suburban): math 31% / reading 42% proficiency, ranked #222 of 302 in MA (top 74%) — families likely to look elsewhere, expect single-tenant / working-renter base with shorter leases.
- Market conditions: 28 active listings in the ZIP; 657 units permitted in Barnstable County in 2024 (178 in 5+ unit buildings).
Forward outlook
- Local home prices are declining (-3.0%/yr); year-one equity from $504 of loan paydown is wiped out by about $2k of value loss. Plan a longer hold.
- Barnstable County population projected at -20% by 2050 — secular population decline; favor cash flow + early exit over multi-decade hold.
- At projected returns (-3.0% appreciation + 3.0% rent growth), your $20k cash investment doubles in ~3 years — after that, you're playing with house money.
Negotiation context
- It's been on market 83 days — a 6% lower offer ($69k) is reasonable based on typical stale-listing flexibility.
- 4 sale attempts since 3y ago with the ask held roughly flat each time — persistent listings suggest the price (not the market) is what's stuck; bring a comps-based counter.
Risks & watch-outs
- Climate carrying-cost: severe wind risk, 80% chance of damaging wind over 30y; extreme-heat days projected 7→20/yr by 2055 (HVAC capex compounding) — expect insurance premiums to compound above CPI over the hold.
Questions for the listing agent
- It's been on market 83 days. Have you received any prior offers? Is the seller open to a 6% concession, seller financing, or rate buy-down credit?
- Built in 1974 — when were the roof, HVAC, electrical panel, plumbing, and water heater last replaced?
- Why hasn't it sold? Are there any deal-killer items the seller is aware of (foundation, flood, title, zoning, code violations)?
- Is there a deadline driving the sale (1031 exchange, divorce, estate, relocation)? That informs how much negotiation room exists.
- Schools are D-rated, which usually means shorter tenancies and higher turnover. Who's the typical renter profile here, and what's been the actual vacancy rate?
- What's the average days-on-market for RENTAL listings here right now (not sales)? A rising rental-DOM trend means longer vacancies and softer asking-rent achievability than the comps imply.
- What's the recent tenant-quality profile in this submarket — average credit score on applications, eviction rate, late-payment / NSF rate, and stable-employment percentage? A property-management company in the area should have these aggregated.
- How much new for-sale + rental construction is in the pipeline within 1–3 miles? Heavy new supply typically softens prices + rents 12–24 months out; constrained supply supports both.
Investment metrics
- 1% rule
- 2.43% ✓
- Cap rate
- 21.05%
- Cash-on-cash
- 52.69%
- DSCR
- 3.34
- GRM
- 3.4
CMA / ARV
- ARV (median comp)
- $82,500
- List price
- $72,900
- Delta
- -11.64%
- Verdict
- UNDERPRICED
- Comps
- 3 within 1.0 mi
Show comp detail 1 sale within ~0.75 mi
| Address | Dist | Beds/Ba | Sqft | Sold | Price | $/sf | Match |
|---|---|---|---|---|---|---|---|
| 19 Hickory Ln | 0.71mi | 2/1.0 (-1) | 816 (+12%) | 12mo | $380,000 | $466 | 31 |
Match score weights: distance 35% · size 25% · config 20% · recency 20%. Top-matched comps best support the ARV.
Projected returns pro-forma
-3.0% appreciation · 3.0% rent growth · sell at horizon
- IRR
- 50.7%
- Equity multiple
- 3.22×
- Total profit
- $45,298
- Equity at exit
- $10,870
- IRR
- 56.1%
- Equity multiple
- 6.54×
- Total profit
- $113,059
- Equity at exit
- $6,303
Cash invested: $20,412 (down + closing). Projections, not guarantees.
Landlord ↔ Tenant lean methodology
- Overall (STATE)
- 20 Strongly Tenant-Friendly
- State Massachusetts
- 20 Strongly Tenant-Friendly · D+15
- County
- — inherits STATE
- City
- — inherits STATE
ZIP-level market 02660
- Home prices YoY
- -25.4%
- Active inventory
- 28
- Price-to-rent
- 3.4×
Monthly cashflow live
- Estimated rent
- $1,772 medium interval (Pro) →
- Mortgage (P&I)
- −$382
- Tax est. 1.5%
- −$91 /mo · $1,094/yr
- Insurance
- −$30
- HOA
- −$0
- Vacancy / Maint / Mgmt
- −$372
- Net cashflow
- $896
Break-even live
UW: 25.0% down · 7.5% · 30yr · 1.5% tax · 5.0% vac · 8.0% maint · 8.0% mgmt
Financing live
Cash to close
- Down payment
- $18,225
- Closing costs
- $2,187
- Reserves months
- —
- Total cash needed
- —
Loan-product check · same deal, 3 products live
Conventional
25% down · 7.5% · 30yr
- Down + closing
- —
- Monthly P&I
- —
- Monthly cashflow
- —
- DSCR
- —
- Eligible?
- —
Personal DTI + credit; lowest rate.
DSCR
20% down · 8.5% · 30yr
- Down + closing
- —
- Monthly P&I
- —
- Monthly cashflow
- —
- DSCR
- —
- Eligible?
- —
No personal income docs; deal must DSCR.
Hard money
10% down · 12.0% · 12mo
- Down + closing
- —
- Monthly P&I
- —
- Monthly cashflow
- —
- DSCR
- —
- Eligible?
- —
Short-term bridge; refi at stabilization.
Listing history 28 events
-
2026-06-19days on market $72,900 Active 83 DOM
-
2026-06-18days on market $72,900 Active 82 DOM
-
2026-06-17days on market $72,900 Active 81 DOM
-
2026-06-16days on market $72,900 Active 80 DOM
-
2026-06-15days on market $72,900 Active 79 DOM
-
2026-06-14days on market $72,900 Active 77 DOM
-
2026-06-12days on market $72,900 Active 76 DOM
-
2026-06-09days on market $72,900 Active 73 DOM
-
2026-06-08days on market $72,900 Active 72 DOM
-
2026-06-07days on market $72,900 Active 71 DOM
-
2026-06-04days on market $72,900 Active 67 DOM
-
2026-06-02days on market $72,900 Active 66 DOM
-
2026-06-01days on market $72,900 Active 65 DOM
-
2026-05-31days on market $72,900 Active 64 DOM
-
2026-05-31days on market $72,900 Active 63 DOM
-
2026-03-28$72,900 Active 1157-char remark
Show marketing remark (1157 chars)
Beware: ZILLOW adds WRONG info to listings-NO RENTALS allowed in this park. NO YEAR ROUND LIVING // 3-Bedroom seasonal home for sale in Old Chatham Resort, Dennis, Cape Cod. Set on a spacious Elite lot that backs up to the woods, it has a great yard & plenty of space on the stone parking area. Summer only: May 1st to Oct. 31st, Recently updated kitchen with New soft close kitchen cabinets, newer bathroom, new interior paint throughout. The site also has a front deck, a side patio with an extra large custom made picnic table that stays, an outdoor shower, a huge backyard and a firepit. Being sold furnished (with a few exceptions). Old Chatham resort has great amenities: beautiful pool, new playground, basketball, Volleyball, horseshoe & bocci courts, clubhouse/game room & picnic area. Annual fees will be $9,996.00 for 2026 for the buyer. Fees incl. lease of land, sewer, water, taxes, daily trash pick-up, amenities & on site management. Pets are allowed with some restrictions. NO FINANCING available for seasonal park, cash sale only by bill of sale. All buyers must get park approval (Cori background check) prior to closing.
-
2026-01-31historical
-
2025-12-02status Active
-
2025-11-13historical
-
2025-10-01price $72,900
-
2025-09-27price $73,500
-
2025-09-16price $74,500
-
2025-09-04price $74,900
-
2025-08-22$75,900 Active
-
2023-08-14soldstatus $77,450 Closed
-
2023-08-10status Pending
-
2023-07-29price $79,900
-
2023-07-03$89,900 Active
ⓘ Source: listings_history table (triggers on properties + properties_extension) + one-shot
backfill from property_details.listing_events for pre-trigger history.
Climate risk First Street
- Flood 1/10 Low FEMA zone X (unshaded) · 0% chance over 30 yrs
- Wildfire 3/10 Moderate
- Heat 5/10 Major 7 d/yr ≥85°F today · 20 d/yr by 30 yrs out
- Wind 8/10 Severe 80% chance of damaging wind over 30 yrs
- Air quality 2/10 Low 2 unhealthy d/yr today · 2 by 30 yrs out
Nearby sold comps map
Loading sold comps map…
Walkable amenities ~0.75 mi
Loading nearby amenities…
Taxation est. · year 1
- Rental income
- $21,267
- − Mortgage interest
- −$4,084
- − Property taxes
- −$1,094
- − Insurance
- −$364
- − Repairs & maintenance
- −$1,701
- − Management
- −$1,701
- − Depreciation
- −$2,121
- Taxable income
- $10,202
- Est. tax owed @ 24.0%
- −$2,448
- After-tax cash flow
- $8,307/yr
For passive investors: Depreciation is non-cash, so a rental often shows a tax loss while cash-flowing — sheltering income. Rental losses are passive: they offset passive income freely, and up to $25,000/yr can offset ordinary (W-2) income if you actively participate and your MAGI is under $100k (phasing out to $0 by $150k); unused losses carry forward. On sale, claimed depreciation is recaptured at up to 25%, and gains may owe capital-gains tax (a 1031 exchange can defer both). Figures are a year-1 estimate at your 24.0% rate — not tax advice; consult a CPA.
Condition & rehab AI · 12 photos
This single-family home in Old Chatham Resort, Dennis, Cape Cod, is in good condition with recent updates and a spacious outdoor area. It is move-in ready and offers a great value for both resale and rental.
Value-add opportunities
- Both Landscaping improvements — Enhances curb appeal and outdoor living space.
- Both Painting exterior — Fresh paint improves curb appeal and home value.
- Both Landscaping and fire pit cleaning — Maintains outdoor living space and enhances curb appeal.
Renovation cost estimate screening
Value-add ROI direction
- Both Landscaping improvements — Enhances curb appeal and outdoor living space. ↑
- Both Painting exterior — Fresh paint improves curb appeal and home value. ↑
- Both Landscaping and fire pit cleaning — Maintains outdoor living space and enhances curb appeal. ↑
ⓘ Cost ranges are severity-bucket heuristics (US national rule-of-thumb). Get contractor quotes + a written scope before underwriting a rehab budget.
Schools (NCES district)
- District
- Dennis-Yarmouth
- NCES district ID
- 2504140
- Math proficiency
- 31% ▼ -11.00%
- Reading proficiency
- 42% ▼ -2.00%
- Median HH income
- $54,049
- Composite
- 31.94/100
- National rank
- #5845
- State rank
- #222 of 302 in MA
Livability — South Dennis
- Score
- 65/100
- State rank
- #183
- US rank
- #12692
Category grades
Schools grade is shown separately in the Schools card above.
Census & demographics
- Census place
- South Dennis, MA
- City population
- 6,767
- Population (ZIP)
- 6,767
Population outlook (Barnstable County) Hauer SSP2
- Today (2025)
- 208,497 people
- By 2030
- 202,530 · -2.9%
- By 2040
- 184,936 · -11.3%
- By 2050
- 167,489 · -19.7%
- By 2075
- 144,938 · -30.5%
- By 2100
- 117,312 · -43.7%
Race, ethnicity, and origin ACS 2023
- Neighborhood character
- Predominantly White (92%)
- Race & ethnicity
- White 92% Hispanic / Latino 3% Black 2% Two or more races 1%
- Common ancestry
- Slovak 7% Lithuanian 5% Romanian 3%
- Foreign-born
- 4% · Canada
- Languages at home
- 97% English-only · Other Indo-European 1% Spanish 1% French/Haitian/Cajun 1%
Political lean MEDSL · Barnstable
- 2024 margin
- Strong D (+20.8) · D 59.6% · R 38.9% · Other 1.5%
- 2008→2024 swing
- +6.7pp toward D · 2008: 14.0pp · 2024: 20.8pp
- All cycles
- 2024: D+20.8 2020: D+24.4 2016: D+13.4 2012: D+7.6 2008: D+14.0
Not yet ingested
- Civics
- —
Market trends
- HPI YoY
- ▼ -125.70%
- Current HPI
- 368.8683
- Rent YoY
- —
- Metro
- —
- State GDP YoY
- ▲ 2.28%
- F500 in state
- 38
Industry mix (Fortune 500 HQ in MA)
| Industry | F500 HQs | Revenue |
|---|---|---|
| Technology | 3 | $17B |
|
||
| Insurance | 2 | $84B |
|
||
| Retail | 2 | $76B |
|
||
| Life Sciences | 1 | $43B |
|
||
| Energy Technology | 1 | $31B |
|
||
| Aerospace / Defense | 1 | $18B |
|
||
Price history
-18.9% since first listed13 events — show timeline
- 2026-03-28 Listed $72,900 CCIMLS
- 2026-01-31 Listing Removed — CCIMLS
- 2025-12-02 Relisted — CCIMLS
- 2025-11-13 Listing Removed — CCIMLS
- 2025-10-01 Price Changed $72,900 CCIMLS
- 2025-09-27 Price Changed $73,500 CCIMLS
- 2025-09-16 Price Changed $74,500 CCIMLS
- 2025-09-04 Price Changed $74,900 CCIMLS
- 2025-08-22 Listed $75,900 CCIMLS
- 2023-08-14 Sold (MLS) $77,450 CCIMLS
- 2023-08-10 Pending — CCIMLS
- 2023-07-29 Price Changed $79,900 CCIMLS
- 2023-07-03 Listed $89,900 CCIMLS
Cash-flow waterfall
monthlySold comps — $/sqft
last 12 mo · ≤1 miLoading sold comps…