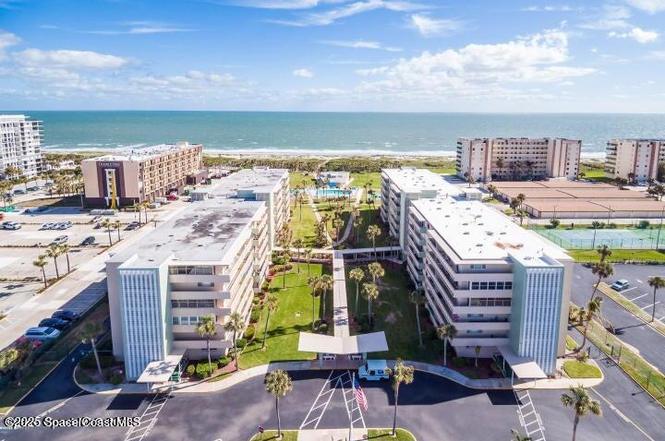
2020 N Atlantic Ave Unit 112-S · Cocoa Beach, FL
Flood risk 5/10 · Moderate
- FEMA flood zone
- X (unshaded)
- Chance of flooding over 30 yrs
- 0.45%
- Est. flood insurance / yr
- $507 – $1,088
Fire risk 1/10 · Minimal
- Est. fire insurance / yr
- $947 – $1,759
Heat risk 10/10 · Severe
- Hot days now (above 104°F)
- 7 days/yr
- Hot days in 30 yrs
- 24 days/yr
Wind risk 10/10 · Severe
- Chance of severe wind over 30 yrs
- 99.0%
Air-quality risk 1/10 · Minimal
- Unhealthy air days now
- 0 days/yr
- Unhealthy air days in 30 yrs
- 0 days/yr
Risk factors via First Street. Map © Google.
Why this score? — see what drove the D grade
The composite is a weighted blend of 9 inputs, each scored 0–100. Each bar is that input's sub-score; the figure is the points it added to the 100-point composite (weight × sub-score).
- Cash flow +9.4/30.0
- ARV discount +7.5/15.0
- 1% rule +6.7/10.0
- Schools +4.7/10.0
- Livability +3.6/5.0
- Rent growth +3.5/5.0
- DSCR +2.6/10.0
- Condition / age +2.5/5.0
- Appreciation +0.0/10.0
$210,000
🖨 Deal sheet 📄 Offer letter ✓ Due diligence
Listing remarks
Ocean complex in great location with large heated pool, shuffleboard, pickleball and clubhouse. This 2 bedroom 1 1/2 bath condo is ready for you to make it your own. Well maintained grounds and short distance to restaurants and shopping.
Key facts
- Clubhouse
- Pickleball
- Shuffleboard
Tags
Property features AI
Finance
- HOA & community: Located in Twin Towers Condo association; Monthly association fee of $645; Association amenities include cable TV, car wash area, clubhouse, elevators, laundry, pickleball, shuffleboard court; Association fee covers cable TV, insurance, grounds maintenance, pest control, sewer, trash, and water
Exterior
- Parking: Detached carport (1 space); On-site parking lot
- Security: Secured lobby
- Utilities: Public sewer; Cable connected; Electricity connected; Water available and connected
- Home design: Condominium; South-facing entry; Entry level: 1; 6-story building
- Construction: Concrete construction
- Exterior features: Front and rear sprinklers; Oceanfront with ocean access
Interior
- Bedrooms: 2 bedrooms
- Bathrooms: 2 bathrooms (1 full, 1 half)
- Heating & cooling: Central heating (electric); Central air conditioning
- Interior features: Secured lobby
- Laundry & utility: Community laundry
Neighborhood map
What this means for you Summary
Snapshot
- This is a 2-bed/1.5-bath condo listed at $210k.
Deal economics
- At list price, monthly cash flow is $-151 ($-2k/yr) — negative.
- To cash-flow at today's rent, offer at most $183k (12.7% below list).
- Meets the 1% rule at list price ($2k rent vs $210k).
- Recommended offer: $183k (12.7% below list) — sets the bar for cash-flow.
Location & tenants
- Location reads 71/100 on livability (#398 in FL) — a middle-class / working-renter tenant base. Strengths: crime A+, housing A, employment B; Watch: cost of living C-, amenities F, commute F.
- Brevard (suburban): math 53% / reading 57% proficiency, ranked #19 of 73 in FL (top 26%) — acceptable for families but not a draw, mixed tenant base, ~2y average lease.
- Zoned schools: Cape View Elementary School (math 62% / reading 62%, grade B, #608 of 2,144 statewide, top 29%, 305 students, 61% FRL); Cocoa Beach Junior/Senior High School (math 65% / reading 66%, grade B, #75 of 667 statewide, top 11%, 982 students, 30% FRL) — zoned schools at 45% FRL track the district average.
- Market conditions: Rents rising fast (+4.1%/yr); 315 active listings in the ZIP; 33 comparable units currently listed for rent nearby; rentals at typical pace (median 24d on market — plan ~3-4 weeks tenant-placement turnaround); solid renter incomes; 4,602 units permitted in Brevard County in 2024 (702 in 5+ unit buildings).
- This rent runs 33% of the median local income ($89k/yr) — at the standard rent-burdened threshold; future hikes will face affordability resistance.
Forward outlook
- Local home prices are declining (-3.0%/yr); year-one equity from $1k of loan paydown is wiped out by about $6k of value loss. Plan a longer hold.
- Brevard County population projected at +15% by 2050 — modest demand growth; plan on rents tracking national, not racing it.
Negotiation context
- It's been on market 219 days — a 12% lower offer ($185k) is reasonable based on typical stale-listing flexibility.
- Current owner paid $40k; list at $210k implies a 419% gain — meaningful room to come down on a strong offer.
Risks & watch-outs
- Watch-outs: HOA is 26% of rent.
- Climate carrying-cost: moderate flood risk; severe wind risk, 99% chance of damaging wind over 30y; extreme-heat days projected 7→24/yr by 2055 (HVAC capex compounding) — expect insurance premiums to compound above CPI over the hold.
Questions for the listing agent
- What do current leases actually rent for vs. the listed asking? Can we see a recent rent roll and the last 12 months of T-12 income?
- It's been on market 219 days. Have you received any prior offers? Is the seller open to a 13% concession, seller financing, or rate buy-down credit?
- Built in 1964 — when were the roof, HVAC, electrical panel, plumbing, and water heater last replaced?
- What does the HOA fee cover, when was the last increase, and are there any pending special assessments or reserve-fund shortfalls?
- Any open or pending special assessments — roof, HVAC, plumbing, elevator, façade? What's the per-unit balance and payoff schedule, and is the seller paying it off at close or rolling it to the buyer?
- Why hasn't it sold? Are there any deal-killer items the seller is aware of (foundation, flood, title, zoning, code violations)?
- Is there a deadline driving the sale (1031 exchange, divorce, estate, relocation)? That informs how much negotiation room exists.
- Schools are A-rated — typically a magnet for longer-tenancy family renters. What's the average tenant stay here, and is there a school-zone premium baked into asking?
- The area grade is low — what's the realistic commute time and amenity access for the typical tenant pool here? Any planned neighborhood developments (good or bad) we should know about?
- What's the average days-on-market for RENTAL listings here right now (not sales)? A rising rental-DOM trend means longer vacancies and softer asking-rent achievability than the comps imply.
- What's the recent tenant-quality profile in this submarket — average credit score on applications, eviction rate, late-payment / NSF rate, and stable-employment percentage? A property-management company in the area should have these aggregated.
- How much new apartment / multifamily construction is in the pipeline within 1–3 miles? Heavy new supply (>2% of stock underway) typically softens rents 12–24 months out; light construction supports rent growth.
Investment metrics
- 1% rule
- 1.17% ✓
- Cap rate
- 5.43%
- Cash-on-cash
- -3.09%
- DSCR
- 0.86
- GRM
- 7.1
CMA / ARV
No comps found within radius.
Projected returns pro-forma
-3.0% appreciation · 4.07% rent growth · sell at horizon
- IRR
- -19.4%
- Equity multiple
- 0.31×
- Total profit
- $-40,568
- Equity at exit
- $31,312
- IRR
- -8.9%
- Equity multiple
- 0.41×
- Total profit
- $-34,809
- Equity at exit
- $18,157
Cash invested: $58,800 (down + closing). Projections, not guarantees.
Landlord ↔ Tenant lean methodology
- Overall (STATE)
- 87 Strongly Landlord-Friendly
- State Florida
- 87 Strongly Landlord-Friendly · R+3
- County
- — inherits STATE
- City
- — inherits STATE
ZIP-level market 32931
- Rents YoY
- 4.1%
- Active inventory
- 315
- Price-to-rent
- 7.1×
Monthly cashflow live
- Estimated rent
- $2,451 high interval (Pro) →
- Mortgage (P&I)
- −$1,101
- Tax from tax record
- −$254 /mo · $3,044/yr
- Insurance
- −$88
- HOA
- −$645
- Vacancy / Maint / Mgmt
- −$515
- Net cashflow
- $-151
Break-even live
UW: 25.0% down · 7.5% · 30yr · 1.5% tax · 5.0% vac · 8.0% maint · 8.0% mgmt
Financing live
Cash to close
- Down payment
- $52,500
- Closing costs
- $6,300
- Reserves months
- —
- Total cash needed
- —
Loan-product check · same deal, 3 products live
Conventional
25% down · 7.5% · 30yr
- Down + closing
- —
- Monthly P&I
- —
- Monthly cashflow
- —
- DSCR
- —
- Eligible?
- —
Personal DTI + credit; lowest rate.
DSCR
20% down · 8.5% · 30yr
- Down + closing
- —
- Monthly P&I
- —
- Monthly cashflow
- —
- DSCR
- —
- Eligible?
- —
No personal income docs; deal must DSCR.
Hard money
10% down · 12.0% · 12mo
- Down + closing
- —
- Monthly P&I
- —
- Monthly cashflow
- —
- DSCR
- —
- Eligible?
- —
Short-term bridge; refi at stabilization.
Rent comps 33 comps
| Address | Beds | Baths | Sqft | Rent | $/sqft | DOM | Units | Dist |
|---|---|---|---|---|---|---|---|---|
| 2020 N Atlantic Ave Unit 210N Cocoa Beach, FL | 2.0 | 2.0 | 816 | $2,150 | $2.63 | 13d | 1 | 0.02mi |
| 2020 N Atlantic Ave Unit 117S Cocoa Beach, FL | 2.0 | 2.0 | 912 | $2,300 | $2.52 | 23d | 1 | 0.02mi |
| 2020 N Atlantic Ave Unit 215N Cocoa Beach, FL | 1.0 | 1.0 | 816 | $1,950 | $2.39 | 23d | 1 | 0.02mi |
| 2020 N Atlantic Ave Unit 317S Cocoa Beach, FL | 2.0 | 2.0 | 912 | $2,800 | $3.07 | 23d | 1 | 0.02mi |
| 1830 N Atlantic Ave #205 Cocoa Beach, FL | 1.0 | 1.0 | 888 | $2,400 | $2.70 | 23d | 1 | 0.06mi |
| 2020 N Atlantic Ave #209 Cocoa Beach, FL | 2.0 | 1.5 | 816 | $2,100 | $2.57 | 23d | 1 | 0.11mi |
| 2100 N Atlantic Ave Cocoa Beach, FL | 1.0–2.0 | 1.0–2.5 | 1250 | $5,000 | $4.00 | 14d | 6 | 0.15mi |
| 3060 N Atlantic Ave Cocoa Beach, FL | 1.0–2.0 | 1.0–2.0 | 1284 | $2,900 | $2.26 | 21d | 4 | 0.27mi |
| 3060 N Atlantic Ave Cocoa Beach, FL | 1.0–2.0 | 1.0–2.0 | 1284 | $2,500 | $1.95 | 14d | 3 | 0.27mi |
| 3150 N Atlantic Ave Unit 770-3 Cocoa Beach, FL | 2.0 | 1.0 | 800 | $1,950 | $2.44 | 14d | 1 | 0.29mi |
| 3150 N Atlantic Ave Cocoa Beach, FL | 2.0 | 1.0 | 750 | $2,100 | $2.80 | 21d | 4 | 0.29mi |
| 770 Diplomat Blvd Unit 14 Good Vibes Condo Cocoa Beach, FL | 2.0 | 1.0 | 800 | $1,850 | $2.31 | 23d | 1 | 0.34mi |
| 1999 S Banana River Blvd #313 Cocoa Beach, FL | 2.0 | 2.0 | 1092 | $2,200 | $2.01 | 23d | 1 | 0.39mi |
| 3190 N Atlantic Ave Cocoa Beach, FL | 1.0–2.0 | 1.0 | 657 | $2,300 | $3.50 | 23d | 4 | 0.42mi |
| 3190 N Atlantic Ave Cocoa Beach, FL | 1.0–2.0 | 1.0 | 657 | $2,300 | $3.50 | 19d | 3 | 0.42mi |
| 325 S Banana River Blvd #209 Cocoa Beach, FL | 2.0 | 2.0 | 1014 | $2,500 | $2.47 | 23d | 1 | 0.42mi |
| 3500 Ocean Beach Blvd #2 Cocoa Beach, FL | 2.0 | 1.0 | 812 | $1,850 | $2.28 | 23d | 1 | 0.62mi |
| 199 Wakulla Ln #33 Cocoa Beach, FL | 2.0 | 1.0 | 725 | $1,700 | $2.34 | 23d | 1 | 0.68mi |
| 199 Wakulla Ln Unit 1044458P Cocoa Beach, FL | 2.0 | 1.0 | 721 | $3,876 | $5.38 | 19d | 1 | 0.68mi |
| 199 Wakulla Ln #29 Cocoa Beach, FL | 2.0 | 1.0 | 725 | $2,000 | $2.76 | 23d | 1 | 0.68mi |
| 3820 Ocean Beach Blvd Cocoa Beach, FL | 1.0 | 1.0 | 787 | $2,350 | $2.99 | 23d | 2 | 0.81mi |
| 3820 Ocean Beach Blvd #238 Cocoa Beach, FL | 1.0 | 1.0 | 787 | $3,000 | $3.81 | 14d | 1 | 0.82mi |
| 201 Saint Lucie Ln #201 Cocoa Beach, FL | 2.0 | 2.0 | 1030 | $1,750 | $1.70 | 23d | 1 | 0.84mi |
| 3799 S Banana River Blvd #612 Cocoa Beach, FL | 2.0 | 2.0 | 1058 | $2,400 | $2.27 | 14d | 1 | 0.89mi |
| 3799 S Banana River Blvd #505 Cocoa Beach, FL | 2.0 | 2.0 | 1058 | $1,950 | $1.84 | 23d | 1 | 0.89mi |
| 4105 Ocean Beach Blvd #121 Cocoa Beach, FL | 2.0 | 2.0 | 1101 | $2,000 | $1.82 | 23d | 1 | 0.93mi |
| 4100 Ocean Beach Blvd #307 Cocoa Beach, FL | 2.0 | 2.0 | 1101 | $2,450 | $2.23 | 23d | 1 | 0.93mi |
| 4100 Ocean Beach Blvd #406 Cocoa Beach, FL | 2.0 | 2.0 | 1101 | $2,500 | $2.27 | 23d | 1 | 0.93mi |
| 383 N Atlantic Ave #308 Cocoa Beach, FL | 2.0 | 2.0 | 1049 | $2,600 | $2.48 | 23d | 1 | 1.15mi |
| 333 N Atlantic Ave #207 Cocoa Beach, FL | 2.0 | 2.0 | 1100 | $2,800 | $2.55 | 14d | 1 | 1.19mi |
| 4700 Ocean Beach Blvd Cocoa Beach, FL | 2.0 | 2.0 | 1018 | $2,100 | $2.06 | 23d | 2 | 1.39mi |
| 171 N Atlantic Ave #39 Cocoa Beach, FL | 2.0 | 1.5 | 1088 | $2,700 | $2.48 | 23d | 1 | 1.44mi |
| 4800 Ocean Beach Blvd Cocoa Beach, FL | 2.0–3.0 | 2.0 | 1186 | $2,350 | $1.98 | 23d | 2 | 1.47mi |
HOA detail condo
- Monthly dues
- $645 · $7,740/yr
- Likely covers
- landscapingpool
- Assessments
- None detected in remarks — confirm with the listing agent.
Listing history 18 events
-
2026-06-18days on market $210,000 Active 219 DOM
-
2026-06-17days on market $210,000 Active 218 DOM
-
2026-06-16days on market $210,000 Active 217 DOM
-
2026-06-15days on market $210,000 Active 216 DOM
-
2026-06-14days on market $210,000 Active 214 DOM
-
2026-06-10days on market $210,000 Active 211 DOM
-
2026-06-08days on market $210,000 Active 209 DOM
-
2026-06-07days on market $210,000 Active 208 DOM
-
2026-06-05days on market $210,000 Active 205 DOM
-
2026-06-03days on market $210,000 Active 204 DOM
-
2026-06-02days on market $210,000 Active 203 DOM
-
2026-06-01days on market $210,000 Active 202 DOM
-
2026-05-31days on market $210,000 Active 201 DOM
-
2026-05-31days on market $210,000 Active 200 DOM
-
2026-04-21price $210,000
-
2026-02-05price $215,000
-
2025-11-10$225,000 Active
-
1978-08-01soldstatus $40,500
ⓘ Source: listings_history table (triggers on properties + properties_extension) + one-shot
backfill from property_details.listing_events for pre-trigger history.
Tax reassessment forecast FL · Resets to sale price
- Current annual tax
- $3,044 · $254/mo
- Projected year-2 tax
- $3,044 · $254/mo
- Expected delta
- $0/yr ($0/mo · 0.0%)
ⓘ Screening estimate from a state-policy table — verify with the county assessor before closing.
Climate risk First Street
- Flood 5/10 Major FEMA zone X (unshaded) · 45% chance over 30 yrs
- Wildfire 1/10 Low
- Heat 10/10 Extreme 7 d/yr ≥104°F today · 24 d/yr by 30 yrs out
- Wind 10/10 Extreme 99% chance of damaging wind over 30 yrs
- Air quality 1/10 Low 0 unhealthy d/yr today · 0 by 30 yrs out
Nearby sold comps map
Loading sold comps map…
Walkable amenities ~0.75 mi
Loading nearby amenities…
Taxation est. · year 1
- Rental income
- $29,410
- − Mortgage interest
- −$11,763
- − Property taxes
- −$3,044
- − Insurance
- −$1,050
- − Repairs & maintenance
- −$2,353
- − Management
- −$2,353
- − HOA
- −$7,740
- − Depreciation
- −$6,109
- Taxable loss
- −$5,002
- Est. tax savings @ 24.0%
- +$1,200
- After-tax cash flow
- $-615/yr
For passive investors: Depreciation is non-cash, so a rental often shows a tax loss while cash-flowing — sheltering income. Rental losses are passive: they offset passive income freely, and up to $25,000/yr can offset ordinary (W-2) income if you actively participate and your MAGI is under $100k (phasing out to $0 by $150k); unused losses carry forward. On sale, claimed depreciation is recaptured at up to 25%, and gains may owe capital-gains tax (a 1031 exchange can defer both). Figures are a year-1 estimate at your 24.0% rate — not tax advice; consult a CPA.
Schools (NCES district)
- District
- Brevard
- NCES district ID
- 1200150
- Math proficiency
- 53% ▼ -9.00%
- Reading proficiency
- 57% ▼ -4.00%
- Median HH income
- $49,426
- Composite
- 46.86/100
- National rank
- #2370
- State rank
- #19 of 73 in FL
Livability — Cocoa Beach
- Score
- 71/100
- State rank
- #398
- US rank
- #7077
Category grades
Schools grade is shown separately in the Schools card above.
Census & demographics
- Census place
- Cocoa Beach, FL
- County
- Brevard County · 602,871 people
- City population
- 14,174
- Metro
- Palm Bay-Melbourne-Titusville, FL
- Population (ZIP)
- 14,174
- Household income
- $89,457
- Rent vs Own
- Severe rent burden
- 445.0
Population outlook (Brevard County) Hauer SSP2
- Today (2025)
- 623,254 people
- By 2030
- 648,420 · +4.0%
- By 2040
- 690,009 · +10.7%
- By 2050
- 715,669 · +14.8%
- By 2075
- 775,744 · +24.5%
- By 2100
- 776,687 · +24.6%
Race, ethnicity, and origin ACS 2023
- Neighborhood character
- Predominantly White (87%)
- Race & ethnicity
- White 87% Two or more races 7% Hispanic / Latino 7% Black 2% Asian 1%
- Hispanic origin (detail)
- Mexican 1% Puerto Rican 2% Cuban 1% Dominican 1%
- Common ancestry
- Romanian 5% Lithuanian 4% Italian 3%
- Foreign-born
- 9% · Canada, Jamaica
- Languages at home
- 88% English-only · Spanish 5% Other Indo-European 3% Russian/Polish/Slavic 1%
Political lean MEDSL · Brevard
- 2024 margin
- Strong R (+20.8) · D 39.1% · R 59.9% · Other 1.0%
- 2008→2024 swing
- -10.4pp toward R · 2008: -10.4pp · 2024: -20.8pp
- All cycles
- 2024: R+20.8 2020: R+16.4 2016: R+19.8 2012: R+12.7 2008: R+10.4
Not yet ingested
- Civics
- —
Market trends
- HPI YoY
- ▼ -249.02%
- Current HPI
- 312.0196
- Rent YoY
- ▲ 4.07%
- Metro
- Palm Bay-Melbourne-Titusville, FL
- State GDP YoY
- ▲ 3.28%
- F500 in state
- 36
Industry mix (Fortune 500 HQ in FL)
| Industry | F500 HQs | Revenue |
|---|---|---|
| Industrial Technology | 2 | $29B |
|
||
| Insurance | 2 | $17B |
|
||
| Retail | 1 | $60B |
|
||
| Technology Distribution | 1 | $58B |
|
||
| Homebuilding | 1 | $35B |
|
||
| Technology Manufacturing | 1 | $35B |
|
||
Price history
+418.5% since first listed4 events — show timeline
- 2026-04-21 Price Changed $210,000 SCMLS
- 2026-02-05 Price Changed $215,000 SCMLS
- 2025-11-10 Listed $225,000 SCMLS
- 1978-08-01 Sold (Public Records) $40,500 Public Records
Property tax history
+6.6%/yrLatest (2025): $3,044 · -3.8% YoY. Source: county tax records.
Cash-flow waterfall
monthlySold comps — $/sqft
last 12 mo · ≤1 miLoading sold comps…