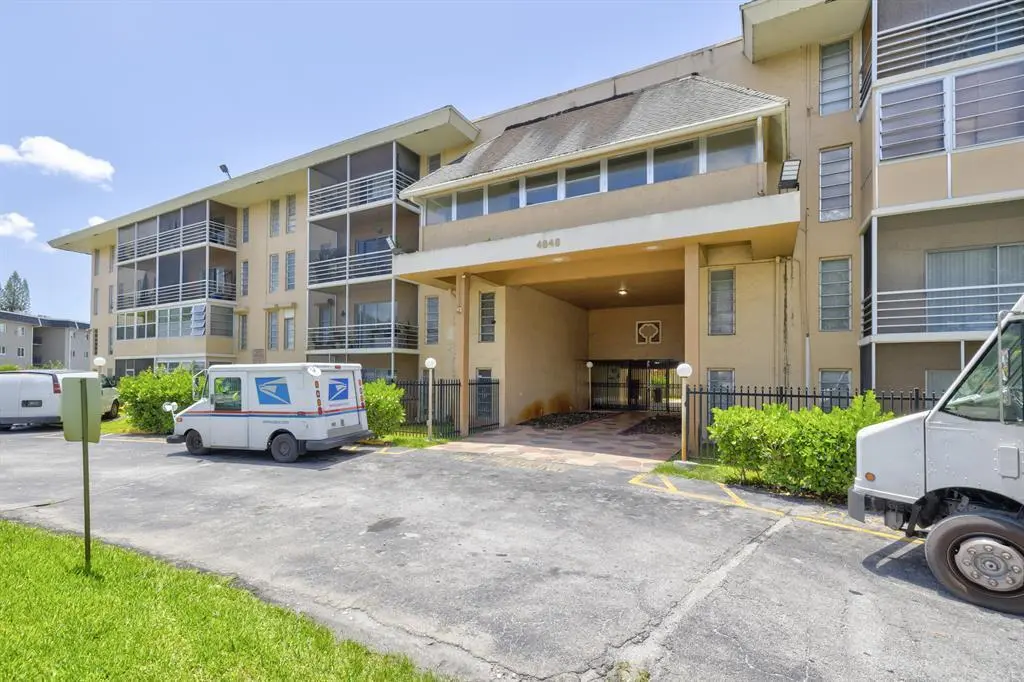
4848 NW 24th Ct #205 · Lauderdale Lakes, FL
Flood risk 1/10 · Minimal
- FEMA flood zone
- X (shaded)
- Chance of flooding over 30 yrs
- 0.0%
- Est. flood insurance / yr
- $507 – $1,088
Fire risk 1/10 · Minimal
- Est. fire insurance / yr
- $947 – $1,759
Heat risk 10/10 · Severe
- Hot days now (above 105°F)
- 7 days/yr
- Hot days in 30 yrs
- 26 days/yr
Wind risk 10/10 · Severe
- Chance of severe wind over 30 yrs
- 99.0%
Air-quality risk 3/10 · Minor
- Unhealthy air days now
- 3 days/yr
- Unhealthy air days in 30 yrs
- 3 days/yr
Risk factors via First Street. Map © Google.
Why this score? — see what drove the D grade
The composite is a weighted blend of 9 inputs, each scored 0–100. Each bar is that input's sub-score; the figure is the points it added to the 100-point composite (weight × sub-score).
- Cash flow +10.0/30.0
- 1% rule +8.8/10.0
- ARV discount +7.5/15.0
- Schools +4.1/10.0
- Livability +4.0/5.0
- DSCR +2.8/10.0
- Rent growth +2.6/5.0
- Condition / age +2.5/5.0
- Appreciation +0.0/10.0
$135,000
🖨 Deal sheet (PDF) 📄 Offer letter ✓ Due diligence
Listing remarks
Brand new updated master bathroom finished in April, owner occupied whose ready to move at any moment in an all age occupied community.
Key facts
- $497 HOA
- Community pool
- Built 1974
Tags
Property features AI
Finance
- Other: Pets allowed (call for details)
- HOA & community: Association with monthly fee; Monthly HOA fee approximately $497; Community amenities include elevator(s), pool, gated entry; HOA covers insurance, structural maintenance, common areas, and roof repairs
Exterior
- Parking: No carport
- Security: Gated community
- Utilities: Public water; Public sewer; Electricity available
- Home design: Condominium; Resale condition; Faces northwest; 4 total stories; Living area approximately 1,240
- Construction: Block / CBS construction
- Exterior features: Not waterfront; Tile roof
Interior
- Kitchen: Gas range; Electric cooktop; Refrigerator; Garbage disposal
- Bedrooms: 2 bedrooms on the main level
- Flooring: Laminate flooring
- Bathrooms: 2 full bathrooms (main level)
- Heating & cooling: Central heating; Central air; Ceiling fans
- Interior features: Disposal; Electric water heater
- Laundry & utility: Washer hookup; Electric dryer hookup
Neighborhood map
What this means for you Summary
Snapshot
- This is a 2-bed/2.0-bath condo listed at $135k.
Deal economics
- At list price, monthly cash flow is $-82 ($-985/yr) — negative.
- To cash-flow at today's rent, offer at most $121k (10.7% below list).
- Meets the 1% rule at list price ($2k rent vs $135k).
- Recommended offer: $121k (10.7% below list) — sets the bar for cash-flow.
Location & tenants
- Location reads 81/100 on livability (#100 in FL, #1,527 nationally) — a professional / high-income tenant draw. Strengths: commute A+, cost of living A+, housing A+; Watch: crime D+, amenities F, employment F.
- Broward (suburban): math 42% / reading 53% proficiency, ranked #46 of 73 in FL (top 63%) — families likely to look elsewhere, expect single-tenant / working-renter base with shorter leases.
- Zoned schools: Castle Hill Elementary School (math 22% / reading 22%, grade F, #2,080 of 2,144 statewide, top 97%, 562 students, 86% FRL); Boyd H. Anderson High School (math 10% / reading 14%, grade F, #622 of 667 statewide, top 93%, 2,038 students, 72% FRL) — zoned schools average 79% FRL vs 51% district-wide (28 pts higher); higher-poverty schools than district average — tighter screening recommended.
- Zoned-school proficiency averages 17% at this address vs 48% district-wide (-30 pts) — the specific schools serving this property underperform the Broward average; the district grade overstates school quality for this exact location.
- Market conditions: Rents flat; 656 active listings in the ZIP; 40 comparable units currently listed for rent nearby; rentals at typical pace (median 22d on market — plan ~3-4 weeks tenant-placement turnaround); 2,111 units permitted in Broward County in 2024 (1,265 in 5+ unit buildings).
- At $1,857/mo this rent would consume 48% of the median local household income ($46k/yr) (locally 5692% of renters already pay >50% of income on rent) — very limited rent-growth headroom before tenants either downsize or default.
Forward outlook
- Local home prices are declining (-3.0%/yr); year-one equity from $933 of loan paydown is wiped out by about $4k of value loss. Plan a longer hold.
- Broward County population projected at +34% by 2050 — long-run rental-demand tailwind backs the buy-and-hold thesis.
Negotiation context
- It's been on market 34 days — a 3% lower offer ($131k) is reasonable based on typical stale-listing flexibility.
- Current owner paid $40k; list at $135k implies a 238% gain — meaningful room to come down on a strong offer.
Risks & watch-outs
- Watch-outs: property tax is 2.6% of price; HOA is 27% of rent.
- Climate carrying-cost: severe wind risk, 99% chance of damaging wind over 30y; extreme-heat days projected 7→26/yr by 2055 (HVAC capex compounding) — expect insurance premiums to compound above CPI over the hold.
Questions for the listing agent
- What do current leases actually rent for vs. the listed asking? Can we see a recent rent roll and the last 12 months of T-12 income?
- It's been on market 34 days. Have you received any prior offers? Is the seller open to a 11% concession, seller financing, or rate buy-down credit?
- Built in 1974 — when were the roof, HVAC, electrical panel, plumbing, and water heater last replaced?
- Property tax is high relative to price — has the assessment been appealed recently, and will the sale trigger a re-assessment?
- What does the HOA fee cover, when was the last increase, and are there any pending special assessments or reserve-fund shortfalls?
- Any open or pending special assessments — roof, HVAC, plumbing, elevator, façade? What's the per-unit balance and payoff schedule, and is the seller paying it off at close or rolling it to the buyer?
- Is there a deadline driving the sale (1031 exchange, divorce, estate, relocation)? That informs how much negotiation room exists.
- Crime grade is D in this area — have there been break-ins, vandalism, or insurance claims at this property in the last 3 years? What carrier currently insures it and at what premium?
- The area grade is low — what's the realistic commute time and amenity access for the typical tenant pool here? Any planned neighborhood developments (good or bad) we should know about?
- What's the average days-on-market for RENTAL listings here right now (not sales)? A rising rental-DOM trend means longer vacancies and softer asking-rent achievability than the comps imply.
- What's the recent tenant-quality profile in this submarket — average credit score on applications, eviction rate, late-payment / NSF rate, and stable-employment percentage? A property-management company in the area should have these aggregated.
- How much new apartment / multifamily construction is in the pipeline within 1–3 miles? Heavy new supply (>2% of stock underway) typically softens rents 12–24 months out; light construction supports rent growth.
Investment metrics
- 1% rule
- 1.38% ✓
- Cap rate
- 5.56%
- Cash-on-cash
- -2.61%
- DSCR
- 0.88
- GRM
- 6.1
CMA / ARV
No comps found within radius.
Projected returns pro-forma
-3.0% appreciation · 0.26% rent growth · sell at horizon
- IRR
- -25.7%
- Equity multiple
- 0.16×
- Total profit
- $-31,680
- Equity at exit
- $20,129
- IRR
- -49.9%
- Equity multiple
- -0.38×
- Total profit
- $-52,026
- Equity at exit
- $11,672
Cash invested: $37,800 (down + closing). Projections, not guarantees.
Landlord ↔ Tenant lean methodology
- Overall (STATE)
- 87 Strongly Landlord-Friendly
- State Florida
- 87 Strongly Landlord-Friendly · R+3
- County
- — inherits STATE
- City
- — inherits STATE
ZIP-level market 33313
- Rents YoY
- 0.3%
- Active inventory
- 656
- Price-to-rent
- 6.1×
Monthly cashflow live
- Estimated rent
- $1,857 high interval (Pro) →
- Mortgage (P&I)
- −$708
- Tax from tax record
- −$288 /mo · $3,459/yr
- Insurance
- −$56
- HOA
- −$497
- Vacancy / Maint / Mgmt
- −$390
- Net cashflow
- $-82
Break-even live
Sensitivity live
| Price | -10% $-6 | -5% $-44 | +0% $-82 | +5% $-120 | +10% $-158 |
|---|---|---|---|---|---|
| Rent | -10% $-229 | -5% $-155 | +0% $-82 | +5% $-9 | +10% $65 |
| Rate | -1.0pp $-14 | -0.5pp $-48 | base $-82 | +0.5pp $-117 | +1.0pp $-153 |
UW: 25.0% down · 7.5% · 30yr · 1.5% tax · 5.0% vac · 8.0% maint · 8.0% mgmt
Financing live
Cash to close
- Down payment
- $33,750
- Closing costs
- $4,050
- Reserves months
- —
- Total cash needed
- —
Loan-product check · same deal, 3 products live
Conventional
25% down · 7.5% · 30yr
- Down + closing
- —
- Monthly P&I
- —
- Monthly cashflow
- —
- DSCR
- —
- Eligible?
- —
Personal DTI + credit; lowest rate.
DSCR
20% down · 8.5% · 30yr
- Down + closing
- —
- Monthly P&I
- —
- Monthly cashflow
- —
- DSCR
- —
- Eligible?
- —
No personal income docs; deal must DSCR.
Hard money
10% down · 12.0% · 12mo
- Down + closing
- —
- Monthly P&I
- —
- Monthly cashflow
- —
- DSCR
- —
- Eligible?
- —
Short-term bridge; refi at stabilization.
Rent comps 40 comps
| Address | Beds | Baths | Sqft | Rent | $/sqft | DOM | Units | Dist |
|---|---|---|---|---|---|---|---|---|
| 4848 NW 24th Ct Lauderdale Lakes, FL | 2.0–3.0 | 2.0 | 1230 | $1,800 | $1.46 | 25d | 2 | 0.03mi |
| 4848 NW 24th Ct Lauderdale Lakes, FL | 1.0–3.0 | 1.0–2.0 | 1045 | $1,725 | $1.65 | 17d | 3 | 0.03mi |
| 4848 NW 24th Ct Lauderdale Lakes, FL | 1.0–3.0 | 1.0–2.0 | 1045 | $1,675 | $1.60 | 6d | 4 | 0.03mi |
| 4750 NW 22nd Ct #502 Lauderhill, FL | 1.0 | 1.5 | 928 | $1,600 | $1.72 | 25d | 1 | 0.17mi |
| 2240 NW 51st Ave Lauderhill, FL | 2.0 | 2.0 | 1385 | $3,400 | $2.45 | 21d | 1 | 0.18mi |
| 4851 NW 21st St Unit 2P Lauderhill, FL | 1.0 | 1.5 | 1074 | $1,400 | $1.30 | 25d | 1 | 0.21mi |
| 2306 NW 52nd Ave Lauderhill, FL | 2.0 | 1.5 | 1020 | $1,900 | $1.86 | 17d | 1 | 0.27mi |
| 2060 NW 48th Ter Lauderhill, FL | 1.0–2.0 | 1.0–2.0 | 886 | $1,595 | $1.80 | 8d | 2 | 0.27mi |
| 2410 NW 52nd Ave #2410 Lauderhill, FL | 2.0 | 1.5 | 1020 | $1,700 | $1.67 | 6d | 1 | 0.28mi |
| 2410 NW 52nd Ave #2410 Lauderhill, FL | 2.0 | 1.5 | 1020 | $1,700 | $1.67 | 14d | 1 | 0.28mi |
| 4740 NW 21st St Lauderhill, FL | 1.0 | 1.5 | 1003 | $1,575 | $1.57 | 20d | 2 | 0.28mi |
| 4851 NW 26th Ct #338 Lauderdale Lakes, FL | 1.0 | 1.0 | 705 | $1,650 | $2.34 | 17d | 1 | 0.30mi |
| 2713 NW 47th Ter #504 Lauderdale Lakes, FL | 2.0 | 1.0 | 1133 | $1,700 | $1.50 | 2d | 1 | 0.31mi |
| 2061 NW 47th Ter Lauderhill, FL | 1.0 | 1.5 | 928 | $1,620 | $1.75 | 4d | 2 | 0.32mi |
| 2512 NW 52nd Ave Unit 22B Lauderhill, FL | 2.0 | 1.5 | 940 | $1,700 | $1.81 | 18d | 1 | 0.33mi |
| 5314 NW 24th St #143 Lauderhill, FL | 2.0 | 1.0 | 829 | $1,995 | $2.41 | 21d | 1 | 0.35mi |
| 2552 NW 52nd Ave Unit B19 Lauderhill, FL | 2.0 | 1.5 | 940 | $1,900 | $2.02 | 4d | 1 | 0.35mi |
| 5323 NW 24th St #118 Lauderhill, FL | 2.0 | 1.0 | 829 | $1,550 | $1.87 | 25d | 1 | 0.37mi |
| 5321 NW 21st Ct Lauderhill, FL | 2.0 | 1.0 | 750 | $1,900 | $2.53 | 25d | 1 | 0.37mi |
| 5405 NW 23rd St #187 Lauderhill, FL | 2.0 | 1.0 | 829 | $1,850 | $2.23 | 4d | 1 | 0.38mi |
| 2606 NW 52nd Ave Unit D15 Lauderhill, FL | 2.0 | 1.5 | 1020 | $1,950 | $1.91 | 25d | 1 | 0.38mi |
| 2604 NW 52nd Ave Unit C15 Lauderhill, FL | 2.0 | 1.5 | 940 | $1,800 | $1.91 | 25d | 1 | 0.38mi |
| 5411 NW 22nd St Unit 5411 Lauderhill, FL | 2.0 | 1.0 | 850 | $2,050 | $2.41 | 13d | 1 | 0.39mi |
| 5411 NW 22nd St Unit 5411 Lauderhill, FL | 2.0 | 1.0 | 850 | $2,050 | $2.41 | 6d | 1 | 0.39mi |
| 5415 NW 22nd St #5415 Lauderhill, FL | 2.0 | 1.0 | 936 | $2,150 | $2.30 | 25d | 1 | 0.40mi |
| 2029 NW 46th Ave Lauderhill, FL | 1.0 | 1.5 | 800 | $1,500 | $1.88 | 25d | 1 | 0.42mi |
| 2017 NW 46th Ave Unit A110 Lauderhill, FL | 1.0 | 1.5 | 800 | $1,650 | $2.06 | 25d | 1 | 0.42mi |
| 5223 NW 27th St Unit 9B Fort Lauderdale, FL | 2.0 | 1.5 | 940 | $1,750 | $1.86 | 25d | 1 | 0.46mi |
| 5231 NW 27th St Unit 8A Lauderhill, FL | 2.0 | 1.5 | 1020 | $1,900 | $1.86 | 25d | 1 | 0.46mi |
| 2800 NW 47th Ter Unit 106B Lauderdale Lakes, FL | 1.0 | 1.0 | 768 | $1,650 | $2.15 | 25d | 1 | 0.47mi |
| 4361 NW 25th Pl Lauderhill, FL | 3.0 | 1.0 | 1284 | $2,395 | $1.87 | 2d | 1 | 0.48mi |
| 4361 NW 25th Pl Lauderhill, FL | 3.0 | 1.0 | 1284 | $2,495 | $1.94 | 17d | 1 | 0.48mi |
| 2861 NW 47th Ter Lauderdale Lakes, FL | 2.0 | 2.0 | 1021 | $1,700 | $1.67 | 25d | 1 | 0.49mi |
| 2861 NW 47th Ter Unit 207B Lauderdale Lakes, FL | 1.0 | 1.0 | 768 | $1,400 | $1.82 | 25d | 1 | 0.49mi |
| 3001 NW 48th Ave #440 Lauderdale Lakes, FL | 1.0 | 1.5 | 705 | $1,300 | $1.84 | 25d | 1 | 0.51mi |
| 2427 NW 55th Ter Unit 2427 Lauderhill, FL | 2.0 | 1.0 | 849 | $2,400 | $2.83 | 25d | 1 | 0.52mi |
| 2101 NW 55th Ave Lauderhill, FL | 2.0 | 2.0 | 900 | $1,949 | $2.17 | 2d | 8 | 0.53mi |
| 2814 NW 55th Ave Unit 1B Lauderhill, FL | 2.0 | 2.0 | 1070 | $1,800 | $1.68 | 25d | 1 | 0.54mi |
| 2916 NW 55th Ave Unit 2A Lauderhill, FL | 2.0 | 2.0 | 1060 | $2,200 | $2.08 | 8d | 1 | 0.55mi |
| 2914 NW 55th Ave Unit 1D Lauderhill, FL | 1.0 | 1.5 | 840 | $1,600 | $1.90 | 18d | 1 | 0.56mi |
HOA detail condo
- Monthly dues
- $497 · $5,964/yr
- Assessments
- None detected in remarks — confirm with the listing agent.
Listing history 17 events
-
2026-06-18days on market $135,000 Active 34 DOM
-
2026-06-17pricedays on market $135,000 Active 33 DOM
-
2026-06-16days on market $140,000 Active 32 DOM
-
2026-06-15days on market $140,000 Active 31 DOM
-
2026-06-13days on market $140,000 Active 29 DOM
-
2026-06-09days on market $140,000 Active 25 DOM
-
2026-06-08days on market $140,000 Active 24 DOM
-
2026-06-07days on market $140,000 Active 23 DOM
-
2026-06-04days on market $140,000 Active 20 DOM
-
2026-06-03days on market $140,000 Active 19 DOM
-
2026-06-02days on market $140,000 Active 18 DOM
-
2026-06-01days on market $140,000 Active 17 DOM
-
2026-05-31days on market $140,000 Active 16 DOM
-
2026-05-14$140,000 Active
-
1998-08-04soldstatus $39,900
-
1988-03-25soldstatus $32,500
-
1988-03-01soldstatus $32,500
ⓘ Source: listings_history table (triggers on properties + properties_extension) + one-shot
backfill from property_details.listing_events for pre-trigger history.
Tax reassessment forecast FL · Resets to sale price
- Current annual tax
- $3,459 · $288/mo
- Projected year-2 tax
- $3,459 · $288/mo
- Expected delta
- $0/yr ($0/mo · 0.0%)
ⓘ Screening estimate from a state-policy table — verify with the county assessor before closing.
Climate risk First Street
- Flood 1/10 Low FEMA zone X (shaded) · 0% chance over 30 yrs
- Wildfire 1/10 Low
- Heat 10/10 Extreme 7 d/yr ≥105°F today · 26 d/yr by 30 yrs out
- Wind 10/10 Extreme 99% chance of damaging wind over 30 yrs
- Air quality 3/10 Moderate 3 unhealthy d/yr today · 3 by 30 yrs out
Nearby sold comps map
Loading sold comps map…
Walkable amenities ~0.75 mi
Loading nearby amenities…
Taxation est. · year 1
- Rental income
- $22,290
- − Mortgage interest
- −$7,562
- − Property taxes
- −$3,459
- − Insurance
- −$675
- − Repairs & maintenance
- −$1,783
- − Management
- −$1,783
- − HOA
- −$5,964
- − Depreciation
- −$3,927
- Taxable loss
- −$2,864
- Est. tax savings @ 24.0%
- +$687
- After-tax cash flow
- $-297/yr
For passive investors: Depreciation is non-cash, so a rental often shows a tax loss while cash-flowing — sheltering income. Rental losses are passive: they offset passive income freely, and up to $25,000/yr can offset ordinary (W-2) income if you actively participate and your MAGI is under $100k (phasing out to $0 by $150k); unused losses carry forward. On sale, claimed depreciation is recaptured at up to 25%, and gains may owe capital-gains tax (a 1031 exchange can defer both). Figures are a year-1 estimate at your 24.0% rate — not tax advice; consult a CPA.
Schools (NCES district)
- District
- Broward
- NCES district ID
- 1200180
- Math proficiency
- 42% ▼ -18.00%
- Reading proficiency
- 53% ▼ -5.00%
- Median HH income
- $52,139
- Composite
- 40.88/100
- National rank
- #3621
- State rank
- #46 of 73 in FL
Livability — Lauderdale Lakes
- Score
- 81/100
- State rank
- #100
- US rank
- #1527
Category grades
Schools grade is shown separately in the Schools card above.
Census & demographics
- Census place
- Lauderdale Lakes, FL
- County
- Broward County · 1,963,430 people
- Metro
- Miami-Fort Lauderdale-Pompano Beach, FL
- Population (ZIP)
- 62,807
- Household income
- $46,305
- Rent vs Own
- Severe rent burden
- 5692.0
Population outlook (Broward County) Hauer SSP2
- Today (2025)
- 2,207,033 people
- By 2030
- 2,360,704 · +7.0%
- By 2040
- 2,661,208 · +20.6%
- By 2050
- 2,946,698 · +33.5%
- By 2075
- 3,602,273 · +63.2%
- By 2100
- 3,970,984 · +79.9%
Race, ethnicity, and origin ACS 2023
- Neighborhood character
- Predominantly Black (77%)
- Race & ethnicity
- Black 77% Hispanic / Latino 12% Two or more races 8% White 7% Asian 2%
- Hispanic origin (detail)
- Puerto Rican 2% Cuban 3% Dominican 1%
- Common ancestry
- Hispanic 20%
- Foreign-born
- 39% · Canada, Jamaica, Dominican Republic
- Languages at home
- 66% English-only · French/Haitian/Cajun 22% Spanish 10%
Political lean MEDSL · Broward
- 2024 margin
- D (+17.0) · D 58.0% · R 41.0%
- 2008→2024 swing
- -17.8pp toward R · 2008: 34.7pp · 2024: 17.0pp
- All cycles
- 2024: D+17.0 2020: D+29.8 2016: D+35.0 2012: D+34.9 2008: D+34.7
Not yet ingested
- Civics
- —
Market trends
- HPI YoY
- ▼ -338.15%
- Current HPI
- 288.9345
- Rent YoY
- ▲ 0.26%
- Metro
- Miami-Fort Lauderdale-Pompano Beach, FL
- State GDP YoY
- ▲ 3.28%
- F500 in state
- 36
Industry mix (Fortune 500 HQ in FL)
| Industry | F500 HQs | Revenue |
|---|---|---|
| Industrial Technology | 2 | $29B |
|
||
| Insurance | 2 | $17B |
|
||
| Retail | 1 | $60B |
|
||
| Technology Distribution | 1 | $58B |
|
||
| Homebuilding | 1 | $35B |
|
||
| Technology Manufacturing | 1 | $35B |
|
||
Price history
+330.8% since first listed4 events — show timeline
- 2026-05-14 Listed $140,000 Beaches MLS
- 1998-08-04 Sold (Public Records) $39,900 Public Records
- 1988-03-25 Sold (Public Records) $32,500 Public Records
- 1988-03-01 Sold (Public Records) $32,500 Public Records
Property tax history
+22.7%/yrLatest (2025): $3,459 · +936.2% YoY. Source: county tax records.
Cash-flow waterfall
monthlySold comps — $/sqft
last 12 mo · ≤1 miLoading sold comps…