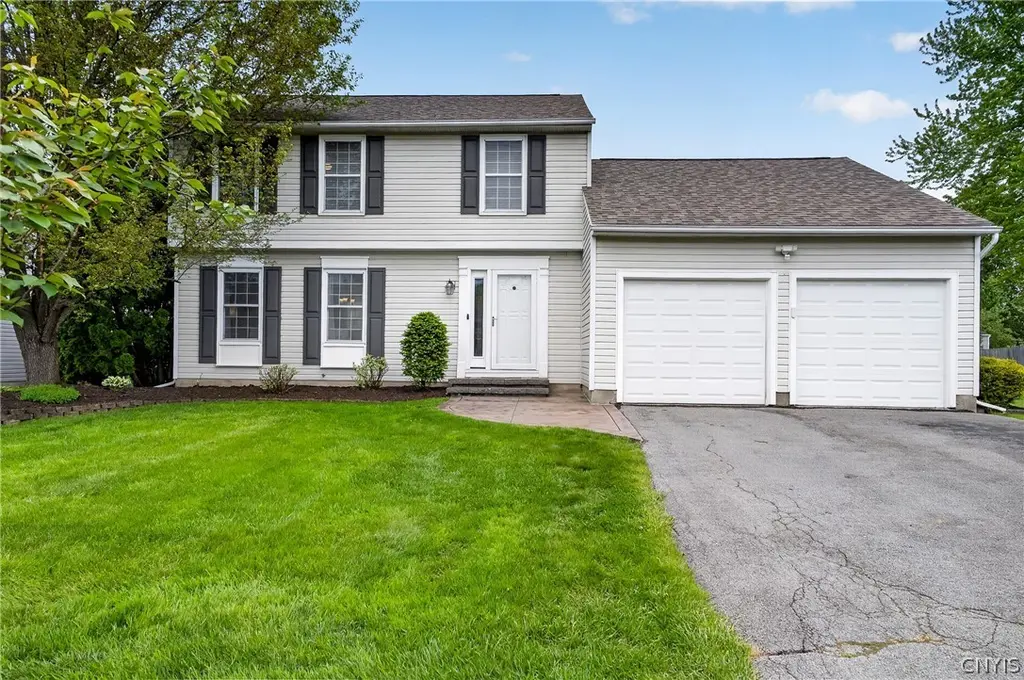
6143 Palisades Dr · North Syracuse, NY
Flood risk 1/10 · Minimal
- FEMA flood zone
- X (unshaded)
- Chance of flooding over 30 yrs
- 0.0%
- Est. flood insurance / yr
- $473 – $860
Fire risk 1/10 · Minimal
- Est. fire insurance / yr
- $691 – $1,283
Heat risk 3/10 · Minor
- Hot days now (above 95°F)
- 7 days/yr
- Hot days in 30 yrs
- 16 days/yr
Wind risk 1/10 · Minimal
- Chance of severe wind over 30 yrs
- 0.0%
Air-quality risk 2/10 · Minimal
- Unhealthy air days now
- 1 days/yr
- Unhealthy air days in 30 yrs
- 1 days/yr
Risk factors via First Street. Map © Google.
Why this score? — see what drove the D+ grade
The composite is a weighted blend of 9 inputs, each scored 0–100. Each bar is that input's sub-score; the figure is the points it added to the 100-point composite (weight × sub-score).
- ARV discount +15.0/15.0
- Cash flow +13.2/30.0
- 1% rule +4.6/10.0
- Schools +4.2/10.0
- DSCR +4.0/10.0
- Livability +3.6/5.0
- Rent growth +2.5/5.0
- Condition / age +2.5/5.0
- Appreciation +0.0/10.0
$299,000
🖨 Deal sheet (PDF) 📄 Offer letter ✓ Due diligence
Listing remarks
Welcome home to this meticulously maintained 3-bedroom, 2.5-bath property located in the desirable North Syracuse School District, where thoughtful updates, timeless curb appeal, and pride of ownership shine throughout. Beautiful landscaping and a decorative Stampcrete-style walkway set the tone from the moment you arrive, offering a warm and welcoming entrance that immediately showcases the care this home has received over the years. Inside, you’ll find comfortable living spaces paired with tasteful modern updates designed for both everyday living and entertaining. The updated kitchen features solid surface countertops, upgraded appliances, and abundant functionality, while the beaut
Key facts
- Renovated bathrooms
- Updated kitchen
- Private ensuite bath
Tags
Property features AI
Exterior
- Parking: Attached 2-car garage; Driveway; Garage with electricity and automatic door opener
- Utilities: Public water connected; Sewer connected; Cable available; High-speed internet available; Circuit breaker electrical
- Home design: Two-story single-family home; Existing construction; Architectural shingle roof
- Construction: Aluminum siding; Block foundation; Attic/crawl hatchway(s) insulated; Copper and PEX plumbing
- Exterior features: Blacktop driveway; Shed(s) and storage
Interior
- Kitchen: Electric oven; Electric range; Microwave; Refrigerator; Eat-in kitchen; Solid surface counters
- Bedrooms: Bedroom 1 (Second level); Bedroom 2 (Second level); Bedroom 3 (Second level)
- Flooring: Carpet; Laminate; Varies
- Bathrooms: 2 full bathrooms; 1 half bathroom; 1 bathroom on the main level
- Heating & cooling: Gas forced-air heating; Central air conditioning
- Interior features: Ceiling fans; Eat-in kitchen; Sliding glass doors; Solid surface counters; Window treatments; Drapes; Sliding doors
- Laundry & utility: Washer; Dryer; Laundry in basement
Neighborhood map
What this means for you Summary
Snapshot
- This is a 3-bed/1.5-bath single-family listed at $299k.
Deal economics
- At list price, monthly cash flow is $-3 ($-35/yr) — negative.
- To cash-flow at today's rent, offer at most $298k (0.2% below list).
- To meet the 1% rule (rent ≥ 1% of price), the offer needs to be $288k (3.7% below list).
- Recommended offer: $288k (3.7% below list) — sets the bar for 1% rule.
- Cap rate 6.3% vs local median 5.1% in North Syracuse — meaningfully above typical; check what's discounted (condition, days-on-market, listing class) to confirm the premium yield is real.
Location & tenants
- Location reads 72/100 on livability (#379 in NY) — a middle-class / working-renter tenant base. Strengths: housing A+, health & safety A+, cost of living A; Watch: schools C-, crime D, amenities F.
- North Syracuse Central School District (suburban): math 45% / reading 50% proficiency, ranked #402 of 590 in NY (top 68%) — families likely to look elsewhere, expect single-tenant / working-renter base with shorter leases.
- Market conditions: 87 active listings in the ZIP; 2 comparable units currently listed for rent nearby; 616 units permitted in Onondaga County in 2024 (256 in 5+ unit buildings).
Forward outlook
- Local home prices are declining (-3.0%/yr); year-one equity from $2k of loan paydown is wiped out by about $9k of value loss. Plan a longer hold.
- Onondaga County population projected to shrink 9% by 2050 — rents likely to lag national; underwrite the cash flow, not the appreciation.
Negotiation context
- Only 2 days on market — expect competitive offers; lowballing is unlikely to land.
- Current owner paid $87k; list at $299k implies a 244% gain — meaningful room to come down on a strong offer.
Questions for the listing agent
- What do current leases actually rent for vs. the listed asking? Can we see a recent rent roll and the last 12 months of T-12 income?
- Is there a deadline driving the sale (1031 exchange, divorce, estate, relocation)? That informs how much negotiation room exists.
- Crime grade is D in this area — have there been break-ins, vandalism, or insurance claims at this property in the last 3 years? What carrier currently insures it and at what premium?
- The area grade is low — what's the realistic commute time and amenity access for the typical tenant pool here? Any planned neighborhood developments (good or bad) we should know about?
- What's the average days-on-market for RENTAL listings here right now (not sales)? A rising rental-DOM trend means longer vacancies and softer asking-rent achievability than the comps imply.
- What's the recent tenant-quality profile in this submarket — average credit score on applications, eviction rate, late-payment / NSF rate, and stable-employment percentage? A property-management company in the area should have these aggregated.
- How much new for-sale + rental construction is in the pipeline within 1–3 miles? Heavy new supply typically softens prices + rents 12–24 months out; constrained supply supports both.
Investment metrics
- 1% rule
- 0.96% ✗
- Cap rate
- 6.28%
- Cash-on-cash
- -0.04%
- DSCR
- 1.00
- GRM
- 8.7
CMA / ARV
- ARV (on-the-fly)
- $367,840
- Comps found
- 12
Show comp detail 12 sales within ~0.75 mi
| Address | Dist | Beds/Ba | Sqft | Sold | Price | $/sf | Match |
|---|---|---|---|---|---|---|---|
| 6130 Palisades Dr | 0.09mi | 3/2.0 | 1,668 (-5%) | 3mo | $345,000 | $207 | 83 |
| 8486 Torchwood Ln | 0.14mi | 3/2.0 | 1,856 (+6%) | 1mo | $350,000 | $189 | 82 |
| 8500 Bayridge Rd | 0.07mi | 3/2.0 | 1,520 (-14%) | 2mo | $304,500 | $200 | 70 |
| 8509 Chinkapin Cir | 0.22mi | 4/2.0 (+1) | 1,638 (-7%) | 2mo | $314,000 | $192 | 69 |
| 6364 Jane Ln | 0.49mi | 3/3.0 | 1,776 (+1%) | 1mo | $331,000 | $186 | 69 |
| 8598 Nazareth Dr | 0.66mi | 3/1.5 | 1,752 (-0%) | 1mo | $367,000 | $209 | 68 |
| 6302 Yulewood Cir | 0.53mi | 3/2.5 | 1,722 (-2%) | 5mo | $402,000 | $233 | 63 |
| 6272 Lakeshore Rd | 0.34mi | 4/2.0 (+1) | 1,900 (+8%) | 4mo | $285,000 | $150 | 60 |
| 8494 Wayfarer Dr | 0.72mi | 3/2.0 | 1,686 (-4%) | 2mo | $455,000 | $270 | 56 |
| 6304 Hardwood Ln | 0.55mi | 3/2.0 | 1,534 (-13%) | 0mo | $390,000 | $254 | 51 |
| 6215 Diffin Rd | 0.74mi | 3/2.5 | 1,856 (+6%) | 2mo | $390,000 | $210 | 51 |
| 8511 Grandview Dr | 0.61mi | 3/2.0 | 1,528 (-13%) | 1mo | $320,000 | $209 | 47 |
Match score weights: distance 35% · size 25% · config 20% · recency 20%. Top-matched comps best support the ARV.
Projected returns pro-forma
-3.0% appreciation · 3.0% rent growth · sell at horizon
- IRR
- -16.3%
- Equity multiple
- 0.42×
- Total profit
- $-48,464
- Equity at exit
- $44,582
- IRR
- -7.9%
- Equity multiple
- 0.50×
- Total profit
- $-41,740
- Equity at exit
- $25,852
Cash invested: $83,720 (down + closing). Projections, not guarantees.
Landlord ↔ Tenant lean methodology
- Overall (STATE)
- 15 Strongly Tenant-Friendly
- State New York
- 15 Strongly Tenant-Friendly · D+10
- County
- — inherits STATE
- City
- — inherits STATE
ZIP-level market 13039
- Home prices YoY
- -28.9%
- Active inventory
- 87
- Price-to-rent
- 8.7×
Monthly cashflow live
- Estimated rent
- $2,878 medium interval (Pro) →
- Mortgage (P&I)
- −$1,568
- Tax from tax record
- −$584 /mo · $7,009/yr
- Insurance
- −$125
- HOA
- −$0
- Vacancy / Maint / Mgmt
- −$604
- Net cashflow
- $-3
Break-even live
Sensitivity live
| Price | -10% $166 | -5% $82 | +0% $-3 | +5% $-88 | +10% $-172 |
|---|---|---|---|---|---|
| Rent | -10% $-230 | -5% $-117 | +0% $-3 | +5% $111 | +10% $224 |
| Rate | -1.0pp $148 | -0.5pp $73 | base $-3 | +0.5pp $-80 | +1.0pp $-159 |
UW: 25.0% down · 7.5% · 30yr · 1.5% tax · 5.0% vac · 8.0% maint · 8.0% mgmt
Financing live
Cash to close
- Down payment
- $74,750
- Closing costs
- $8,970
- Reserves months
- —
- Total cash needed
- —
Loan-product check · same deal, 3 products live
Conventional
25% down · 7.5% · 30yr
- Down + closing
- —
- Monthly P&I
- —
- Monthly cashflow
- —
- DSCR
- —
- Eligible?
- —
Personal DTI + credit; lowest rate.
DSCR
20% down · 8.5% · 30yr
- Down + closing
- —
- Monthly P&I
- —
- Monthly cashflow
- —
- DSCR
- —
- Eligible?
- —
No personal income docs; deal must DSCR.
Hard money
10% down · 12.0% · 12mo
- Down + closing
- —
- Monthly P&I
- —
- Monthly cashflow
- —
- DSCR
- —
- Eligible?
- —
Short-term bridge; refi at stabilization.
Rent comps 2 comps
| Address | Beds | Baths | Sqft | Rent | $/sqft | DOM | Units | Dist |
|---|---|---|---|---|---|---|---|---|
| 16 Loso Dr Unit 1614 Cicero, NY | 2.0 | 2.0 | 1342 | $2,900 | $2.16 | 23d | 1 | 1.30mi |
| 22 Loso Dr Brewerton, NY | 1.0–2.0 | 1.0–2.0 | 1046 | $2,850 | $2.72 | 15d | 1 | 1.30mi |
Listing history 3 events
-
2026-05-22status Pending
-
2026-05-20$299,000 Active
-
1994-04-11soldstatus $87,000
ⓘ Source: listings_history table (triggers on properties + properties_extension) + one-shot
backfill from property_details.listing_events for pre-trigger history.
Tax reassessment forecast NY · Partial reset (capped growth)
- Current annual tax
- $7,009 · $584/mo
- Projected year-2 tax
- $7,009 · $584/mo
- Expected delta
- $0/yr ($0/mo · 0.0%)
ⓘ Screening estimate from a state-policy table — verify with the county assessor before closing.
Climate risk First Street
- Flood 1/10 Low FEMA zone X (unshaded) · 0% chance over 30 yrs
- Wildfire 1/10 Low
- Heat 3/10 Moderate 7 d/yr ≥95°F today · 16 d/yr by 30 yrs out
- Wind 1/10 Low 0% chance of damaging wind over 30 yrs
- Air quality 2/10 Low 1 unhealthy d/yr today · 1 by 30 yrs out
Nearby sold comps map
Loading sold comps map…
Walkable amenities ~0.75 mi
Loading nearby amenities…
Taxation est. · year 1
- Rental income
- $34,537
- − Mortgage interest
- −$16,749
- − Property taxes
- −$7,009
- − Insurance
- −$1,495
- − Repairs & maintenance
- −$2,763
- − Management
- −$2,763
- − Depreciation
- −$8,698
- Taxable loss
- −$4,939
- Est. tax savings @ 24.0%
- +$1,185
- After-tax cash flow
- $1,150/yr
For passive investors: Depreciation is non-cash, so a rental often shows a tax loss while cash-flowing — sheltering income. Rental losses are passive: they offset passive income freely, and up to $25,000/yr can offset ordinary (W-2) income if you actively participate and your MAGI is under $100k (phasing out to $0 by $150k); unused losses carry forward. On sale, claimed depreciation is recaptured at up to 25%, and gains may owe capital-gains tax (a 1031 exchange can defer both). Figures are a year-1 estimate at your 24.0% rate — not tax advice; consult a CPA.
Schools (NCES district)
- District
- North Syracuse Central School District
- NCES district ID
- 3621210
- Math proficiency
- 45% ▼ -9.00%
- Reading proficiency
- 50% ▲ 1.00%
- Median HH income
- $62,904
- Composite
- 41.93/100
- National rank
- #3356
- State rank
- #402 of 590 in NY
Livability — North Syracuse
- Score
- 72/100
- State rank
- #379
- US rank
- #6513
Category grades
Schools grade is shown separately in the Schools card above.
Census & demographics
- City population
- 20,185
- Population (ZIP)
- 17,184
Population outlook (Onondaga County) Hauer SSP2
- Today (2025)
- 467,894 people
- By 2030
- 463,381 · -1.0%
- By 2040
- 447,697 · -4.3%
- By 2050
- 426,399 · -8.9%
- By 2075
- 373,661 · -20.1%
- By 2100
- 307,967 · -34.2%
Race, ethnicity, and origin ACS 2023
- Neighborhood character
- Predominantly White (93%)
- Race & ethnicity
- White 93% Asian 3% Two or more races 2% Black 2%
- Common ancestry
- Romanian 10% Lithuanian 3% Slovak 2%
- Foreign-born
- 4% · China, Canada, Mexico
- Languages at home
- 95% English-only · Spanish 1% Other Indo-European 1% Chinese 1%
Political lean MEDSL · Onondaga
- 2024 margin
- D (+17.3) · D 58.6% · R 41.4%
- 2008→2024 swing
- -3.0pp toward R · 2008: 20.3pp · 2024: 17.3pp
- All cycles
- 2024: D+17.3 2020: D+20.6 2016: D+12.8 2012: D+21.1 2008: D+20.3
Not yet ingested
- Civics
- —
Market trends
- HPI YoY
- ▼ -127.98%
- Current HPI
- 314.7902
- Rent YoY
- —
- Metro
- —
- State GDP YoY
- ▲ 2.60%
- F500 in state
- 92
Industry mix (Fortune 500 HQ in NY)
| Industry | F500 HQs | Revenue |
|---|---|---|
| Financial Services | 10 | $950B |
|
||
| Consumer Goods | 9 | $162B |
|
||
| Insurance | 4 | $225B |
|
||
| Telecommunications | 2 | $144B |
|
||
| Pharmaceuticals | 2 | $112B |
|
||
| Media / Entertainment | 2 | $69B |
|
||
Price history
+243.7% since first listed3 events — show timeline
- 2026-05-22 Pending — CNYIS
- 2026-05-20 Listed $299,000 CNYIS
- 1994-04-11 Sold (Public Records) $87,000 Public Records
Property tax history
+3.2%/yrLatest (2025): $7,009 · +2.9% YoY. Source: county tax records.
Cash-flow waterfall
monthlySold comps — $/sqft
last 12 mo · ≤1 miLoading sold comps…