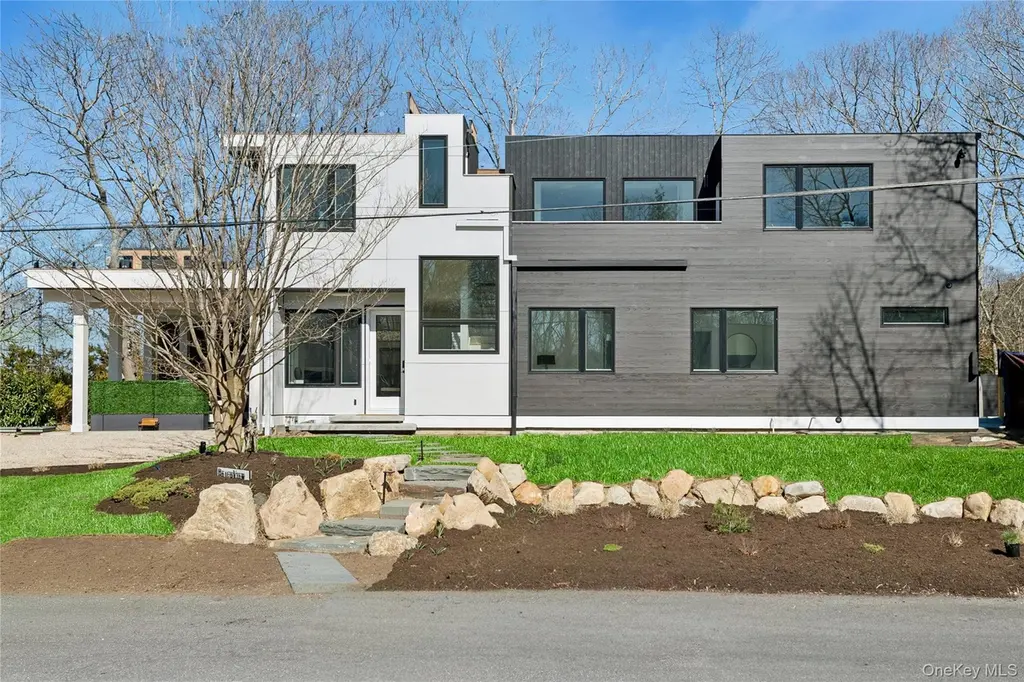
46 Terry Dr · Sag Harbor, NY
Flood risk 1/10 · Minimal
- FEMA flood zone
- X (unshaded)
- Chance of flooding over 30 yrs
- 0.0%
- Est. flood insurance / yr
- $473 – $860
Fire risk 1/10 · Minimal
- Est. fire insurance / yr
- $691 – $1,283
Heat risk 4/10 · Minor
- Hot days now (above 90°F)
- 7 days/yr
- Hot days in 30 yrs
- 19 days/yr
Wind risk 8/10 · Major
- Chance of severe wind over 30 yrs
- 80.0%
Air-quality risk 3/10 · Minor
- Unhealthy air days now
- 2 days/yr
- Unhealthy air days in 30 yrs
- 3 days/yr
Risk factors via First Street. Map © Google.
Why this score? — see what drove the D+ grade
The composite is a weighted blend of 9 inputs, each scored 0–100. Each bar is that input's sub-score; the figure is the points it added to the 100-point composite (weight × sub-score).
- ARV discount +13.6/15.0
- Appreciation +9.6/10.0
- Cash flow +6.5/30.0
- Schools +5.6/10.0
- Rent growth +5.0/5.0
- Livability +3.5/5.0
- Condition / age +2.5/5.0
- 1% rule +1.6/10.0
- DSCR +0.8/10.0
$4,500,000
🖨 Deal sheet (PDF) 📄 Offer letter ✓ Due diligence
Listing remarks
New construction in a private beach community just moments from Sag Harbor Village. Situated on a corner lot of approximately 0.19 acres, this 5-bedroom, 5.5-bath residence offers approximately 3,800 square feet of living space designed for modern coastal living. The open floor plan features living and dining areas filled with natural light, a well-appointed kitchen with premium finishes and appliances, and two primary suites, including one on the main level and one on the second floor, providing flexibility for guests, multigenerational living, or a variety of lifestyle needs. Contemporary details include wide-plank flooring, an electric LED fireplace, and multiple indoor and outdoor gathe
Key facts
- Master suite
- Large gathering area
- Multiple patio areas
Tags
Property features AI
Exterior
- Parking: Space for 4 vehicles; Carport; Driveway; Private parking lot
- Security: Security system; Video cameras
- Utilities: Septic tank; Cable available; Private trash collection; Electric service (provider: Other)
- Home design: Single family residence; One level
- Construction: Cedar and frame construction; Brick/mortar foundation
- Exterior features: Private dock; Outdoor speakers; In-ground pool; Fenced yard; Corner lot; Near shops
Interior
- Kitchen: Convection oven; Cooktop; Dishwasher; Wine refrigerator; ENERGY STAR qualified appliances
- Bedrooms: Primary suite on the downstairs/main level
- Flooring: Hardwood floors
- Bathrooms: 5 full bathrooms; 1 half bathroom
- Heating & cooling: Forced air heating; Baseboard heating; Propane heating; Ductless cooling
- Interior features: Ceiling fans; Chandelier; Granite counters; Low flow plumbing fixtures; Speakers / whole-house entertainment system; Primary bathroom; First-floor bedroom; Master bedroom on main level; Patio
- Laundry & utility: Washer; Dryer; Laundry in basement
Neighborhood map
What this means for you Summary
Snapshot
- This is a 5-bed/5.5-bath single-family listed at $4.50M.
Deal economics
- At list price, monthly cash flow is $-8k ($-91k/yr) — negative.
- To cash-flow at today's rent, offer at most $3.41M (24.3% below list).
- To meet the 1% rule (rent ≥ 1% of price), the offer needs to be $2.98M (33.8% below list).
- Recommended offer: $2.98M (33.8% below list) — sets the bar for 1% rule.
Location & tenants
- Location reads 70/100 on livability (#427 in NY) — a middle-class / working-renter tenant base. Strengths: crime A+, employment A+, health & safety A; Watch: amenities F, commute F, cost of living F.
- Sag Harbor Union Free School District (suburban): math 54% / reading 70% proficiency, ranked #175 of 590 in NY (top 30%) — acceptable for families but not a draw, mixed tenant base, ~2y average lease; only 8% free/reduced lunch — higher-income household profile.
- Zoned schools: Sag Harbor Elementary School (math 47% / reading 72%, grade B-, #745 of 2,108 statewide, top 39%, 426 students, 22% FRL); Pierson Middle/High School (math 61% / reading 72%, grade B, #763 of 1,100 statewide, top 69%, 525 students, 25% FRL) — zoned schools average 24% FRL vs 8% district-wide (16 pts higher); higher-poverty schools than district average — tighter screening recommended.
- Market conditions: Rents rising fast (+10.8%/yr); 66 active listings in the ZIP; 1 comparable units currently listed for rent nearby; high-income renter base; 1,366 units permitted in Suffolk County in 2024 (216 in 5+ unit buildings).
- At $29,810/mo this rent would consume 280% of the median local household income ($128k/yr) (locally 95% of renters already pay >50% of income on rent) — very limited rent-growth headroom before tenants either downsize or default.
Forward outlook
- In year one you build about $444k of equity ($31k loan paydown + $413k appreciation (9.2% local appreciation)).
- Suffolk County population projected to shrink 5% by 2050 — rents likely to lag national; underwrite the cash flow, not the appreciation.
- By year 2, paydown + projected appreciation supports a ~$713k cash-out refi (75% LTV) — recoverable capital for the next deal without selling this one.
Negotiation context
- It's been on market 18 days — a 2% lower offer ($4.43M) is reasonable based on typical stale-listing flexibility.
- Current owner paid $510k; list at $4.50M implies a 782% gain — meaningful room to come down on a strong offer.
Risks & watch-outs
- Watch-outs: built in 1954 — expect roof / HVAC / electrical / plumbing capex.
- Climate carrying-cost: severe wind risk, 80% chance of damaging wind over 30y — expect insurance premiums to compound above CPI over the hold.
Questions for the listing agent
- What do current leases actually rent for vs. the listed asking? Can we see a recent rent roll and the last 12 months of T-12 income?
- Built in 1954 — when were the roof, HVAC, electrical panel, plumbing, and water heater last replaced?
- Is there a deadline driving the sale (1031 exchange, divorce, estate, relocation)? That informs how much negotiation room exists.
- Schools are A-rated — typically a magnet for longer-tenancy family renters. What's the average tenant stay here, and is there a school-zone premium baked into asking?
- The area grade is low — what's the realistic commute time and amenity access for the typical tenant pool here? Any planned neighborhood developments (good or bad) we should know about?
- What's the average days-on-market for RENTAL listings here right now (not sales)? A rising rental-DOM trend means longer vacancies and softer asking-rent achievability than the comps imply.
- What's the recent tenant-quality profile in this submarket — average credit score on applications, eviction rate, late-payment / NSF rate, and stable-employment percentage? A property-management company in the area should have these aggregated.
- How much new for-sale + rental construction is in the pipeline within 1–3 miles? Heavy new supply typically softens prices + rents 12–24 months out; constrained supply supports both.
Investment metrics
- 1% rule
- 0.66% ✗
- Cap rate
- 4.28%
- Cash-on-cash
- -7.19%
- DSCR
- 0.68
- GRM
- 12.6
CMA / ARV
- ARV (on-the-fly)
- $5,202,200
- Comps found
- 1
Show comp detail 1 sale within ~0.75 mi
| Address | Dist | Beds/Ba | Sqft | Sold | Price | $/sf | Match |
|---|---|---|---|---|---|---|---|
| 30 Hampton St | 0.69mi | 5/5.0 | 4,310 (+13%) | 13mo | $5,900,000 | $1,369 | 32 |
Match score weights: distance 35% · size 25% · config 20% · recency 20%. Top-matched comps best support the ARV.
Projected returns pro-forma
9.19% appreciation · 8.0% rent growth · sell at horizon
- IRR
- 18.8%
- Equity multiple
- 2.49×
- Total profit
- $1,879,718
- Equity at exit
- $3,789,810
- IRR
- 18.6%
- Equity multiple
- 5.96×
- Total profit
- $6,250,719
- Equity at exit
- $7,907,194
Cash invested: $1,260,000 (down + closing). Projections, not guarantees.
Landlord ↔ Tenant lean methodology
- Overall (STATE)
- 15 Strongly Tenant-Friendly
- State New York
- 15 Strongly Tenant-Friendly · D+10
- County
- — inherits STATE
- City
- — inherits STATE
ZIP-level market 11963
- Home prices YoY
- 1.9%
- Rents YoY
- 10.8%
- Active inventory
- 66
- Price-to-rent
- 12.6×
Monthly cashflow live
- Estimated rent
- $29,810 medium interval (Pro) →
- Mortgage (P&I)
- −$23,598
- Tax est. 1.5%
- −$5,625 /mo · $67,500/yr
- Insurance
- −$1,875
- HOA
- −$0
- Vacancy / Maint / Mgmt
- −$6,260
- Net cashflow
- $-7,549
Break-even live
Sensitivity live
| Price | -10% $-4,439 | -5% $-5,994 | +0% $-7,549 | +5% $-9,104 | +10% $-10,659 |
|---|---|---|---|---|---|
| Rent | -10% $-9,904 | -5% $-8,726 | +0% $-7,549 | +5% $-6,371 | +10% $-5,194 |
| Rate | -1.0pp $-5,283 | -0.5pp $-6,404 | base $-7,549 | +0.5pp $-8,715 | +1.0pp $-9,901 |
UW: 25.0% down · 7.5% · 30yr · 1.5% tax · 5.0% vac · 8.0% maint · 8.0% mgmt
Financing live
Cash to close
- Down payment
- $1,125,000
- Closing costs
- $135,000
- Reserves months
- —
- Total cash needed
- —
Loan-product check · same deal, 3 products live
Conventional
25% down · 7.5% · 30yr
- Down + closing
- —
- Monthly P&I
- —
- Monthly cashflow
- —
- DSCR
- —
- Eligible?
- —
Personal DTI + credit; lowest rate.
DSCR
20% down · 8.5% · 30yr
- Down + closing
- —
- Monthly P&I
- —
- Monthly cashflow
- —
- DSCR
- —
- Eligible?
- —
No personal income docs; deal must DSCR.
Hard money
10% down · 12.0% · 12mo
- Down + closing
- —
- Monthly P&I
- —
- Monthly cashflow
- —
- DSCR
- —
- Eligible?
- —
Short-term bridge; refi at stabilization.
Rent comps 1 comps
| Address | Beds | Baths | Sqft | Rent | $/sqft | DOM | Units | Dist |
|---|---|---|---|---|---|---|---|---|
| 7 Old Sag Harbor Rd East Hampton, NY | 5.0 | 5.5 | 4000 | $25,000 | $6.25 | 0d | 1 | 1.37mi |
Listing history 12 events
-
2026-06-21days on market $4,500,000 Active 18 DOM
-
2026-06-18days on market $4,500,000 Active 15 DOM
-
2026-06-17days on market $4,500,000 Active 14 DOM
-
2026-06-16days on market $4,500,000 Active 13 DOM
-
2026-06-15days on market $4,500,000 Active 12 DOM
-
2026-06-13days on market $4,500,000 Active 10 DOM
-
2026-06-09days on market $4,500,000 Active 6 DOM
-
2026-06-08days on market $4,500,000 Active 5 DOM
-
2026-06-07remarks 699-char remark
-
2026-06-07days on market $4,500,000 Active 4 DOM
-
2026-06-04remarks 585-char remark
-
2026-06-04$4,500,000 Active 1 DOM
ⓘ Source: listings_history table (triggers on properties + properties_extension) + one-shot
backfill from property_details.listing_events for pre-trigger history.
Climate risk First Street
- Flood 1/10 Low FEMA zone X (unshaded) · 0% chance over 30 yrs
- Wildfire 1/10 Low
- Heat 4/10 Moderate 7 d/yr ≥90°F today · 19 d/yr by 30 yrs out
- Wind 8/10 Severe 80% chance of damaging wind over 30 yrs
- Air quality 3/10 Moderate 2 unhealthy d/yr today · 3 by 30 yrs out
Nearby sold comps map
Loading sold comps map…
Walkable amenities ~0.75 mi
Loading nearby amenities…
Taxation est. · year 1
- Rental income
- $357,716
- − Mortgage interest
- −$252,070
- − Property taxes
- −$67,500
- − Insurance
- −$22,500
- − Repairs & maintenance
- −$28,617
- − Management
- −$28,617
- − Depreciation
- −$130,909
- Taxable loss
- −$172,498
- Est. tax savings @ 24.0%
- +$41,399
- After-tax cash flow
- $-49,187/yr
For passive investors: Depreciation is non-cash, so a rental often shows a tax loss while cash-flowing — sheltering income. Rental losses are passive: they offset passive income freely, and up to $25,000/yr can offset ordinary (W-2) income if you actively participate and your MAGI is under $100k (phasing out to $0 by $150k); unused losses carry forward. On sale, claimed depreciation is recaptured at up to 25%, and gains may owe capital-gains tax (a 1031 exchange can defer both). Figures are a year-1 estimate at your 24.0% rate — not tax advice; consult a CPA.
Schools (NCES district)
- District
- Sag Harbor Union Free School District
- NCES district ID
- 3625380
- Math proficiency
- 54% ▼ -13.00%
- Reading proficiency
- 70% ▲ 7.00%
- Median HH income
- $81,547
- Composite
- 55.69/100
- National rank
- #1222
- State rank
- #175 of 590 in NY
Livability — Sag Harbor
- Score
- 70/100
- State rank
- #427
- US rank
- #7428
Category grades
Schools grade is shown separately in the Schools card above.
Census & demographics
- Census place
- Sag Harbor, NY
- County
- Suffolk County · 679,920 people
- City population
- 8,390
- Metro
- New York-Newark-Jersey City, NY-NJ-PA
- Population (ZIP)
- 8,390
- Household income
- $127,746
- Rent vs Own
- Severe rent burden
- 95.0
Population outlook (Suffolk County) Hauer SSP2
- Today (2025)
- 1,505,262 people
- By 2030
- 1,498,318 · -0.5%
- By 2040
- 1,471,101 · -2.3%
- By 2050
- 1,424,848 · -5.3%
- By 2075
- 1,337,157 · -11.2%
- By 2100
- 1,217,720 · -19.1%
Race, ethnicity, and origin ACS 2023
- Neighborhood character
- Predominantly White (78%)
- Race & ethnicity
- White 78% Hispanic / Latino 13% Two or more races 11% Asian 4% Black 2%
- Hispanic origin (detail)
- Mexican 8%
- Common ancestry
- Scotch-Irish 4% Romanian 3% Italian 2%
- Foreign-born
- 13% · Canada, China, Jamaica
- Languages at home
- 81% English-only · Spanish 9% Other Indo-European 5% French/Haitian/Cajun 2%
Political lean MEDSL · Suffolk
- 2024 margin
- Lean R (+10.0) · D 45.0% · R 55.0%
- 2008→2024 swing
- -16.0pp toward R · 2008: 6.0pp · 2024: -10.0pp
- All cycles
- 2024: R+10.0 2020: R+0.0 2016: R+8.2 2012: D+2.9 2008: D+6.0
Not yet ingested
- Civics
- —
Market trends
- HPI YoY
- ▲ 9.19%
- Current HPI
- 499.3304
- Rent YoY
- ▲ 10.76%
- Metro
- New York-Newark-Jersey City, NY-NJ-PA
- State GDP YoY
- ▲ 2.60%
- F500 in state
- 92
Industry mix (Fortune 500 HQ in NY)
| Industry | F500 HQs | Revenue |
|---|---|---|
| Financial Services | 10 | $950B |
|
||
| Consumer Goods | 9 | $162B |
|
||
| Insurance | 4 | $225B |
|
||
| Telecommunications | 2 | $144B |
|
||
| Pharmaceuticals | 2 | $112B |
|
||
| Media / Entertainment | 2 | $69B |
|
||
Price history
+1295.3% since first listed3 events — show timeline
- 2026-06-03 Listed $4,500,000 OneKey® MLS as Distributed by MLS Grid
- 2011-08-23 Sold (Public Records) $510,000 Public Records
- 2001-03-22 Sold (Public Records) $322,500 Public Records
Property tax history
+1.5%/yrLatest (2025): $5,334 · +0.0% YoY. Source: county tax records.
Cash-flow waterfall
monthlySold comps — $/sqft
last 12 mo · ≤1 miLoading sold comps…