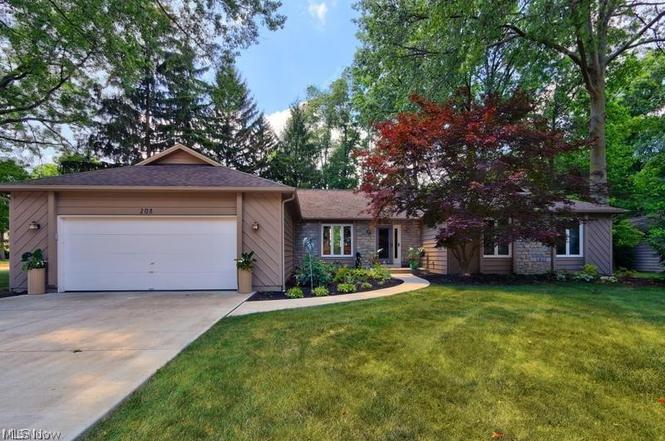
208 Westwind Dr · Avon Lake, OH
Flood risk 1/10 · Minimal
- FEMA flood zone
- X (unshaded)
- Chance of flooding over 30 yrs
- 0.0%
- Est. flood insurance / yr
- $473 – $860
Fire risk 1/10 · Minimal
- Est. fire insurance / yr
- $713 – $1,323
Heat risk 2/10 · Minimal
- Hot days now (above 96°F)
- 7 days/yr
- Hot days in 30 yrs
- 17 days/yr
Wind risk 1/10 · Minimal
- Chance of severe wind over 30 yrs
- —
Air-quality risk 2/10 · Minimal
- Unhealthy air days now
- 2 days/yr
- Unhealthy air days in 30 yrs
- 2 days/yr
Risk factors via First Street. Map © Google.
Why this score? — see what drove the D+ grade
The composite is a weighted blend of 9 inputs, each scored 0–100. Each bar is that input's sub-score; the figure is the points it added to the 100-point composite (weight × sub-score).
- Cash flow +17.7/30.0
- Schools +7.0/10.0
- DSCR +5.5/10.0
- 1% rule +4.9/10.0
- Livability +4.2/5.0
- Rent growth +2.5/5.0
- Condition / age +2.5/5.0
- ARV discount +0.8/15.0
- Appreciation +0.0/10.0
$509,000
🖨 Deal sheet 📄 Offer letter ✓ Due diligence
Listing remarks MLS
Custom Cedar/Stone Contemporary Ranch With Over $25,000 In Recent Upgrades * A True Gourmet Kitchen With Viking Range And Hood, Stainless Kitchen Aid Refrigerator And Bosch Dishwasher * Quartz Counters And Hardwood Floors-vaulted Ceilings And More *
Key facts
- Gas fireplace
- Renovated kitchen
- One floor living
Tags
Neighborhood map
What this means for you Summary
Snapshot
- This is a 4-bed/2.5-bath single-family listed at $509k.
Deal economics
- At list price, monthly cash flow is $407 ($5k/yr) — positive.
- The deal already cash-flows at list — no discount required.
- To meet the 1% rule (rent ≥ 1% of price), the offer needs to be $503k (1.2% below list).
- Recommended offer: $494k (3.0% below list) — sets the bar for market timing.
- Cap rate 7.3% vs local median 3.2% in Avon Lake — top-decile yield for the area; either an underpriced asset or a hidden risk that comps aren't pricing in. Stress-test before assuming the spread holds.
Location & tenants
- Location reads 84/100 on livability (#52 in OH, #736 nationally) — a professional / high-income tenant draw. Strengths: schools A+, crime A+, employment A+; Watch: commute F.
- Avon Lake City (suburban): math 78% / reading 80% proficiency, ranked #48 of 656 in OH (top 7%) — strong family-tenant draw, lease renewals of 3-5y typical; only 10% free/reduced lunch — higher-income household profile.
- Market conditions: 178 active listings in the ZIP; 3 comparable units currently listed for rent nearby; rentals leasing fast (median 8d on market — plan ~1-2 weeks tenant-placement turnaround); high-income renter base; 1,098 units permitted in Lorain County in 2024 (20 in 5+ unit buildings).
- At $5,029/mo this rent would consume 52% of the median local household income ($116k/yr) (locally 290% of renters already pay >50% of income on rent) — very limited rent-growth headroom before tenants either downsize or default.
Forward outlook
- Local home prices are declining (-3.0%/yr); year-one equity from $4k of loan paydown is wiped out by about $15k of value loss. Plan a longer hold.
Negotiation context
- It's been on market 54 days — a 3% lower offer ($494k) is reasonable based on typical stale-listing flexibility.
- 8 sale attempts since 31y ago with the ask held roughly flat each time — persistent listings suggest the price (not the market) is what's stuck; bring a comps-based counter.
- Current owner paid $307k; list at $509k implies a 66% gain — meaningful room to come down on a strong offer.
Questions for the listing agent
- It's been on market 54 days. Have you received any prior offers? Is the seller open to a 3% concession, seller financing, or rate buy-down credit?
- What does the HOA fee cover, when was the last increase, and are there any pending special assessments or reserve-fund shortfalls?
- Is there a deadline driving the sale (1031 exchange, divorce, estate, relocation)? That informs how much negotiation room exists.
- Schools are A-rated — typically a magnet for longer-tenancy family renters. What's the average tenant stay here, and is there a school-zone premium baked into asking?
- The area grade is low — what's the realistic commute time and amenity access for the typical tenant pool here? Any planned neighborhood developments (good or bad) we should know about?
- What's the average days-on-market for RENTAL listings here right now (not sales)? A rising rental-DOM trend means longer vacancies and softer asking-rent achievability than the comps imply.
- What's the recent tenant-quality profile in this submarket — average credit score on applications, eviction rate, late-payment / NSF rate, and stable-employment percentage? A property-management company in the area should have these aggregated.
- How much new for-sale + rental construction is in the pipeline within 1–3 miles? Heavy new supply typically softens prices + rents 12–24 months out; constrained supply supports both.
Investment metrics
- 1% rule
- 0.99% ✗
- Cap rate
- 7.25%
- Cash-on-cash
- 3.43%
- DSCR
- 1.15
- GRM
- 8.4
CMA / ARV
- ARV (on-the-fly)
- $443,128
- Comps found
- 12
Show comp detail 12 sales within ~0.75 mi
| Address | Dist | Beds/Ba | Sqft | Sold | Price | $/sf | Match |
|---|---|---|---|---|---|---|---|
| 208 Westwind Dr | 0.00mi | 4/2.5 | 2,296 (0%) | 1mo | $505,000 | $220 | 100 |
| 196 Tomahawk Dr | 0.23mi | 4/3.5 | 2,301 (+0%) | 11mo | $399,000 | $173 | 76 |
| 31791 Lake Rd | 0.21mi | 4/2.5 | 2,128 (-7%) | 8mo | $450,000 | $211 | 71 |
| 141 Brunswick Dr | 0.39mi | 4/2.5 | 2,295 (-0%) | 18mo | $375,000 | $163 | 66 |
| 31763 Lake Rd | 0.26mi | 3/2.0 (-1) | 2,020 (-12%) | 7mo | $425,500 | $211 | 55 |
| 388 Windward Way | 0.55mi | 4/3.0 | 2,511 (+9%) | 5mo | $550,000 | $219 | 52 |
| 163 S Point Dr | 0.33mi | 3/2.5 (-1) | 2,028 (-12%) | 11mo | $330,000 | $163 | 51 |
| 219 Jamestown | 0.75mi | 3/2.5 (-1) | 2,361 (+3%) | 18mo | $365,000 | $155 | 40 |
| 202 Lakewood Dr | 0.38mi | 3/2.5 (-1) | 2,023 (-12%) | 22mo | $320,000 | $158 | 39 |
| 31540 Lake Rd | 0.65mi | 3/2.5 (-1) | 1,992 (-13%) | 6mo | $665,500 | $334 | 38 |
| 10 Salem Ct | 0.42mi | 4/2.5 | 2,638 (+15%) | 22mo | $435,000 | $165 | 37 |
| 369 Regatta Dr | 0.55mi | 3/3.5 (-1) | 2,592 (+13%) | 21mo | $499,000 | $193 | 27 |
Match score weights: distance 35% · size 25% · config 20% · recency 20%. Top-matched comps best support the ARV.
Projected returns pro-forma
-3.0% appreciation · 3.0% rent growth · sell at horizon
- IRR
- -10.9%
- Equity multiple
- 0.60×
- Total profit
- $-56,421
- Equity at exit
- $75,894
- IRR
- -1.6%
- Equity multiple
- 0.89×
- Total profit
- $-15,284
- Equity at exit
- $44,009
Cash invested: $142,520 (down + closing). Projections, not guarantees.
Landlord ↔ Tenant lean methodology
- Overall (STATE)
- 73 Landlord-Friendly
- State Ohio
- 73 Landlord-Friendly · R+6
- County
- — inherits STATE
- City
- — inherits STATE
ZIP-level market 44012
- Active inventory
- 178
- Price-to-rent
- 8.4×
Monthly cashflow live
- Estimated rent
- $5,029 medium interval (Pro) →
- Mortgage (P&I)
- −$2,669
- Tax from tax record
- −$632 /mo · $7,586/yr
- Insurance
- −$212
- HOA
- −$52
- Vacancy / Maint / Mgmt
- −$1,056
- Net cashflow
- $407
Break-even live
UW: 25.0% down · 7.5% · 30yr · 1.5% tax · 5.0% vac · 8.0% maint · 8.0% mgmt
Financing live
Cash to close
- Down payment
- $127,250
- Closing costs
- $15,270
- Reserves months
- —
- Total cash needed
- —
Loan-product check · same deal, 3 products live
Conventional
25% down · 7.5% · 30yr
- Down + closing
- —
- Monthly P&I
- —
- Monthly cashflow
- —
- DSCR
- —
- Eligible?
- —
Personal DTI + credit; lowest rate.
DSCR
20% down · 8.5% · 30yr
- Down + closing
- —
- Monthly P&I
- —
- Monthly cashflow
- —
- DSCR
- —
- Eligible?
- —
No personal income docs; deal must DSCR.
Hard money
10% down · 12.0% · 12mo
- Down + closing
- —
- Monthly P&I
- —
- Monthly cashflow
- —
- DSCR
- —
- Eligible?
- —
Short-term bridge; refi at stabilization.
Rent comps 3 comps
| Address | Beds | Baths | Sqft | Rent | $/sqft | DOM | Units | Dist |
|---|---|---|---|---|---|---|---|---|
| 32071 Lake Rd Unit 1496051P Avon Lake, OH | 4.0 | 2.5 | 1603 | $7,861 | $4.90 | 8d | 1 | 0.64mi |
| 384 Bradley Rd Bay Village, OH | 3.0 | 2.5 | 2000 | $4,100 | $2.05 | 8d | 1 | 1.44mi |
| 384 Bradley Rd Bay Village, OH | 3.0 | 3.0 | 2000 | $4,100 | $2.05 | 3d | 1 | 1.44mi |
HOA detail
- Monthly dues
- $52 · $624/yr
Listing history 26 events
-
2026-04-21status Pending
-
2026-03-17price $509,000
-
2026-02-27price $529,999
-
2026-02-26$525,000 Active
-
2025-12-31historical
-
2025-12-04status Active
-
2025-11-30historical
-
2025-10-01status Active
-
2025-09-30historical
-
2025-09-11price $564,900
-
2025-07-31price $585,000
-
2025-07-13$599,000 Active
-
2006-07-17soldstatus $307,000 249-char remark
Show marketing remark (249 chars)
Custom Cedar/Stone Contemporary Ranch With Over $25,000 In Recent Upgrades * A True Gourmet Kitchen With Viking Range And Hood, Stainless Kitchen Aid Refrigerator And Bosch Dishwasher * Quartz Counters And Hardwood Floors-vaulted Ceilings And More *
-
2006-07-13soldstatus $307,000
-
2006-04-12$312,900 249-char remark
Show marketing remark (249 chars)
Custom Cedar/Stone Contemporary Ranch With Over $25,000 In Recent Upgrades * A True Gourmet Kitchen With Viking Range And Hood, Stainless Kitchen Aid Refrigerator And Bosch Dishwasher * Quartz Counters And Hardwood Floors-vaulted Ceilings And More *
-
2002-03-01soldstatus $274,000
-
2002-02-28soldstatus $274,000
-
2002-01-19historical
-
2001-10-19$289,900
-
1999-12-06soldstatus $229,000
-
1999-12-02soldstatus $229,000
-
1999-07-19$247,000
-
1996-04-30historical
-
1995-10-15$229,500
-
1990-06-05soldstatus $200,000
-
1988-02-22soldstatus $171,740
ⓘ Source: listings_history table (triggers on properties + properties_extension) + one-shot
backfill from property_details.listing_events for pre-trigger history.
Tax reassessment forecast OH · Partial reset (capped growth)
- Current annual tax
- $7,586 · $632/mo
- Projected year-2 tax
- $7,763 · $647/mo
- Expected delta
- +$177/yr (+$15/mo · 2.3%)
ⓘ Screening estimate from a state-policy table — verify with the county assessor before closing.
Climate risk First Street
- Flood 1/10 Low FEMA zone X (unshaded) · 0% chance over 30 yrs
- Wildfire 1/10 Low
- Heat 2/10 Low 7 d/yr ≥96°F today · 17 d/yr by 30 yrs out
- Wind 1/10 Low
- Air quality 2/10 Low 2 unhealthy d/yr today · 2 by 30 yrs out
Nearby sold comps map
Loading sold comps map…
Walkable amenities ~0.75 mi
Loading nearby amenities…
Taxation est. · year 1
- Rental income
- $60,349
- − Mortgage interest
- −$28,512
- − Property taxes
- −$7,586
- − Insurance
- −$2,545
- − Repairs & maintenance
- −$4,828
- − Management
- −$4,828
- − HOA
- −$624
- − Depreciation
- −$14,807
- Taxable loss
- −$3,381
- Est. tax savings @ 24.0%
- +$811
- After-tax cash flow
- $5,701/yr
For passive investors: Depreciation is non-cash, so a rental often shows a tax loss while cash-flowing — sheltering income. Rental losses are passive: they offset passive income freely, and up to $25,000/yr can offset ordinary (W-2) income if you actively participate and your MAGI is under $100k (phasing out to $0 by $150k); unused losses carry forward. On sale, claimed depreciation is recaptured at up to 25%, and gains may owe capital-gains tax (a 1031 exchange can defer both). Figures are a year-1 estimate at your 24.0% rate — not tax advice; consult a CPA.
Schools (NCES district)
- District
- Avon Lake City
- NCES district ID
- 3904812
- Math proficiency
- 78% ▼ -10.00%
- Reading proficiency
- 80% ▼ -6.00%
- Median HH income
- $79,608
- Composite
- 69.66/100
- National rank
- #296
- State rank
- #48 of 656 in OH
Livability — Avon Lake
- Score
- 84/100
- State rank
- #52
- US rank
- #736
Category grades
Schools grade is shown separately in the Schools card above.
Census & demographics
- Census place
- Avon Lake, OH
- County
- Lorain County · 219,437 people
- City population
- 25,752
- Metro
- Cleveland-Elyria, OH
- Population (ZIP)
- 25,752
- Household income
- $115,567
- Rent vs Own
- Severe rent burden
- 290.0
Population outlook (Lorain County) Hauer SSP2
- Today (2025)
- 314,924 people
- By 2030
- 317,546 · +0.8%
- By 2040
- 317,962 · +1.0%
- By 2050
- 312,872 · -0.7%
- By 2075
- 301,806 · -4.2%
- By 2100
- 278,271 · -11.6%
Race, ethnicity, and origin ACS 2023
- Neighborhood character
- Predominantly White (91%)
- Race & ethnicity
- White 91% Two or more races 4% Hispanic / Latino 3% Asian 2% Black 1%
- Common ancestry
- Romanian 8% Slovak 2% Lithuanian 1%
- Foreign-born
- 4% · Canada, China
- Languages at home
- 94% English-only · Spanish 2% Other Indo-European 1% Other Asian/Pacific 1%
Political lean MEDSL · Lorain
- 2024 margin
- Lean R (+5.7) · D 46.7% · R 52.4%
- 2008→2024 swing
- -23.6pp toward R · 2008: 17.9pp · 2024: -5.7pp
- All cycles
- 2024: R+5.7 2020: R+2.5 2016: R+0.3 2012: D+14.4 2008: D+17.9
Not yet ingested
- Civics
- —
Market trends
- HPI YoY
- ▼ -148.16%
- Current HPI
- 207.1177
- Rent YoY
- —
- Metro
- Cleveland-Elyria, OH
- State GDP YoY
- ▲ 1.98%
- F500 in state
- 48
Industry mix (Fortune 500 HQ in OH)
| Industry | F500 HQs | Revenue |
|---|---|---|
| Insurance | 3 | $145B |
|
||
| Industrial Machinery | 3 | $49B |
|
||
| Financial Services | 3 | $24B |
|
||
| Consumer Goods | 2 | $93B |
|
||
| Aerospace / Defense | 2 | $47B |
|
||
| Utilities | 2 | $33B |
|
||
Price history
+196.4% since first listed26 events — show timeline
- 2026-04-21 Pending — MLSNOW
- 2026-03-17 Price Changed $509,000 MLSNOW
- 2026-02-27 Price Changed $529,999 MLSNOW
- 2026-02-26 Listed $525,000 MLSNOW
- 2025-12-31 Listing Removed — MLSNOW
- 2025-12-04 Relisted — MLSNOW
- 2025-11-30 Listing Removed — MLSNOW
- 2025-10-01 Relisted — MLSNOW
- 2025-09-30 Listing Removed — MLSNOW
- 2025-09-11 Price Changed $564,900 MLSNOW
- 2025-07-31 Price Changed $585,000 MLSNOW
- 2025-07-13 Listed $599,000 MLSNOW
- 2006-07-17 Sold (MLS) $307,000 MLSNOW
- 2006-07-13 Sold (Public Records) $307,000 Public Records
- 2006-04-12 Listed $312,900 MLSNOW
- 2002-03-01 Sold (MLS) $274,000 MLSNOW
- 2002-02-28 Sold (Public Records) $274,000 Public Records
- 2002-01-19 Listing Removed — MLSNOW
- 2001-10-19 Listed $289,900 MLSNOW
- 1999-12-06 Sold (MLS) $229,000 MLSNOW
- 1999-12-02 Sold (Public Records) $229,000 Public Records
- 1999-07-19 Listed $247,000 MLSNOW
- 1996-04-30 Listing Removed — MLSNOW
- 1995-10-15 Listed $229,500 MLSNOW
- 1990-06-05 Sold (Public Records) $200,000 Public Records
- 1988-02-22 Sold (Public Records) $171,740 Public Records
Property tax history
+3.3%/yrLatest (2025): $7,586 · +7.0% YoY. Source: county tax records.
Cash-flow waterfall
monthlySold comps — $/sqft
last 12 mo · ≤1 miLoading sold comps…