 11-Plex
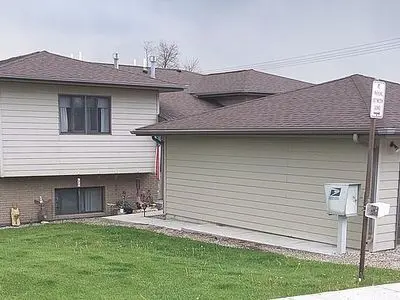
602 Clark St · Deer Lodge, MT
Flood risk 1/10 · Minimal
- FEMA flood zone
- X
- Chance of flooding over 30 yrs
- 0.0%
- Est. flood insurance / yr
- $473 – $860
Fire risk 6/10 · Moderate
- Est. fire insurance / yr
- $918 – $1,706
Heat risk 2/10 · Minimal
- Hot days now (above 87°F)
- 7 days/yr
- Hot days in 30 yrs
- 17 days/yr
Wind risk 1/10 · Minimal
- Chance of severe wind over 30 yrs
- —
Air-quality risk 10/10 · Severe
- Unhealthy air days now
- 25 days/yr
- Unhealthy air days in 30 yrs
- 28 days/yr
Risk factors via First Street. Map © Google.
Why this score? — see what drove the B grade
The composite is a weighted blend of 9 inputs, each scored 0–100. Each bar is that input's sub-score; the figure is the points it added to the 100-point composite (weight × sub-score).
- Cash flow +30.0/30.0
- DSCR +10.0/10.0
- 1% rule +9.2/10.0
- ARV discount +7.5/15.0
- Appreciation +6.8/10.0
- Livability +3.7/5.0
- Schools +2.8/10.0
- Rent growth +2.5/5.0
- Condition / age +2.5/5.0
$599,000
🖨 Deal sheet (PDF) 📄 Offer letter ✓ Due diligence
Multi-family units
County records classify this as Multi-Family (2-4 Unit). Listing-text estimate: 11 units. estimate disagrees with records
Key facts
- Well manicured lawn
- Central location
- Split level units
Tags
Property features AI
Finance
- Other: Property is listed as residential income (quadruplex)
- Financial info: Actual rent reported: $3,250
Exterior
- Parking: Garage with 4 spaces
- Utilities: Public water; Public sewer; Electricity connected; Natural gas connected / available
- Home design: Quadruplex (residential income property); Two levels
- Construction: Wood siding construction
- Exterior features: Asphalt roof; Level and sloping topography; Front yard; Gentle sloping areas; Asphalt road frontage on a city street; Publicly maintained road
Interior
- Kitchen: Range; Refrigerator
- Bedrooms: Total of 8 bedrooms across units (property described as 2 bed / 1 bath units in a 4-plex)
- Bathrooms: Total of 4 bathrooms across units
- Interior features: Range; Refrigerator; Concrete basement
- Laundry & utility: Washer hookup; Additional laundry notes: Other / see remarks
Neighborhood map
What this means for you Summary
Snapshot
- This is a 11 × 1-bed/?-bath units multifamily listed at $599k.
Deal economics
- At list price, monthly cash flow is $3k ($37k/yr) — positive. Per door: $277/mo.
- The deal already cash-flows at list — no discount required.
- Meets the 1% rule at list price ($8k rent vs $599k).
- Recommended offer: $590k (1.5% below list) — sets the bar for market timing.
- Cap rate 12.4% vs local median 2.3% in Deer Lodge — top-decile yield for the area; either an underpriced asset or a hidden risk that comps aren't pricing in. Stress-test before assuming the spread holds.
Location & tenants
- Location reads 73/100 on livability (#50 in MT) — a middle-class / working-renter tenant base. Strengths: cost of living A+, health & safety A+, housing A; Watch: crime C-, amenities F, commute F.
- Powell County H S (town): math 30% / reading 30% proficiency, ranked #220 of 339 in MT (top 65%) — families likely to look elsewhere, expect single-tenant / working-renter base with shorter leases.
- Zoned schools: O D Speer School (math 27% / reading 47%, grade F, #182 of 293 statewide, top 66%, 336 students, 0% FRL); E F Duvall 7-8 (math 27% / reading 47%, grade F, #78 of 146 statewide, top 55%, 90 students, 0% FRL); Powell County High School (math 15% / reading 34%, grade F, #77 of 132 statewide, top 60%, 186 students, 0% FRL).
- Market conditions: 77 active listings in the ZIP; 53 units permitted in Powell County in 2024 (0 in 5+ unit buildings).
Forward outlook
- In year one you build about $26k of equity ($4k loan paydown + $22k appreciation (3.7% local appreciation)).
- Powell County population projected at -11% by 2050 — secular population decline; favor cash flow + early exit over multi-decade hold.
- At projected returns (3.7% appreciation + 3.0% rent growth), your $168k cash investment doubles in ~3 years — after that, you're playing with house money.
- By year 2, paydown + projected appreciation supports a ~$42k cash-out refi (75% LTV) — recoverable capital for the next deal without selling this one.
Negotiation context
- It's been on market 18 days — a 2% lower offer ($590k) is reasonable based on typical stale-listing flexibility.
Risks & watch-outs
- Climate carrying-cost: major wildfire risk — expect insurance premiums to compound above CPI over the hold.
Questions for the listing agent
- Can we see the unit-by-unit rent roll, current vacancy, and any below-market leases? What's the average tenancy length?
- What capital expenditures (roof, boiler, parking lot, exteriors) have been made in the last 5 years, and what's planned in the next 2?
- Is there a deadline driving the sale (1031 exchange, divorce, estate, relocation)? That informs how much negotiation room exists.
- What's the average days-on-market for RENTAL listings here right now (not sales)? A rising rental-DOM trend means longer vacancies and softer asking-rent achievability than the comps imply.
- What's the recent tenant-quality profile in this submarket — average credit score on applications, eviction rate, late-payment / NSF rate, and stable-employment percentage? A property-management company in the area should have these aggregated.
- How much new apartment / multifamily construction is in the pipeline within 1–3 miles? Heavy new supply (>2% of stock underway) typically softens rents 12–24 months out; light construction supports rent growth.
Investment metrics
- 1% rule
- 1.42% ✓
- Cap rate
- 12.40%
- Cash-on-cash
- 21.82%
- DSCR
- 1.97
- GRM
- 5.9
CMA / ARV
No comps found within radius.
Projected returns pro-forma
3.67% appreciation · 3.0% rent growth · sell at horizon
- IRR
- 29.3%
- Equity multiple
- 2.72×
- Total profit
- $287,662
- Equity at exit
- $292,169
- IRR
- 29.2%
- Equity multiple
- 5.33×
- Total profit
- $725,906
- Equity at exit
- $468,888
Cash invested: $167,720 (down + closing). Projections, not guarantees.
Landlord ↔ Tenant lean methodology
- Overall (STATE)
- 82 Strongly Landlord-Friendly
- State Montana
- 82 Strongly Landlord-Friendly · R+11
- County
- — inherits STATE
- City
- — inherits STATE
ZIP-level market 59722
- Home prices YoY
- 1.3%
- Active inventory
- 77
- Price-to-rent
- 64.7×
Monthly cashflow live
- Estimated rent
- $8,486 medium interval (Pro) →
- Mortgage (P&I)
- −$3,141
- Tax from tax record
- −$264 /mo · $3,166/yr
- Insurance
- −$250
- HOA
- −$0
- Vacancy / Maint / Mgmt
- −$1,782
- Net cashflow
- $3,049
Break-even live
Sensitivity live
| Price | -10% $3,388 | -5% $3,219 | +0% $3,049 | +5% $2,880 | +10% $2,710 |
|---|---|---|---|---|---|
| Rent | -10% $2,379 | -5% $2,714 | +0% $3,049 | +5% $3,384 | +10% $3,720 |
| Rate | -1.0pp $3,351 | -0.5pp $3,202 | base $3,049 | +0.5pp $2,894 | +1.0pp $2,736 |
11-unit breakdown (identical units grouped — click to expand)
| Units | Beds | Baths | Est. rent |
|---|---|---|---|
| 11× units | 1 | — | $8,481 |
| #1 | 1 | — | $771 |
| #2 | 1 | — | $771 |
| #3 | 1 | — | $771 |
| #4 | 1 | — | $771 |
| #5 | 1 | — | $771 |
| #6 | 1 | — | $771 |
| #7 | 1 | — | $771 |
| #8 | 1 | — | $771 |
| #9 | 1 | — | $771 |
| #10 | 1 | — | $771 |
| #11 | 1 | — | $771 |
| Total (11 units) | $8,486 | ||
UW: 25.0% down · 7.5% · 30yr · 1.5% tax · 5.0% vac · 8.0% maint · 8.0% mgmt
Financing live
Cash to close
- Down payment
- $149,750
- Closing costs
- $17,970
- Reserves months
- —
- Total cash needed
- —
Loan-product check · same deal, 3 products live
Conventional
25% down · 7.5% · 30yr
- Down + closing
- —
- Monthly P&I
- —
- Monthly cashflow
- —
- DSCR
- —
- Eligible?
- —
Personal DTI + credit; lowest rate.
DSCR
20% down · 8.5% · 30yr
- Down + closing
- —
- Monthly P&I
- —
- Monthly cashflow
- —
- DSCR
- —
- Eligible?
- —
No personal income docs; deal must DSCR.
Hard money
10% down · 12.0% · 12mo
- Down + closing
- —
- Monthly P&I
- —
- Monthly cashflow
- —
- DSCR
- —
- Eligible?
- —
Short-term bridge; refi at stabilization.
Listing history 22 events
-
2026-06-22days on market $599,000 Active 18 DOM
-
2026-06-21days on market $599,000 Active 17 DOM
-
2026-06-19days on market $599,000 Active 15 DOM
-
2026-06-18days on market $599,000 Active 14 DOM
-
2026-06-17days on market $599,000 Active 13 DOM
-
2026-06-16days on market $599,000 Active 12 DOM
-
2026-06-15days on market $599,000 Active 11 DOM
-
2026-06-14days on market $599,000 Active 9 DOM
-
2026-06-12days on market $599,000 Active 8 DOM
-
2026-06-10days on market $599,000 Active 6 DOM
-
2026-06-09days on market $599,000 Active 5 DOM
-
2026-06-08days on market $599,000 Active 4 DOM
-
2026-06-07days on market $599,000 Active 3 DOM
-
2026-06-05pricedays on market $599,000 Active 1 DOM
-
2026-06-03days on market $525,000 Active 15 DOM
-
2026-06-02days on market $525,000 Active 14 DOM
-
2026-06-01days on market $525,000 Active 13 DOM
-
2026-05-31days on market $525,000 Active 12 DOM
-
2026-05-30days on market $525,000 Active 11 DOM
-
2026-05-20$525,000 Active
-
1995-01-13soldstatus
-
1990-03-01soldstatus
ⓘ Source: listings_history table (triggers on properties + properties_extension) + one-shot
backfill from property_details.listing_events for pre-trigger history.
Tax reassessment forecast MT · Resets to sale price
- Current annual tax
- $3,166 · $264/mo
- Projected year-2 tax
- $5,032 · $419/mo
- Expected delta
- +$1,866/yr (+$155/mo · 58.9%)
ⓘ Screening estimate from a state-policy table — verify with the county assessor before closing.
Climate risk First Street
- Flood 1/10 Low FEMA zone X · 0% chance over 30 yrs
- Wildfire 6/10 Major
- Heat 2/10 Low 7 d/yr ≥87°F today · 17 d/yr by 30 yrs out
- Wind 1/10 Low
- Air quality 10/10 Extreme 25 unhealthy d/yr today · 28 by 30 yrs out
Nearby sold comps map
Loading sold comps map…
Walkable amenities ~0.75 mi
Loading nearby amenities…
Taxation est. · year 1
- Rental income
- $101,832
- − Mortgage interest
- −$33,553
- − Property taxes
- −$3,166
- − Insurance
- −$2,995
- − Repairs & maintenance
- −$8,147
- − Management
- −$8,147
- − Depreciation
- −$17,425
- Taxable income
- $28,399
- Est. tax owed @ 24.0%
- −$6,816
- After-tax cash flow
- $29,776/yr
For passive investors: Depreciation is non-cash, so a rental often shows a tax loss while cash-flowing — sheltering income. Rental losses are passive: they offset passive income freely, and up to $25,000/yr can offset ordinary (W-2) income if you actively participate and your MAGI is under $100k (phasing out to $0 by $150k); unused losses carry forward. On sale, claimed depreciation is recaptured at up to 25%, and gains may owe capital-gains tax (a 1031 exchange can defer both). Figures are a year-1 estimate at your 24.0% rate — not tax advice; consult a CPA.
Schools (NCES district)
- District
- Powell County H S
- NCES district ID
- 3021450
- Math proficiency
- 30% ▼ -10.00%
- Reading proficiency
- 30% ▼ -20.00%
- Median HH income
- $42,148
- Composite
- 28.29/100
- National rank
- #12156
- State rank
- #220 of 339 in MT
Livability — Deer Lodge
- Score
- 73/100
- State rank
- #50
- US rank
- #5543
Category grades
Schools grade is shown separately in the Schools card above.
Census & demographics
- Census place
- Deer Lodge, MT
- Population (ZIP)
- 5,698
Population outlook (Powell County) Hauer SSP2
- Today (2025)
- 6,617 people
- By 2030
- 6,451 · -2.5%
- By 2040
- 6,137 · -7.3%
- By 2050
- 5,888 · -11.0%
- By 2075
- 5,348 · -19.2%
- By 2100
- 4,467 · -32.5%
Race, ethnicity, and origin ACS 2023
- Neighborhood character
- Predominantly White (85%)
- Race & ethnicity
- White 85% Native American 6% Two or more races 4% Hispanic / Latino 3% Asian 2% Black 2%
- Common ancestry
- Portuguese 4% Slovak 4% Iranian 2%
- Foreign-born
- 2% · Canada
- Languages at home
- 97% English-only · Tagalog/Filipino 1%
Political lean MEDSL · Powell
- 2024 margin
- Solid R (+53.5) · D 21.6% · R 75.1% · Other 3.2%
- 2008→2024 swing
- -30.0pp toward R · 2008: -23.5pp · 2024: -53.5pp
- All cycles
- 2024: R+53.5 2020: R+50.2 2016: R+53.0 2012: R+33.1 2008: R+23.5
Not yet ingested
- Civics
- —
Market trends
- HPI YoY
- ▲ 3.67%
- Current HPI
- 277.6052
- Rent YoY
- —
- Metro
- —
- State GDP YoY
- ▲ 3.41%
- F500 in state
- 2
Industry mix (Fortune 500 HQ in MT)
| Industry | F500 HQs | Revenue |
|---|---|---|
| Technology / Analytics | 1 | $2B |
|
||
Price history
3 events — show timeline
- 2026-06-04 Listed $599,000 MRMLS
- 1995-01-13 Sold (Public Records) — Public Records
- 1990-03-01 Sold (Public Records) — Public Records
Property tax history
+1.1%/yrLatest (2025): $3,166 · -14.0% YoY. Source: county tax records.
Cash-flow waterfall
monthlySold comps — $/sqft
last 12 mo · ≤1 miLoading sold comps…