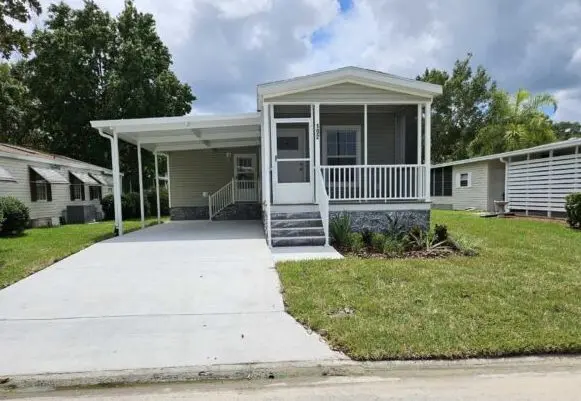
3151 NW 44th Ave #192 · Ocala, FL
Flood risk 8/10 · Major
- FEMA flood zone
- X (unshaded)
- Chance of flooding over 30 yrs
- 0.97%
- Est. flood insurance / yr
- $507 – $1,088
Fire risk 5/10 · Moderate
- Est. fire insurance / yr
- $947 – $1,759
Heat risk 8/10 · Major
- Hot days now (above 107°F)
- 7 days/yr
- Hot days in 30 yrs
- 22 days/yr
Wind risk 9/10 · Severe
- Chance of severe wind over 30 yrs
- 99.0%
Air-quality risk 3/10 · Minor
- Unhealthy air days now
- 3 days/yr
- Unhealthy air days in 30 yrs
- 3 days/yr
Risk factors via First Street. Map © Google.
Why this score? — see what drove the B grade
The composite is a weighted blend of 9 inputs, each scored 0–100. Each bar is that input's sub-score; the figure is the points it added to the 100-point composite (weight × sub-score).
- Cash flow +30.0/30.0
- 1% rule +10.0/10.0
- DSCR +10.0/10.0
- ARV discount +7.5/15.0
- Rent growth +5.0/5.0
- Condition / age +4.0/5.0
- Schools +3.6/10.0
- Livability +3.5/5.0
- Appreciation +0.0/10.0
$89,999
🖨 Deal sheet 📄 Offer letter ✓ Due diligence
Listing remarks MLS
Brand New Skyline Home - The Magnolia Be the first to own this beautifully designed 2 bedroom, 2 bathroom home featuring a half covered porch-perfect for relaxing outdoors. Price Includes: Complete set-up, A/C & heat, carport, skirting, driveway, storage shed, and essential appliances including refrigerator, stove, microwave, and dishwasher. Features: Drywall throughout, kitchen with stainless steel appliances, 60" enclosed shower in the master bath, steps and railings, and pre-plumbed washer/dryer hook-ups. Backed by a 12-month limited warranty for peace of mind. Photos are builder renderings and may vary depending on the selected floor plan.
Key facts
- Half covered porch
- 60 enclosed shower
- Garage
Tags
Neighborhood map
What this means for you Summary
Snapshot
- This is a 2-bed/2.0-bath manufactured listed at $90k. Condition is rated good.
Deal economics
- At list price, monthly cash flow is $1k ($13k/yr) — positive.
- The deal already cash-flows at list — no discount required.
- Meets the 1% rule at list price ($2k rent vs $90k).
- Recommended offer: $79k (12.0% below list) — sets the bar for market timing.
- Cap rate 22.1% vs local median 4.2% in Ocala — top-decile yield for the area; either an underpriced asset or a hidden risk that comps aren't pricing in. Stress-test before assuming the spread holds.
Location & tenants
- Location reads 69/100 on livability (#476 in FL) — a middle-class / working-renter tenant base. Strengths: cost of living A+, housing A+, health & safety A+; Watch: crime F, amenities F, commute F.
- Marion (rural): math 42% / reading 43% proficiency, ranked #61 of 73 in FL (top 84%) — families likely to look elsewhere, expect single-tenant / working-renter base with shorter leases; 61% free/reduced lunch — lower-income household profile, screen leases tightly.
- Market conditions: Rents rising fast (+11.1%/yr); 663 active listings in the ZIP; 19 comparable units currently listed for rent nearby; rentals at typical pace (median 21d on market — plan ~3-4 weeks tenant-placement turnaround); 7,071 units permitted in Marion County in 2024 (534 in 5+ unit buildings).
- This rent runs 42% of the median local income ($66k/yr) — at the standard rent-burdened threshold; future hikes will face affordability resistance.
Forward outlook
- Local home prices are declining (-3.0%/yr); year-one equity from $622 of loan paydown is wiped out by about $3k of value loss. Plan a longer hold.
- Marion County population projected at +13% by 2050 — modest demand growth; plan on rents tracking national, not racing it.
- At projected returns (-3.0% appreciation + 8.0% rent growth), your $25k cash investment doubles in ~3 years — after that, you're playing with house money.
Negotiation context
- It's been on market 195 days — a 12% lower offer ($79k) is reasonable based on typical stale-listing flexibility.
Risks & watch-outs
- Watch-outs: flood insurance adds $66/mo.
- Climate carrying-cost: severe flood risk; severe wind risk, 99% chance of damaging wind over 30y; moderate wildfire risk; extreme-heat days projected 7→22/yr by 2055 (HVAC capex compounding) — expect insurance premiums to compound above CPI over the hold.
Questions for the listing agent
- It's been on market 195 days. Have you received any prior offers? Is the seller open to a 12% concession, seller financing, or rate buy-down credit?
- What's the actual annual flood-insurance premium (NFIP or private), and is the property in a SFHA with mandatory coverage?
- Why hasn't it sold? Are there any deal-killer items the seller is aware of (foundation, flood, title, zoning, code violations)?
- Is there a deadline driving the sale (1031 exchange, divorce, estate, relocation)? That informs how much negotiation room exists.
- Crime grade is F in this area — have there been break-ins, vandalism, or insurance claims at this property in the last 3 years? What carrier currently insures it and at what premium?
- What's the average days-on-market for RENTAL listings here right now (not sales)? A rising rental-DOM trend means longer vacancies and softer asking-rent achievability than the comps imply.
- What's the recent tenant-quality profile in this submarket — average credit score on applications, eviction rate, late-payment / NSF rate, and stable-employment percentage? A property-management company in the area should have these aggregated.
- How much new for-sale + rental construction is in the pipeline within 1–3 miles? Heavy new supply typically softens prices + rents 12–24 months out; constrained supply supports both.
Investment metrics
- 1% rule
- 2.55% ✓
- Cap rate
- 22.13%
- Cash-on-cash
- 56.57%
- DSCR
- 3.52
- GRM
- 3.3
CMA / ARV
No comps found within radius.
Projected returns pro-forma
-3.0% appreciation · 8.0% rent growth · sell at horizon
- IRR
- 57.3%
- Equity multiple
- 3.74×
- Total profit
- $69,027
- Equity at exit
- $13,419
- IRR
- 64.1%
- Equity multiple
- 9.23×
- Total profit
- $207,494
- Equity at exit
- $7,781
Cash invested: $25,200 (down + closing). Projections, not guarantees.
Landlord ↔ Tenant lean methodology
- Overall (STATE)
- 87 Strongly Landlord-Friendly
- State Florida
- 87 Strongly Landlord-Friendly · R+3
- County
- — inherits STATE
- City
- — inherits STATE
ZIP-level market 34482
- Rents YoY
- 11.1%
- Active inventory
- 663
- Price-to-rent
- 3.3×
Monthly cashflow live
- Estimated rent
- $2,291 high interval (Pro) →
- Mortgage (P&I)
- −$472
- Tax est. 1.5%
- −$112 /mo · $1,350/yr
- Insurance
- −$37
- Flood insurance flood zone
- −$66 /mo · $798/yr
- HOA
- −$0
- Vacancy / Maint / Mgmt
- −$481
- Net cashflow
- $1,121
Break-even live
UW: 25.0% down · 7.5% · 30yr · 1.5% tax · 5.0% vac · 8.0% maint · 8.0% mgmt
Financing live
Cash to close
- Down payment
- $22,500
- Closing costs
- $2,700
- Reserves months
- —
- Total cash needed
- —
Loan-product check · same deal, 3 products live
Conventional
25% down · 7.5% · 30yr
- Down + closing
- —
- Monthly P&I
- —
- Monthly cashflow
- —
- DSCR
- —
- Eligible?
- —
Personal DTI + credit; lowest rate.
DSCR
20% down · 8.5% · 30yr
- Down + closing
- —
- Monthly P&I
- —
- Monthly cashflow
- —
- DSCR
- —
- Eligible?
- —
No personal income docs; deal must DSCR.
Hard money
10% down · 12.0% · 12mo
- Down + closing
- —
- Monthly P&I
- —
- Monthly cashflow
- —
- DSCR
- —
- Eligible?
- —
Short-term bridge; refi at stabilization.
Rent comps 19 comps
| Address | Beds | Baths | Sqft | Rent | $/sqft | DOM | Units | Dist |
|---|---|---|---|---|---|---|---|---|
| 4078 NW 44th Cir Ocala, FL | 3.0 | 2.0 | 1504 | $2,500 | $1.66 | 21d | 1 | 1.03mi |
| 4110 NW 44th Cir Ocala, FL | 3.0 | 2.0 | 1610 | $2,400 | $1.49 | 13d | 1 | 1.07mi |
| 5048 NW 35th St Ocala, FL | 3.0 | 2.0 | 1552 | $1,900 | $1.22 | 13d | 1 | 1.08mi |
| 4859 NW 35th Lane Rd Ocala, FL | 2.0 | 2.0 | 1666 | $2,495 | $1.50 | 21d | 1 | 1.09mi |
| 4111 NW 44th Cir Ocala, FL | 3.0 | 2.0 | 1505 | $2,300 | $1.53 | 13d | 1 | 1.09mi |
| 4743 NW 39th Street Rd Ocala, FL | 3.0 | 2.0 | 1565 | $2,500 | $1.60 | 21d | 1 | 1.11mi |
| 3335 NW 52nd Avenue Rd Ocala, FL | 2.0 | 2.5 | 1318 | $2,500 | $1.90 | 21d | 1 | 1.18mi |
| 5353 N US Highway 27 Ocala, FL | 1.0–3.0 | 1.0–2.0 | 1169 | $1,785 | $1.53 | 21d | 1 | 1.19mi |
| 5191 NW 34th St Ocala, FL | 2.0 | 2.0 | 1318 | $2,400 | $1.82 | 21d | 1 | 1.21mi |
| 2048 NW 50th Ave Ocala, FL | 2.0 | 2.0 | 1062 | $2,250 | $2.12 | 21d | 1 | 1.22mi |
| 2038 NW 50th Ave Ocala, FL | 2.0 | 2.0 | 1062 | $2,250 | $2.12 | 21d | 1 | 1.23mi |
| 2028 NW 50th Ave Ocala, FL | 2.0 | 2.0 | 1066 | $1,595 | $1.50 | 21d | 1 | 1.23mi |
| 4122 NW 48th Terrace Rd Ocala, FL | 2.0 | 2.0 | 1816 | $1,999 | $1.10 | 13d | 1 | 1.26mi |
| 1918 NW 50th Cir Ocala, FL | 2.0 | 2.0 | 1061 | $2,200 | $2.07 | 21d | 1 | 1.29mi |
| 5333 NW 33rd Pl Ocala, FL | 2.0 | 2.0 | 1368 | $2,300 | $1.68 | 13d | 1 | 1.29mi |
| 5361 NW 33rd Pl Ocala, FL | 2.0 | 2.0 | 1318 | $2,500 | $1.90 | 21d | 1 | 1.31mi |
| 3384 NW 54th Ct Ocala, FL | 2.0 | 2.5 | 1722 | $2,300 | $1.34 | 21d | 1 | 1.40mi |
| 5471 NW 34th St Ocala, FL | 2.0 | 2.0 | 1318 | $2,900 | $2.20 | 21d | 1 | 1.40mi |
| 5423 NW 35th Lane Rd Ocala, FL | 2.0 | 2.0 | 1656 | $3,200 | $1.93 | 21d | 1 | 1.41mi |
Listing history 14 events
-
2026-06-17days on market $89,999 Active 195 DOM
-
2026-06-16days on market $89,999 Active 194 DOM
-
2026-06-15days on market $89,999 Active 193 DOM
-
2026-06-14days on market $89,999 Active 191 DOM
-
2026-06-13days on market $89,999 Active 190 DOM
-
2026-06-10days on market $89,999 Active 188 DOM
-
2026-06-09days on market $89,999 Active 187 DOM
-
2026-06-08days on market $89,999 Active 186 DOM
-
2026-06-07days on market $89,999 Active 185 DOM
-
2026-06-03days on market $89,999 Active 181 DOM
-
2026-06-02days on market $89,999 Active 180 DOM
-
2026-05-31days on market $89,999 Active 178 DOM
-
2026-05-30days on market $89,999 Active 177 DOM
-
2025-12-04$89,999 Active 662-char remark
Show marketing remark (662 chars)
Brand New Skyline Home - The Magnolia Be the first to own this beautifully designed 2 bedroom, 2 bathroom home featuring a half covered porch-perfect for relaxing outdoors. Price Includes: Complete set-up, A/C & heat, carport, skirting, driveway, storage shed, and essential appliances including refrigerator, stove, microwave, and dishwasher. Features: Drywall throughout, kitchen with stainless steel appliances, 60" enclosed shower in the master bath, steps and railings, and pre-plumbed washer/dryer hook-ups. Backed by a 12-month limited warranty for peace of mind. Photos are builder renderings and may vary depending on the selected floor plan.
ⓘ Source: listings_history table (triggers on properties + properties_extension) + one-shot
backfill from property_details.listing_events for pre-trigger history.
Climate risk First Street
- Flood 8/10 Severe FEMA zone X (unshaded) · 97% chance over 30 yrs
- Wildfire 5/10 Major
- Heat 8/10 Severe 7 d/yr ≥107°F today · 22 d/yr by 30 yrs out
- Wind 9/10 Extreme 99% chance of damaging wind over 30 yrs
- Air quality 3/10 Moderate 3 unhealthy d/yr today · 3 by 30 yrs out
Nearby sold comps map
Loading sold comps map…
Walkable amenities ~0.75 mi
Loading nearby amenities…
Taxation est. · year 1
- Rental income
- $27,492
- − Mortgage interest
- −$5,041
- − Property taxes
- −$1,350
- − Insurance
- −$1,247
- − Repairs & maintenance
- −$2,199
- − Management
- −$2,199
- − Depreciation
- −$2,618
- Taxable income
- $12,836
- Est. tax owed @ 24.0%
- −$3,081
- After-tax cash flow
- $10,377/yr
For passive investors: Depreciation is non-cash, so a rental often shows a tax loss while cash-flowing — sheltering income. Rental losses are passive: they offset passive income freely, and up to $25,000/yr can offset ordinary (W-2) income if you actively participate and your MAGI is under $100k (phasing out to $0 by $150k); unused losses carry forward. On sale, claimed depreciation is recaptured at up to 25%, and gains may owe capital-gains tax (a 1031 exchange can defer both). Figures are a year-1 estimate at your 24.0% rate — not tax advice; consult a CPA.
Condition & rehab AI · 6 photos
This well-maintained, move-in-ready manufactured home features a good condition with minimal repairs needed. Upgrades to exterior paint and smart home devices would significantly enhance its value.
Value-add opportunities
- Both Paint exterior siding — Enhances curb appeal and value
- Both Replace blinds with curtains — Improves privacy and aesthetic
- Both Install smart home devices — Enhances convenience and marketability
Renovation cost estimate screening
Value-add ROI direction
- Both Paint exterior siding — Enhances curb appeal and value ↑
- Both Replace blinds with curtains — Improves privacy and aesthetic ↑
- Both Install smart home devices — Enhances convenience and marketability ↑
ⓘ Cost ranges are severity-bucket heuristics (US national rule-of-thumb). Get contractor quotes + a written scope before underwriting a rehab budget.
Schools (NCES district)
- District
- Marion
- NCES district ID
- 1201260
- Math proficiency
- 42% ▼ -7.00%
- Reading proficiency
- 43% ▼ -4.00%
- Median HH income
- $40,015
- Composite
- 35.61/100
- National rank
- #4890
- State rank
- #61 of 73 in FL
Livability — Ocala
- Score
- 69/100
- State rank
- #476
- US rank
- #8461
Category grades
Schools grade is shown separately in the Schools card above.
Census & demographics
- County
- Marion County · 315,796 people
- City population
- 263,375
- Metro
- Ocala, FL
- Population (ZIP)
- 22,807
- Household income
- $65,901
- Rent vs Own
- Severe rent burden
- 282.0
Population outlook (Marion County) Hauer SSP2
- Today (2025)
- 365,905 people
- By 2030
- 376,768 · +3.0%
- By 2040
- 396,555 · +8.4%
- By 2050
- 412,723 · +12.8%
- By 2075
- 446,090 · +21.9%
- By 2100
- 436,193 · +19.2%
Race, ethnicity, and origin ACS 2023
- Neighborhood character
- Majority White (63%)
- Race & ethnicity
- White 63% Hispanic / Latino 19% Black 14% Two or more races 12%
- Hispanic origin (detail)
- Mexican 6% Puerto Rican 9% Cuban 2%
- Common ancestry
- Lithuanian 2% Romanian 2% Slovak 2%
- Foreign-born
- 10% · Canada
- Languages at home
- 81% English-only · Spanish 16% Other Indo-European 1%
Political lean MEDSL · Marion
- 2024 margin
- Solid R (+31.6) · D 33.8% · R 65.5%
- 2008→2024 swing
- -20.0pp toward R · 2008: -11.6pp · 2024: -31.6pp
- All cycles
- 2024: R+31.6 2020: R+25.9 2016: R+26.2 2012: R+16.2 2008: R+11.6
Not yet ingested
- Civics
- —
Market trends
- HPI YoY
- ▼ -133.62%
- Current HPI
- 194.3857
- Rent YoY
- ▲ 11.12%
- Metro
- Ocala, FL
- State GDP YoY
- ▲ 3.28%
- F500 in state
- 36
Industry mix (Fortune 500 HQ in FL)
| Industry | F500 HQs | Revenue |
|---|---|---|
| Industrial Technology | 2 | $29B |
|
||
| Insurance | 2 | $17B |
|
||
| Retail | 1 | $60B |
|
||
| Technology Distribution | 1 | $58B |
|
||
| Homebuilding | 1 | $35B |
|
||
| Technology Manufacturing | 1 | $35B |
|
||
Price history
1 event — show timeline
- 2025-12-04 Listed $89,999 Zillow
Cash-flow waterfall
monthlySold comps — $/sqft
last 12 mo · ≤1 miLoading sold comps…