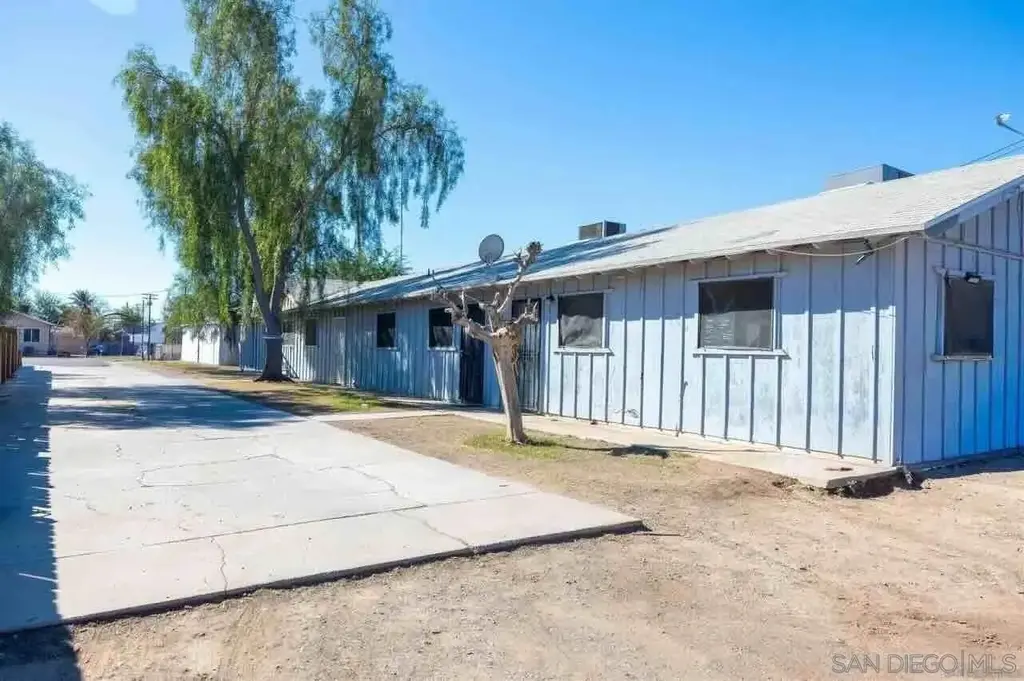
 Fourplex
316 W Barbara St · Calipatria, CA
Flood risk 1/10 · Minimal
- FEMA flood zone
- X (unshaded)
- Chance of flooding over 30 yrs
- 0.0%
- Est. flood insurance / yr
- $507 – $1,088
Fire risk 3/10 · Minor
- Est. fire insurance / yr
- $659 – $1,223
Heat risk 10/10 · Severe
- Hot days now (above 114°F)
- 7 days/yr
- Hot days in 30 yrs
- 21 days/yr
Wind risk 1/10 · Minimal
- Chance of severe wind over 30 yrs
- —
Air-quality risk 2/10 · Minimal
- Unhealthy air days now
- 2 days/yr
- Unhealthy air days in 30 yrs
- 2 days/yr
Risk factors via First Street. Map © Google.
Why this score? — see what drove the C grade
The composite is a weighted blend of 9 inputs, each scored 0–100. Each bar is that input's sub-score; the figure is the points it added to the 100-point composite (weight × sub-score).
- Cash flow +20.9/30.0
- Appreciation +9.1/10.0
- DSCR +6.7/10.0
- ARV discount +5.7/15.0
- 1% rule +4.4/10.0
- Livability +2.8/5.0
- Rent growth +2.5/5.0
- Condition / age +2.5/5.0
- Schools +1.4/10.0
$425,000
🖨 Deal sheet 📄 Offer letter ✓ Due diligence
Multi-family units
County records classify this as Multi-Family (2-4 Unit). Listing-text estimate: 4 units. confirmed
Listing remarks MLS
Welcome to the ultimate real estate strategy in the heart of Imperial County's booming growth area! This 4-unit property (quadruplex) offers an incredible opportunity for a savvy buyer to live in one unit while letting the other three units pay down the mortgage. Whether you are looking to buy your first home, investment property or want a smart way to downsize, this property delivers financial upside.
Key facts
- Built 1978
- Listed 28 days
Property features AI
Finance
- Other: Located in Townsite Of Calipatria; Subdivision: Unknown (999)
Exterior
- Utilities: Cable available; Sewer connected
- Home design: Residential income property (multi-family, 2–4 units); Single-story
- Construction: Zoning: R4
- Exterior features: Composition roof; Publicly maintained road access; Breed-restricted pets allowed
Interior
- Bathrooms: 4 full bathrooms
- Interior features: Central air conditioning; Forced air electric heating
Neighborhood map
What this means for you Summary
Snapshot
- This is a 4 × 2-bed/1.0-bath units multifamily listed at $425k.
Deal economics
- At list price, monthly cash flow is $594 ($7k/yr) — positive. Per door: $149/mo.
- The deal already cash-flows at list — no discount required.
- To meet the 1% rule (rent ≥ 1% of price), the offer needs to be $400k (5.9% below list).
- Recommended offer: $400k (5.9% below list) — sets the bar for 1% rule.
Location & tenants
- Location reads 56/100 on livability (#789 in CA) — a working-class tenant base; expect higher turnover. Strengths: crime A+, housing A+; Watch: schools F, amenities F, commute F.
- Calipatria Unified (town): math 9% / reading 27% proficiency, ranked #485 of 517 in CA (top 94%) — low school quality limits family demand, transient renter base, plan for 1-2y turnover; 85% free/reduced lunch — lower-income household profile, screen leases tightly.
- Market conditions: 22 active listings in the ZIP; 271 units permitted in Imperial County in 2024 (112 in 5+ unit buildings).
Forward outlook
- In year one you build about $38k of equity ($3k loan paydown + $35k appreciation (8.2% local appreciation)).
- Imperial County population projected at +7% by 2050 — modest demand growth; plan on rents tracking national, not racing it.
- At projected returns (8.2% appreciation + 3.0% rent growth), your $119k cash investment doubles in ~3 years — after that, you're playing with house money.
- By year 2, paydown + projected appreciation supports a ~$61k cash-out refi (75% LTV) — recoverable capital for the next deal without selling this one.
Negotiation context
- It's been on market 29 days — a 2% lower offer ($419k) is reasonable based on typical stale-listing flexibility.
- 4 sale attempts with the ask held roughly flat each time — persistent listings suggest the price (not the market) is what's stuck; bring a comps-based counter.
- Current owner paid $130k; list at $425k implies a 227% gain — meaningful room to come down on a strong offer.
Risks & watch-outs
- Climate carrying-cost: extreme-heat days projected 7→21/yr by 2055 (HVAC capex compounding) — expect insurance premiums to compound above CPI over the hold.
Questions for the listing agent
- Can we see the unit-by-unit rent roll, current vacancy, and any below-market leases? What's the average tenancy length?
- What capital expenditures (roof, boiler, parking lot, exteriors) have been made in the last 5 years, and what's planned in the next 2?
- Built in 1978 — when were the roof, HVAC, electrical panel, plumbing, and water heater last replaced?
- Is there a deadline driving the sale (1031 exchange, divorce, estate, relocation)? That informs how much negotiation room exists.
- Schools are F-rated, which usually means shorter tenancies and higher turnover. Who's the typical renter profile here, and what's been the actual vacancy rate?
- What's the average days-on-market for RENTAL listings here right now (not sales)? A rising rental-DOM trend means longer vacancies and softer asking-rent achievability than the comps imply.
- What's the recent tenant-quality profile in this submarket — average credit score on applications, eviction rate, late-payment / NSF rate, and stable-employment percentage? A property-management company in the area should have these aggregated.
- How much new apartment / multifamily construction is in the pipeline within 1–3 miles? Heavy new supply (>2% of stock underway) typically softens rents 12–24 months out; light construction supports rent growth.
Investment metrics
- 1% rule
- 0.94% ✗
- Cap rate
- 7.97%
- Cash-on-cash
- 5.99%
- DSCR
- 1.27
- GRM
- 8.9
CMA / ARV
- ARV (on-the-fly)
- $408,980
- Comps found
- 1
Show comp detail 1 sale within ~0.75 mi
| Address | Dist | Beds/Ba | Sqft | Sold | Price | $/sf | Match |
|---|---|---|---|---|---|---|---|
| 162 W Alamo St | 0.27mi | 8/4.0 | 3,000 (+5%) | 10mo | $430,000 | $143 | 71 |
Match score weights: distance 35% · size 25% · config 20% · recency 20%. Top-matched comps best support the ARV.
Projected returns pro-forma
8.24% appreciation · 3.0% rent growth · sell at horizon
- IRR
- 25.1%
- Equity multiple
- 2.84×
- Total profit
- $219,349
- Equity at exit
- $329,899
- IRR
- 22.6%
- Equity multiple
- 6.11×
- Total profit
- $608,305
- Equity at exit
- $661,652
Cash invested: $119,000 (down + closing). Projections, not guarantees.
Landlord ↔ Tenant lean methodology
- Overall (STATE)
- 18 Strongly Tenant-Friendly
- State California
- 18 Strongly Tenant-Friendly · D+13
- County
- — inherits STATE
- City
- — inherits STATE
ZIP-level market 92233
- Home prices YoY
- 2.0%
- Active inventory
- 22
- Price-to-rent
- 35.4×
Monthly cashflow live
- Estimated rent
- $4,000 medium interval (Pro) →
- Mortgage (P&I)
- −$2,229
- Tax from tax record
- −$160 /mo · $1,919/yr
- Insurance
- −$177
- HOA
- −$0
- Vacancy / Maint / Mgmt
- −$840
- Net cashflow
- $594
Break-even live
4-unit breakdown (identical units grouped — click to expand)
| Units | Beds | Baths | Est. rent |
|---|---|---|---|
| 4× units | 2 | 1 | $4,000 |
| #1 | 2 | 1 | $1,000 |
| #2 | 2 | 1 | $1,000 |
| #3 | 2 | 1 | $1,000 |
| #4 | 2 | 1 | $1,000 |
| Total (4 units) | $4,000 | ||
UW: 25.0% down · 7.5% · 30yr · 1.5% tax · 5.0% vac · 8.0% maint · 8.0% mgmt
Financing live
Cash to close
- Down payment
- $106,250
- Closing costs
- $12,750
- Reserves months
- —
- Total cash needed
- —
Loan-product check · same deal, 3 products live
Conventional
25% down · 7.5% · 30yr
- Down + closing
- —
- Monthly P&I
- —
- Monthly cashflow
- —
- DSCR
- —
- Eligible?
- —
Personal DTI + credit; lowest rate.
DSCR
20% down · 8.5% · 30yr
- Down + closing
- —
- Monthly P&I
- —
- Monthly cashflow
- —
- DSCR
- —
- Eligible?
- —
No personal income docs; deal must DSCR.
Hard money
10% down · 12.0% · 12mo
- Down + closing
- —
- Monthly P&I
- —
- Monthly cashflow
- —
- DSCR
- —
- Eligible?
- —
Short-term bridge; refi at stabilization.
Listing history 25 events
-
2026-06-19days on market $425,000 Active 29 DOM
-
2026-06-18days on market $425,000 Active 28 DOM
-
2026-06-17days on market $425,000 Active 27 DOM
-
2026-06-16days on market $425,000 Active 26 DOM
-
2026-06-15days on market $425,000 Active 25 DOM
-
2026-06-14days on market $425,000 Active 23 DOM
-
2026-06-13days on market $425,000 Active 22 DOM
-
2026-06-10days on market $425,000 Active 20 DOM
-
2026-06-09days on market $425,000 Active 19 DOM
-
2026-06-08days on market $425,000 Active 18 DOM
-
2026-06-07days on market $425,000 Active 17 DOM
-
2026-06-05days on market $425,000 Active 14 DOM
-
2026-06-03days on market $425,000 Active 13 DOM
-
2026-06-02days on market $425,000 Active 12 DOM
-
2026-06-01days on market $425,000 Active 11 DOM
-
2026-05-31days on market $425,000 Active 10 DOM
-
2026-05-30days on market $425,000 Active 9 DOM
-
2026-05-20$425,000 Active
Show marketing remark (405 chars)
Welcome to the ultimate real estate strategy in the heart of Imperial County's booming growth area! This 4-unit property (quadruplex) offers an incredible opportunity for a savvy buyer to live in one unit while letting the other three units pay down the mortgage. Whether you are looking to buy your first home, investment property or want a smart way to downsize, this property delivers financial upside.
-
2026-05-20$425,000 Active 405-char remark
Show marketing remark (405 chars)
Welcome to the ultimate real estate strategy in the heart of Imperial County's booming growth area! This 4-unit property (quadruplex) offers an incredible opportunity for a savvy buyer to live in one unit while letting the other three units pay down the mortgage. Whether you are looking to buy your first home, investment property or want a smart way to downsize, this property delivers financial upside.
-
2026-05-01historical
-
2025-10-28$429,000 Active
-
2025-10-28$429,000 Active
-
2013-08-30soldstatus $130,000
-
2005-10-28soldstatus $225,000
-
1996-11-08soldstatus $100,000
ⓘ Source: listings_history table (triggers on properties + properties_extension) + one-shot
backfill from property_details.listing_events for pre-trigger history.
Tax reassessment forecast CA · Resets to sale price
- Current annual tax
- $1,919 · $160/mo
- Projected year-2 tax
- $3,230 · $269/mo
- Expected delta
- +$1,311/yr (+$109/mo · 68.3%)
ⓘ Screening estimate from a state-policy table — verify with the county assessor before closing.
Climate risk First Street
- Flood 1/10 Low FEMA zone X (unshaded) · 0% chance over 30 yrs
- Wildfire 3/10 Moderate
- Heat 10/10 Extreme 7 d/yr ≥114°F today · 21 d/yr by 30 yrs out
- Wind 1/10 Low
- Air quality 2/10 Low 2 unhealthy d/yr today · 2 by 30 yrs out
Nearby sold comps map
Loading sold comps map…
Walkable amenities ~0.75 mi
Loading nearby amenities…
Taxation est. · year 1
- Rental income
- $48,000
- − Mortgage interest
- −$23,807
- − Property taxes
- −$1,919
- − Insurance
- −$2,125
- − Repairs & maintenance
- −$3,840
- − Management
- −$3,840
- − Depreciation
- −$12,364
- Taxable income
- $106
- Est. tax owed @ 24.0%
- −$25
- After-tax cash flow
- $7,105/yr
For passive investors: Depreciation is non-cash, so a rental often shows a tax loss while cash-flowing — sheltering income. Rental losses are passive: they offset passive income freely, and up to $25,000/yr can offset ordinary (W-2) income if you actively participate and your MAGI is under $100k (phasing out to $0 by $150k); unused losses carry forward. On sale, claimed depreciation is recaptured at up to 25%, and gains may owe capital-gains tax (a 1031 exchange can defer both). Figures are a year-1 estimate at your 24.0% rate — not tax advice; consult a CPA.
Schools (NCES district)
- District
- Calipatria Unified
- NCES district ID
- 0606990
- Math proficiency
- 9% ▼ -18.00%
- Reading proficiency
- 27% ▼ -18.00%
- Median HH income
- $30,088
- Composite
- 14.28/100
- National rank
- #9446
- State rank
- #485 of 517 in CA
Livability — Calipatria
- Score
- 56/100
- State rank
- #789
- US rank
- #22633
Category grades
Schools grade is shown separately in the Schools card above.
Census & demographics
- Census place
- Calipatria, CA
- Population (ZIP)
- 6,837
Population outlook (Imperial County) Hauer SSP2
- Today (2025)
- 186,713 people
- By 2030
- 190,022 · +1.8%
- By 2040
- 195,993 · +5.0%
- By 2050
- 199,534 · +6.9%
- By 2075
- 216,878 · +16.2%
- By 2100
- 352,705 · +88.9%
Race, ethnicity, and origin ACS 2023
- Neighborhood character
- Predominantly Hispanic (80%)
- Race & ethnicity
- Hispanic / Latino 80% Two or more races 22% Black 9% White 7% Asian 1%
- Hispanic origin (detail)
- Mexican 75% Puerto Rican 1%
- Common ancestry
- Iranian 1% Lithuanian 1% Slovak 0%
- Foreign-born
- 20% · Canada, South Korea
- Languages at home
- 31% English-only · Spanish 67% Korean 1%
Political lean MEDSL · Imperial
- 2024 margin
- Toss-up / Even · D 48.3% · R 49.1% · Other 2.6%
- 2008→2024 swing
- -27.0pp toward R · 2008: 26.2pp · 2024: -0.9pp
- All cycles
- 2024: R+0.9 2020: D+24.4 2016: D+41.1 2012: D+28.8 2008: D+26.2
Not yet ingested
- Civics
- —
Market trends
- HPI YoY
- ▲ 8.24%
- Current HPI
- 426.7554
- Rent YoY
- —
- Metro
- —
- State GDP YoY
- ▲ 3.21%
- F500 in state
- 116
Industry mix (Fortune 500 HQ in CA)
| Industry | F500 HQs | Revenue |
|---|---|---|
| Technology | 27 | $1,492B |
|
||
| Financial Services | 3 | $174B |
|
||
| Retail | 3 | $44B |
|
||
| Insurance | 3 | $26B |
|
||
| Media / Entertainment | 2 | $115B |
|
||
| Pharmaceuticals / Biotech | 2 | $62B |
|
||
Price history
+325.0% since first listed8 events — show timeline
- 2026-05-20 Listed $425,000 ICAOR
- 2026-05-20 Listed $425,000 SDMLS
- 2026-05-01 Listing Removed — SDMLS
- 2025-10-28 Listed $429,000 SDMLS
- 2025-10-28 Listed $429,000 ICAOR
- 2013-08-30 Sold (Public Records) $130,000 Public Records
- 2005-10-28 Sold (Public Records) $225,000 Public Records
- 1996-11-08 Sold (Public Records) $100,000 Public Records
Property tax history
+1.7%/yrLatest (2025): $1,919 · -6.0% YoY. Source: county tax records.
Cash-flow waterfall
monthlySold comps — $/sqft
last 12 mo · ≤1 miLoading sold comps…