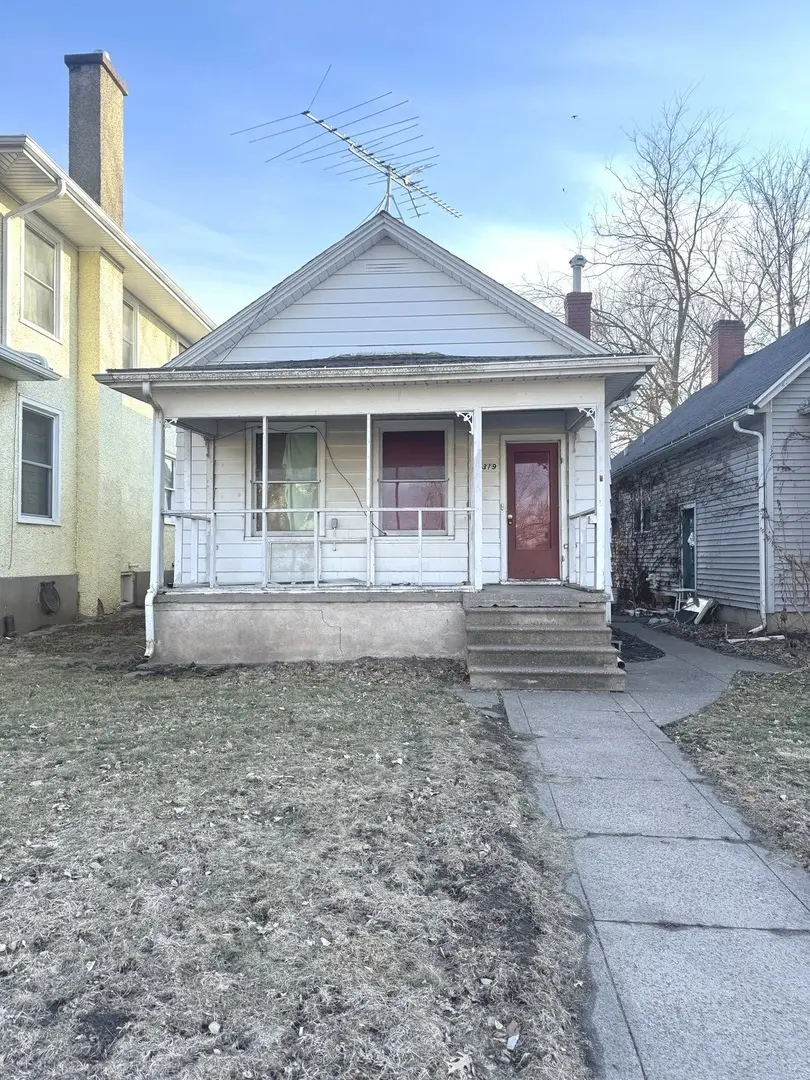
319 1st Ave · Clinton, IA
Flood risk 4/10 · Minor
- FEMA flood zone
- X
- Chance of flooding over 30 yrs
- 0.22%
- Est. flood insurance / yr
- $473 – $860
Fire risk 2/10 · Minimal
- Est. fire insurance / yr
- $902 – $1,676
Heat risk 3/10 · Minor
- Hot days now (above 103°F)
- 7 days/yr
- Hot days in 30 yrs
- 16 days/yr
Wind risk 2/10 · Minimal
- Chance of severe wind over 30 yrs
- —
Air-quality risk 3/10 · Minor
- Unhealthy air days now
- 2 days/yr
- Unhealthy air days in 30 yrs
- 3 days/yr
Risk factors via First Street. Map © Google.
Why this score? — see what drove the C+ grade
The composite is a weighted blend of 9 inputs, each scored 0–100. Each bar is that input's sub-score; the figure is the points it added to the 100-point composite (weight × sub-score).
- Cash flow +30.0/30.0
- 1% rule +10.0/10.0
- DSCR +10.0/10.0
- Schools +4.5/10.0
- Livability +3.8/5.0
- Rent growth +2.5/5.0
- Condition / age +2.5/5.0
- ARV discount +0.8/15.0
- Appreciation +0.0/10.0
$35,000
🖨 Deal sheet (PDF) 📄 Offer letter ✓ Due diligence
Listing remarks MLS
Affordable, one level home for sale! This home has two bedrooms and one full bath, which is attached to the primary bedroom. There's a one car garage out back. Updates include a new furnace, updated AC, water heater ~5 years old, and all appliances can stay!
Key facts
- One level home
- New furnace
- Updated ac
Tags
Neighborhood map
What this means for you Summary
Snapshot
- This is a 2-bed/1.0-bath single-family listed at $35k.
Deal economics
- At list price, monthly cash flow is $333 ($4k/yr) — positive.
- The deal already cash-flows at list — no discount required.
- Meets the 1% rule at list price ($757 rent vs $35k).
- Recommended offer: $31k (12.0% below list) — sets the bar for market timing.
- Cap rate 17.7% vs local median 6.7% in Clinton — top-decile yield for the area; either an underpriced asset or a hidden risk that comps aren't pricing in. Stress-test before assuming the spread holds.
Location & tenants
- Location reads 75/100 on livability (#222 in IA, #4,192 nationally) — a middle-class / working-renter tenant base. Strengths: cost of living A+, housing A+, health & safety A+; Watch: amenities C-, crime D, employment D.
- Clinton Community School District (town): math 52% / reading 56% proficiency, ranked #273 of 289 in IA (top 94%) — acceptable for families but not a draw, mixed tenant base, ~2y average lease.
- Market conditions: 246 active listings in the ZIP; 3 comparable units currently listed for rent nearby; rentals lingering (median 45d on market — plan ~5-8 weeks vacancy on turnover, expect pricing pressure); 100% of comp listings sitting > 30 days — soft ceiling on asking rent; 116 units permitted in Clinton County in 2024 (50 in 5+ unit buildings).
- This rent is only 15% of the median local income ($61k/yr) — well below the 30% rent-burden line; pricing power to push rent on renewal without tenant pushback.
Forward outlook
- Local home prices are declining (-3.0%/yr); year-one equity from $242 of loan paydown is wiped out by about $1k of value loss. Plan a longer hold.
- Clinton County population projected at -19% by 2050 — secular population decline; favor cash flow + early exit over multi-decade hold.
- At projected returns (-3.0% appreciation + 3.0% rent growth), your $10k cash investment doubles in ~3 years — after that, you're playing with house money.
Negotiation context
- It's been on market 127 days — a 12% lower offer ($31k) is reasonable based on typical stale-listing flexibility.
- 7 sale attempts since 18y ago with the ask held roughly flat each time — persistent listings suggest the price (not the market) is what's stuck; bring a comps-based counter.
- Current owner paid $25k; 40% above their basis — modest negotiation headroom, anchor on the comps not their cost.
Risks & watch-outs
- Watch-outs: built in 1900 — expect roof / HVAC / electrical / plumbing capex.
Questions for the listing agent
- It's been on market 127 days. Have you received any prior offers? Is the seller open to a 12% concession, seller financing, or rate buy-down credit?
- Built in 1900 — when were the roof, HVAC, electrical panel, plumbing, and water heater last replaced?
- Why hasn't it sold? Are there any deal-killer items the seller is aware of (foundation, flood, title, zoning, code violations)?
- Is there a deadline driving the sale (1031 exchange, divorce, estate, relocation)? That informs how much negotiation room exists.
- Schools are B-rated — typically a magnet for longer-tenancy family renters. What's the average tenant stay here, and is there a school-zone premium baked into asking?
- Crime grade is D in this area — have there been break-ins, vandalism, or insurance claims at this property in the last 3 years? What carrier currently insures it and at what premium?
- What's the average days-on-market for RENTAL listings here right now (not sales)? A rising rental-DOM trend means longer vacancies and softer asking-rent achievability than the comps imply.
- What's the recent tenant-quality profile in this submarket — average credit score on applications, eviction rate, late-payment / NSF rate, and stable-employment percentage? A property-management company in the area should have these aggregated.
- How much new for-sale + rental construction is in the pipeline within 1–3 miles? Heavy new supply typically softens prices + rents 12–24 months out; constrained supply supports both.
Investment metrics
- 1% rule
- 2.16% ✓
- Cap rate
- 17.70%
- Cash-on-cash
- 40.74%
- DSCR
- 2.81
- GRM
- 3.9
CMA / ARV
- ARV (median comp)
- $30,478
- List price
- $35,000
- Delta
- 14.84%
- Verdict
- OVERPRICED
- Comps
- 20 within 1.0 mi
Show comp detail 12 sales within ~0.75 mi
| Address | Dist | Beds/Ba | Sqft | Sold | Price | $/sf | Match |
|---|---|---|---|---|---|---|---|
| 204 Adams Pl | 0.47mi | 2/1.0 | 847 (-0%) | 1mo | $78,400 | $93 | 77 |
| 235 4th Ave N | 0.21mi | 2/1.0 | 785 (-8%) | 3mo | $24,900 | $32 | 75 |
| 515 1st Ave | 0.25mi | 2/1.0 | 917 (+8%) | 6mo | $96,500 | $105 | 70 |
| 504 N 4th St | 0.33mi | 2/1.0 | 921 (+8%) | 2mo | $60,000 | $65 | 69 |
| 500 4th Ave N | 0.34mi | 1/1.0 (-1) | 812 (-4%) | 5mo | $84,500 | $104 | 67 |
| 435 3rd Ave N | 0.25mi | 2/1.0 | 918 (+8%) | 10mo | $56,000 | $61 | 66 |
| 410 N 3rd St | 0.23mi | 2/1.5 | 740 (-13%) | 1mo | $17,000 | $23 | 64 |
| 617 N 5th St | 0.46mi | 3/1.0 (+1) | 826 (-3%) | 14mo | $44,500 | $54 | 58 |
| 814 Park Pl | 0.57mi | 2/1.0 | 936 (+10%) | 7mo | $67,500 | $72 | 51 |
| 627 1st Ave | 0.44mi | 3/1.0 (+1) | 928 (+9%) | 12mo | $15,000 | $16 | 49 |
| 725 4th Ave S | 0.63mi | 1/1.0 (-1) | 816 (-4%) | 15mo | $45,000 | $55 | 46 |
| 622 N 4th St | 0.44mi | 2/1.0 | 726 (-15%) | 15mo | $24,250 | $33 | 42 |
Match score weights: distance 35% · size 25% · config 20% · recency 20%. Top-matched comps best support the ARV.
Projected returns pro-forma
-3.0% appreciation · 3.0% rent growth · sell at horizon
- IRR
- 37.2%
- Equity multiple
- 2.59×
- Total profit
- $15,543
- Equity at exit
- $5,219
- IRR
- 43.8%
- Equity multiple
- 5.18×
- Total profit
- $40,923
- Equity at exit
- $3,026
Cash invested: $9,800 (down + closing). Projections, not guarantees.
Landlord ↔ Tenant lean methodology
- Overall (STATE)
- 83 Strongly Landlord-Friendly
- State Iowa
- 83 Strongly Landlord-Friendly · R+6
- County
- — inherits STATE
- City
- — inherits STATE
ZIP-level market 52732
- Home prices YoY
- -34.9%
- Active inventory
- 246
- Price-to-rent
- 3.9×
Monthly cashflow live
- Estimated rent
- $757 medium interval (Pro) →
- Mortgage (P&I)
- −$184
- Tax from tax record
- −$67 /mo · $804/yr
- Insurance
- −$15
- HOA
- −$0
- Vacancy / Maint / Mgmt
- −$159
- Net cashflow
- $333
Break-even live
Sensitivity live
| Price | -10% $352 | -5% $343 | +0% $333 | +5% $323 | +10% $313 |
|---|---|---|---|---|---|
| Rent | -10% $273 | -5% $303 | +0% $333 | +5% $363 | +10% $392 |
| Rate | -1.0pp $350 | -0.5pp $342 | base $333 | +0.5pp $324 | +1.0pp $314 |
UW: 25.0% down · 7.5% · 30yr · 1.5% tax · 5.0% vac · 8.0% maint · 8.0% mgmt
Financing live
Cash to close
- Down payment
- $8,750
- Closing costs
- $1,050
- Reserves months
- —
- Total cash needed
- —
Loan-product check · same deal, 3 products live
Conventional
25% down · 7.5% · 30yr
- Down + closing
- —
- Monthly P&I
- —
- Monthly cashflow
- —
- DSCR
- —
- Eligible?
- —
Personal DTI + credit; lowest rate.
DSCR
20% down · 8.5% · 30yr
- Down + closing
- —
- Monthly P&I
- —
- Monthly cashflow
- —
- DSCR
- —
- Eligible?
- —
No personal income docs; deal must DSCR.
Hard money
10% down · 12.0% · 12mo
- Down + closing
- —
- Monthly P&I
- —
- Monthly cashflow
- —
- DSCR
- —
- Eligible?
- —
Short-term bridge; refi at stabilization.
Rent comps 3 comps
| Address | Beds | Baths | Sqft | Rent | $/sqft | DOM | Units | Dist |
|---|---|---|---|---|---|---|---|---|
| 516 2nd Ave S Unit 2 Clinton, IA | 2.0 | 1.0 | 1082 | $750 | $0.69 | 44d | 1 | 0.24mi |
| 416 7th Ave S Unit C Clinton, IA | 1.0 | 1.0 | 773 | $700 | $0.91 | 44d | 1 | 0.41mi |
| 1216 9th Ave S Clinton, IA | 2.0 | 1.0 | 804 | $1,000 | $1.24 | 44d | 1 | 1.31mi |
Listing history 30 events
-
2026-06-19days on market $35,000 Active 127 DOM
-
2026-06-18days on market $35,000 Active 126 DOM
-
2026-06-17days on market $35,000 Active 125 DOM
-
2026-06-16days on market $35,000 Active 124 DOM
-
2026-06-15days on market $35,000 Active 123 DOM
-
2026-06-14days on market $35,000 Active 121 DOM
-
2026-06-12days on market $35,000 Active 120 DOM
-
2026-06-09days on market $35,000 Active 117 DOM
-
2026-06-08days on market $35,000 Active 116 DOM
-
2026-06-07days on market $35,000 Active 115 DOM
-
2026-06-07days on market $35,000 Active 114 DOM
-
2026-06-03days on market $35,000 Active 111 DOM
-
2026-06-02days on market $35,000 Active 110 DOM
-
2026-06-01days on market $35,000 Active 109 DOM
-
2026-05-31days on market $35,000 Active 108 DOM
-
2026-05-30days on market $35,000 Active 107 DOM
-
2026-02-12$35,000 Active 258-char remark
Show marketing remark (258 chars)
Affordable, one level home for sale! This home has two bedrooms and one full bath, which is attached to the primary bedroom. There's a one car garage out back. Updates include a new furnace, updated AC, water heater ~5 years old, and all appliances can stay!
-
2017-04-17soldstatus $25,000
-
2017-04-12soldstatus $25,000 391-char remark
Show marketing remark (391 chars)
NO MORE THROWING MONEY AWAY ON RENT!!! FIND OUT HOW YOU MAY OWN THIS AFFORDABLE 2 BEDROOM HOME IN THE NORTHEND AND CLOSE TO SHOPPING AND SCHOOLS! Fresh paint, fixtures and flooring. This property may also be offered on as a grouping with 4 other comparable properties. Take advantage of the low interest rates lenders have to offer and make this house your new home or turn key investment!!!
-
2016-10-03$27,500 391-char remark
Show marketing remark (391 chars)
NO MORE THROWING MONEY AWAY ON RENT!!! FIND OUT HOW YOU MAY OWN THIS AFFORDABLE 2 BEDROOM HOME IN THE NORTHEND AND CLOSE TO SHOPPING AND SCHOOLS! Fresh paint, fixtures and flooring. This property may also be offered on as a grouping with 4 other comparable properties. Take advantage of the low interest rates lenders have to offer and make this house your new home or turn key investment!!!
-
2008-07-29soldstatus $27,500
-
2008-07-29soldstatus $27,500
-
2008-07-29soldstatus $27,500
-
2008-07-29soldstatus $27,500
-
2008-02-27$31,900
-
2008-02-27$31,900
-
2008-02-27$39,900
-
2008-02-27$39,900
ⓘ Source: listings_history table (triggers on properties + properties_extension) + one-shot
backfill from property_details.listing_events for pre-trigger history.
Tax reassessment forecast IA · Partial reset (capped growth)
- Current annual tax
- $804 · $67/mo
- Projected year-2 tax
- $804 · $67/mo
- Expected delta
- $0/yr ($0/mo · 0.0%)
ⓘ Screening estimate from a state-policy table — verify with the county assessor before closing.
Climate risk First Street
- Flood 4/10 Moderate FEMA zone X · 22% chance over 30 yrs
- Wildfire 2/10 Low
- Heat 3/10 Moderate 7 d/yr ≥103°F today · 16 d/yr by 30 yrs out
- Wind 2/10 Low
- Air quality 3/10 Moderate 2 unhealthy d/yr today · 3 by 30 yrs out
Nearby sold comps map
Loading sold comps map…
Walkable amenities ~0.75 mi
Loading nearby amenities…
Taxation est. · year 1
- Rental income
- $9,081
- − Mortgage interest
- −$1,961
- − Property taxes
- −$804
- − Insurance
- −$175
- − Repairs & maintenance
- −$726
- − Management
- −$726
- − Depreciation
- −$1,018
- Taxable income
- $3,670
- Est. tax owed @ 24.0%
- −$881
- After-tax cash flow
- $3,111/yr
For passive investors: Depreciation is non-cash, so a rental often shows a tax loss while cash-flowing — sheltering income. Rental losses are passive: they offset passive income freely, and up to $25,000/yr can offset ordinary (W-2) income if you actively participate and your MAGI is under $100k (phasing out to $0 by $150k); unused losses carry forward. On sale, claimed depreciation is recaptured at up to 25%, and gains may owe capital-gains tax (a 1031 exchange can defer both). Figures are a year-1 estimate at your 24.0% rate — not tax advice; consult a CPA.
Schools (NCES district)
- District
- Clinton Community School District
- NCES district ID
- 1907710
- Math proficiency
- 52% ▼ -13.00%
- Reading proficiency
- 56% ▼ -8.00%
- Median HH income
- $40,900
- Composite
- 45.22/100
- National rank
- #2666
- State rank
- #273 of 289 in IA
Livability — Clinton
- Score
- 75/100
- State rank
- #222
- US rank
- #4192
Category grades
Schools grade is shown separately in the Schools card above.
Census & demographics
- Census place
- Clinton, IA
- County
- Clinton County · 25,880 people
- City population
- 25,880
- Metro
- Clinton, IA
- Population (ZIP)
- 25,880
- Household income
- $61,105
- Rent vs Own
- Severe rent burden
- 889.0
Population outlook (Clinton County) Hauer SSP2
- Today (2025)
- 44,817 people
- By 2030
- 43,090 · -3.9%
- By 2040
- 39,513 · -11.8%
- By 2050
- 36,209 · -19.2%
- By 2075
- 31,888 · -28.8%
- By 2100
- 30,382 · -32.2%
Race, ethnicity, and origin ACS 2023
- Neighborhood character
- Predominantly White (86%)
- Race & ethnicity
- White 86% Two or more races 7% Hispanic / Latino 5% Black 4%
- Common ancestry
- Iranian 4% Portuguese 2% Lithuanian 2%
- Foreign-born
- 2% · Canada
- Languages at home
- 97% English-only · Spanish 2% Arabic 1%
Political lean MEDSL · Clinton
- 2024 margin
- R (+18.9) · D 39.8% · R 58.6% · Other 1.6%
- 2008→2024 swing
- -41.9pp toward R · 2008: 23.0pp · 2024: -18.9pp
- All cycles
- 2024: R+18.9 2020: R+10.3 2016: R+5.1 2012: D+22.9 2008: D+23.0
Not yet ingested
- Civics
- —
Market trends
- HPI YoY
- ▼ -83.23%
- Current HPI
- 155.3426
- Rent YoY
- —
- Metro
- Clinton, IA
- State GDP YoY
- ▲ 2.48%
- F500 in state
- 4
Industry mix (Fortune 500 HQ in IA)
| Industry | F500 HQs | Revenue |
|---|---|---|
| Financial Services | 1 | $16B |
|
||
| Retail / Convenience | 1 | $15B |
|
||
Price history
+9.7% since first listed14 events — show timeline
- 2026-02-12 Listed $35,000 MRED as Distributed by MLS Grid
- 2017-04-17 Sold (Public Records) $25,000 Public Records
- 2017-04-12 Sold (MLS) $25,000 RMLSA as Distributed by MLS Grid
- 2017-04-12 Sold (MLS) $25,000 MRED as Distributed by MLS Grid
- 2016-10-03 Listed $27,500 RMLSA as Distributed by MLS Grid
- 2016-10-03 Listed $27,500 MRED as Distributed by MLS Grid
- 2008-07-29 Sold (MLS) $27,500 MRED as Distributed by MLS Grid
- 2008-07-29 Sold (MLS) $27,500 RMLSA as Distributed by MLS Grid
- 2008-07-29 Sold (MLS) $27,500 MRED as Distributed by MLS Grid
- 2008-07-29 Sold (MLS) $27,500 RMLSA as Distributed by MLS Grid
- 2008-02-27 Listed $39,900 MRED as Distributed by MLS Grid
- 2008-02-27 Listed $39,900 RMLSA as Distributed by MLS Grid
- 2008-02-27 Listed $31,900 MRED as Distributed by MLS Grid
- 2008-02-27 Listed $31,900 RMLSA as Distributed by MLS Grid
Property tax history
+1.9%/yrLatest (2025): $804 · +1.5% YoY. Source: county tax records.
Cash-flow waterfall
monthlySold comps — $/sqft
last 12 mo · ≤1 miLoading sold comps…