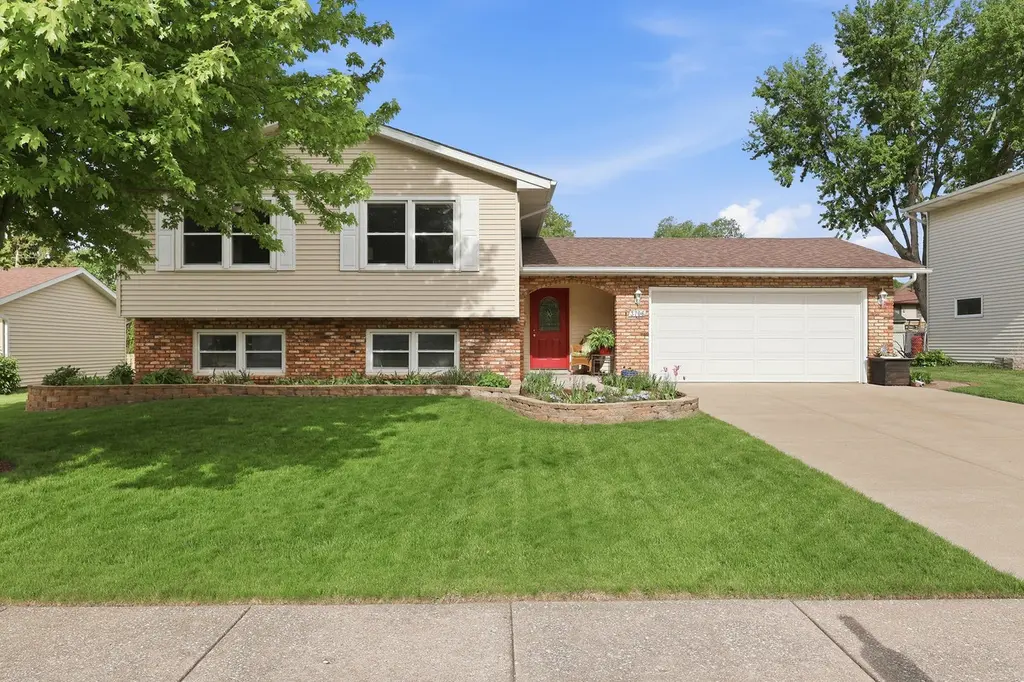
3706 Tam O Shanter Dr · Bettendorf, IA
Flood risk 1/10 · Minimal
- FEMA flood zone
- X (unshaded)
- Chance of flooding over 30 yrs
- 0.0%
- Est. flood insurance / yr
- $473 – $860
Fire risk 1/10 · Minimal
- Est. fire insurance / yr
- $902 – $1,676
Heat risk 3/10 · Minor
- Hot days now (above 103°F)
- 7 days/yr
- Hot days in 30 yrs
- 16 days/yr
Wind risk 2/10 · Minimal
- Chance of severe wind over 30 yrs
- —
Air-quality risk 3/10 · Minor
- Unhealthy air days now
- 2 days/yr
- Unhealthy air days in 30 yrs
- 3 days/yr
Risk factors via First Street. Map © Google.
Why this score? — see what drove the C- grade
The composite is a weighted blend of 9 inputs, each scored 0–100. Each bar is that input's sub-score; the figure is the points it added to the 100-point composite (weight × sub-score).
- Cash flow +19.4/30.0
- ARV discount +8.6/15.0
- Schools +6.5/10.0
- DSCR +6.1/10.0
- 1% rule +4.6/10.0
- Livability +4.0/5.0
- Rent growth +3.2/5.0
- Condition / age +2.5/5.0
- Appreciation +0.0/10.0
$299,500
🖨 Deal sheet 📄 Offer letter ✓ Due diligence
Listing remarks
Mint Condition! - Side level split foyer in convenient Bettendorf location. Features 5 Bedrooms, 2 Baths, attached 2 car garage; lush and lovely fenced yard with concrete patio, storage shed, and circular fire pit area. Brand new main level carpet/interior paint. Nice kitchen remodel w/ added cabinets, quartz countertops, LVP flooring and stainless steel appliances that all stay. Lower Level includes cozy family room; 2 additional bedrooms; bathroom; and spacious laundry/storage area. New roof 2022. Pride of Ownership - make this your new home!
Key facts
- Quartz countertops
- Fenced yard
- Concrete patio
Tags
Property features AI
Finance
- Other: Living area reported as estimated; Total finished/unfinshed area reported; upper, main, and lower area breakdown available; Located on lot less than 0.25 acre (dimensions: 71.94 x 119.9 x 70.31 x 122.7)
- HOA & community: No master association fee required
Exterior
- Parking: Attached garage owned (2 garage spaces, 2 total parking spaces)
- Utilities: Public water; Public sewer; Electric with circuit breakers; Cable available
- Home design: Detached single-family home; Split-level / bi-level design; Fee simple ownership
- Construction: Vinyl siding with brick/stone veneer front; Concrete perimeter foundation; Built approximately 41–50 years ago; Property not rebuilt or rehabilitated
- Exterior features: Patio; Fire pit; Fenced yard
Interior
- Kitchen: Range; Microwave; Dishwasher; Refrigerator; Stainless steel appliances
- Bedrooms: 5 bedrooms (Master, Bedroom 2, Bedroom 3 on main level; Bedrooms 4 and 5 on lower level)
- Flooring: Carpet in multiple rooms and bedrooms; Engineered hardwood in one bedroom; Laminate flooring in some areas; Ceramic tile in foyer; Luxury vinyl in kitchen
- Bathrooms: 2 full bathrooms; Basement includes bathroom access
- Heating & cooling: Natural gas forced air heating; Central air conditioning
- Interior features: Drapes on windows; Partially finished daylight full basement; 8 total rooms
- Laundry & utility: Laundry room on lower level with sink; Gas and electric dryer hookups
Neighborhood map
What this means for you Summary
Snapshot
- This is a 5-bed/2.0-bath single-family listed at $300k.
Deal economics
- At list price, monthly cash flow is $332 ($4k/yr) — positive.
- The deal already cash-flows at list — no discount required.
- To meet the 1% rule (rent ≥ 1% of price), the offer needs to be $289k (3.6% below list).
- Recommended offer: $289k (3.6% below list) — sets the bar for 1% rule.
- Cap rate 7.6% vs local median 3.0% in Bettendorf — top-decile yield for the area; either an underpriced asset or a hidden risk that comps aren't pricing in. Stress-test before assuming the spread holds.
Location & tenants
- Location reads 81/100 on livability (#73 in IA, #1,579 nationally) — a professional / high-income tenant draw. Strengths: schools A+, crime A+, employment A+; Watch: amenities F, commute F.
- Bettendorf Community School District (suburban): math 74% / reading 75% proficiency, ranked #57 of 289 in IA (top 20%) — strong family-tenant draw, lease renewals of 3-5y typical.
- Market conditions: Rents rising (+2.9%/yr); 426 active listings in the ZIP; 3 comparable units currently listed for rent nearby; rentals leasing fast (median 14d on market — plan ~1-2 weeks tenant-placement turnaround); solid renter incomes; 805 units permitted in Scott County in 2024 (479 in 5+ unit buildings).
- This rent runs 34% of the median local income ($102k/yr) — at the standard rent-burdened threshold; future hikes will face affordability resistance.
Forward outlook
- Local home prices are declining (-3.0%/yr); year-one equity from $2k of loan paydown is wiped out by about $9k of value loss. Plan a longer hold.
- Scott County population projected at +19% by 2050 — long-run rental-demand tailwind backs the buy-and-hold thesis.
Negotiation context
- Only 2 days on market — expect competitive offers; lowballing is unlikely to land.
Questions for the listing agent
- Built in 1977 — when were the roof, HVAC, electrical panel, plumbing, and water heater last replaced?
- Is there a deadline driving the sale (1031 exchange, divorce, estate, relocation)? That informs how much negotiation room exists.
- Schools are A-rated — typically a magnet for longer-tenancy family renters. What's the average tenant stay here, and is there a school-zone premium baked into asking?
- What's the average days-on-market for RENTAL listings here right now (not sales)? A rising rental-DOM trend means longer vacancies and softer asking-rent achievability than the comps imply.
- What's the recent tenant-quality profile in this submarket — average credit score on applications, eviction rate, late-payment / NSF rate, and stable-employment percentage? A property-management company in the area should have these aggregated.
- How much new for-sale + rental construction is in the pipeline within 1–3 miles? Heavy new supply typically softens prices + rents 12–24 months out; constrained supply supports both.
Investment metrics
- 1% rule
- 0.96% ✗
- Cap rate
- 7.62%
- Cash-on-cash
- 4.76%
- DSCR
- 1.21
- GRM
- 8.6
CMA / ARV
- ARV (on-the-fly)
- $307,272
- Comps found
- 12
Show comp detail 12 sales within ~0.75 mi
| Address | Dist | Beds/Ba | Sqft | Sold | Price | $/sf | Match |
|---|---|---|---|---|---|---|---|
| 3610 Tam-o-shanter Dr | 0.06mi | 5/3.0 | 1,707 (-2%) | 11mo | $337,500 | $198 | 81 |
| 3731 EL Dorado Dr | 0.14mi | 4/2.0 (-1) | 1,671 (-4%) | 7mo | $245,000 | $147 | 76 |
| 2305 Echodale Dr | 0.22mi | 4/2.0 (-1) | 1,793 (+3%) | 14mo | $278,000 | $155 | 68 |
| 3555 Eldorado Dr | 0.17mi | 4/2.0 (-1) | 1,636 (-6%) | 13mo | $289,900 | $177 | 67 |
| 3608 Parkdale Dr | 0.07mi | 4/1.5 (-1) | 1,930 (+11%) | 6mo | $260,000 | $135 | 66 |
| 3332 Wakonda Dr | 0.41mi | 4/2.0 (-1) | 1,670 (-4%) | 11mo | $155,000 | $93 | 60 |
| 3511 Eldorado Dr | 0.19mi | 4/2.0 (-1) | 1,481 (-15%) | 4mo | $237,500 | $160 | 58 |
| 2303 Pinehurst St | 0.31mi | 4/2.0 (-1) | 1,551 (-11%) | 11mo | $250,000 | $161 | 53 |
| 4003 Tanglefoot Ter | 0.50mi | 4/3.5 (-1) | 1,896 (+9%) | 1mo | $360,000 | $190 | 50 |
| 2620 Harmony Dr Dr | 0.74mi | 4/3.0 (-1) | 1,705 (-2%) | 6mo | $356,000 | $209 | 49 |
| 4590 Apple Valley Dr | 0.69mi | 4/2.0 (-1) | 1,918 (+10%) | 3mo | $347,500 | $181 | 43 |
| 2430 Navajo Dr | 0.73mi | 4/2.5 (-1) | 1,928 (+11%) | 3mo | $410,000 | $213 | 38 |
Match score weights: distance 35% · size 25% · config 20% · recency 20%. Top-matched comps best support the ARV.
Projected returns pro-forma
-3.0% appreciation · 2.88% rent growth · sell at horizon
- IRR
- -9.0%
- Equity multiple
- 0.67×
- Total profit
- $-27,742
- Equity at exit
- $44,656
- IRR
- 0.3%
- Equity multiple
- 1.02×
- Total profit
- $1,550
- Equity at exit
- $25,895
Cash invested: $83,860 (down + closing). Projections, not guarantees.
Landlord ↔ Tenant lean methodology
- Overall (STATE)
- 83 Strongly Landlord-Friendly
- State Iowa
- 83 Strongly Landlord-Friendly · R+6
- County
- — inherits STATE
- City
- — inherits STATE
ZIP-level market 52722
- Rents YoY
- 2.9%
- Active inventory
- 426
- Price-to-rent
- 8.6×
Monthly cashflow live
- Estimated rent
- $2,886 medium interval (Pro) →
- Mortgage (P&I)
- −$1,571
- Tax from tax record
- −$252 /mo · $3,030/yr
- Insurance
- −$125
- HOA
- −$0
- Vacancy / Maint / Mgmt
- −$606
- Net cashflow
- $332
Break-even live
UW: 25.0% down · 7.5% · 30yr · 1.5% tax · 5.0% vac · 8.0% maint · 8.0% mgmt
Financing live
Cash to close
- Down payment
- $74,875
- Closing costs
- $8,985
- Reserves months
- —
- Total cash needed
- —
Loan-product check · same deal, 3 products live
Conventional
25% down · 7.5% · 30yr
- Down + closing
- —
- Monthly P&I
- —
- Monthly cashflow
- —
- DSCR
- —
- Eligible?
- —
Personal DTI + credit; lowest rate.
DSCR
20% down · 8.5% · 30yr
- Down + closing
- —
- Monthly P&I
- —
- Monthly cashflow
- —
- DSCR
- —
- Eligible?
- —
No personal income docs; deal must DSCR.
Hard money
10% down · 12.0% · 12mo
- Down + closing
- —
- Monthly P&I
- —
- Monthly cashflow
- —
- DSCR
- —
- Eligible?
- —
Short-term bridge; refi at stabilization.
Rent comps 3 comps
| Address | Beds | Baths | Sqft | Rent | $/sqft | DOM | Units | Dist |
|---|---|---|---|---|---|---|---|---|
| 3129 Windsor Dr Bettendorf, IA | 4.0 | 1.5 | 1440 | $2,500 | $1.74 | 20d | 1 | 0.36mi |
| 5101 Lakeview Pkwy Davenport, IA | 3.0–4.0 | 2.5–3.5 | 1800 | $4,990 | $2.77 | 13d | 6 | 0.85mi |
| 3851 Tanglefoot Ln Bettendorf, IA | 3.0–4.0 | 2.5–3.5 | 1800 | $2,695 | $1.50 | 13d | 1 | 1.24mi |
Listing history 2 events
-
2026-05-10status Pending
-
2026-05-08$299,500 Active
ⓘ Source: listings_history table (triggers on properties + properties_extension) + one-shot
backfill from property_details.listing_events for pre-trigger history.
Tax reassessment forecast IA · Partial reset (capped growth)
- Current annual tax
- $3,030 · $252/mo
- Projected year-2 tax
- $3,866 · $322/mo
- Expected delta
- +$836/yr (+$70/mo · 27.6%)
ⓘ Screening estimate from a state-policy table — verify with the county assessor before closing.
Climate risk First Street
- Flood 1/10 Low FEMA zone X (unshaded) · 0% chance over 30 yrs
- Wildfire 1/10 Low
- Heat 3/10 Moderate 7 d/yr ≥103°F today · 16 d/yr by 30 yrs out
- Wind 2/10 Low
- Air quality 3/10 Moderate 2 unhealthy d/yr today · 3 by 30 yrs out
Nearby sold comps map
Loading sold comps map…
Walkable amenities ~0.75 mi
Loading nearby amenities…
Taxation est. · year 1
- Rental income
- $34,637
- − Mortgage interest
- −$16,777
- − Property taxes
- −$3,030
- − Insurance
- −$1,498
- − Repairs & maintenance
- −$2,771
- − Management
- −$2,771
- − Depreciation
- −$8,713
- Taxable loss
- −$922
- Est. tax savings @ 24.0%
- +$221
- After-tax cash flow
- $4,210/yr
For passive investors: Depreciation is non-cash, so a rental often shows a tax loss while cash-flowing — sheltering income. Rental losses are passive: they offset passive income freely, and up to $25,000/yr can offset ordinary (W-2) income if you actively participate and your MAGI is under $100k (phasing out to $0 by $150k); unused losses carry forward. On sale, claimed depreciation is recaptured at up to 25%, and gains may owe capital-gains tax (a 1031 exchange can defer both). Figures are a year-1 estimate at your 24.0% rate — not tax advice; consult a CPA.
Schools (NCES district)
- District
- Bettendorf Community School District
- NCES district ID
- 1904860
- Math proficiency
- 74% ▼ -6.00%
- Reading proficiency
- 75% ▼ -2.00%
- Median HH income
- $66,823
- Composite
- 64.71/100
- National rank
- #522
- State rank
- #57 of 289 in IA
Livability — Bettendorf
- Score
- 81/100
- State rank
- #73
- US rank
- #1579
Category grades
Schools grade is shown separately in the Schools card above.
Census & demographics
- Census place
- Bettendorf, IA
- County
- Scott County · 144,583 people
- City population
- 41,264
- Metro
- Davenport-Moline-Rock Island, IA-IL
- Population (ZIP)
- 41,264
- Household income
- $101,546
- Rent vs Own
- Severe rent burden
- 935.0
Population outlook (Scott County) Hauer SSP2
- Today (2025)
- 188,878 people
- By 2030
- 196,648 · +4.1%
- By 2040
- 210,860 · +11.6%
- By 2050
- 224,359 · +18.8%
- By 2075
- 258,884 · +37.1%
- By 2100
- 286,447 · +51.7%
Race, ethnicity, and origin ACS 2023
- Neighborhood character
- Predominantly White (82%)
- Race & ethnicity
- White 82% Asian 7% Two or more races 7% Hispanic / Latino 5% Black 2%
- Common ancestry
- Portuguese 3% Italian 3% Romanian 2%
- Foreign-born
- 7% · Canada, China, Vietnam
- Languages at home
- 92% English-only · Other Asian/Pacific 2% Spanish 2% Other Indo-European 1%
Political lean MEDSL · Scott
- 2024 margin
- Toss-up / Even · D 47.3% · R 51.2% · Other 1.4%
- 2008→2024 swing
- -18.4pp toward R · 2008: 14.6pp · 2024: -3.9pp
- All cycles
- 2024: R+3.9 2020: D+3.5 2016: D+1.4 2012: D+13.8 2008: D+14.6
Not yet ingested
- Civics
- —
Market trends
- HPI YoY
- ▼ -111.45%
- Current HPI
- 194.8355
- Rent YoY
- ▲ 2.88%
- Metro
- Davenport-Moline-Rock Island, IA-IL
- State GDP YoY
- ▲ 2.48%
- F500 in state
- 4
Industry mix (Fortune 500 HQ in IA)
| Industry | F500 HQs | Revenue |
|---|---|---|
| Financial Services | 1 | $16B |
|
||
| Retail / Convenience | 1 | $15B |
|
||
Price history
2 events — show timeline
- 2026-05-10 Pending — MRED as Distributed by MLS Grid
- 2026-05-08 Listed $299,500 MRED as Distributed by MLS Grid
Property tax history
+1.9%/yrLatest (2025): $3,030 · -2.3% YoY. Source: county tax records.
Cash-flow waterfall
monthlySold comps — $/sqft
last 12 mo · ≤1 miLoading sold comps…