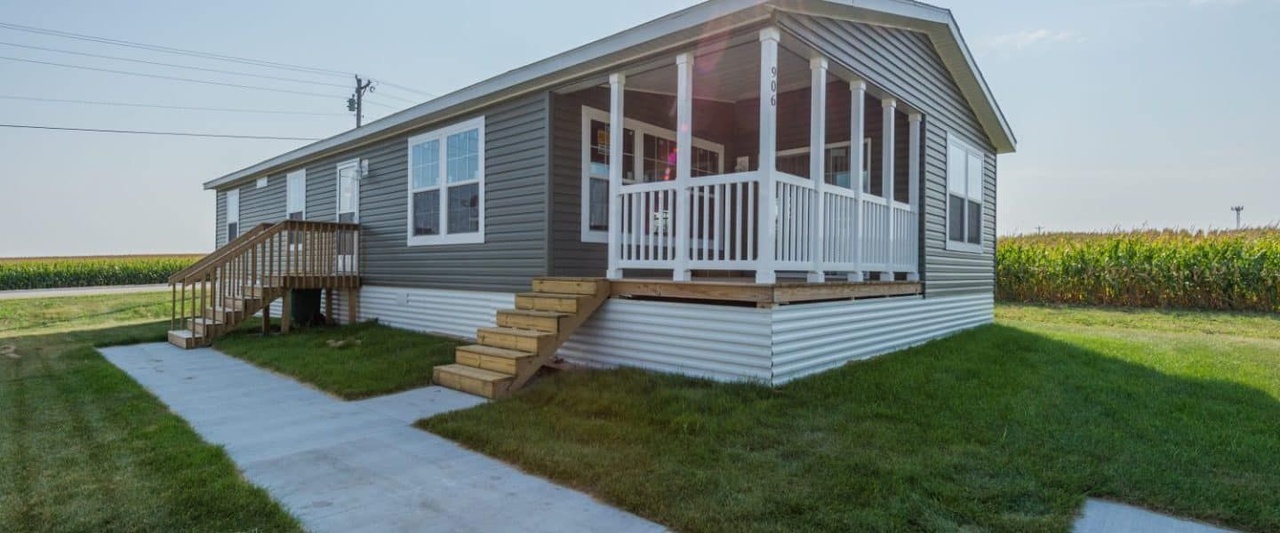
2 Bed 2 Bath Single Section Plan · Stewartville, MN
Flood risk No data
- FEMA flood zone
- —
- Chance of flooding over 30 yrs
- %
- Est. flood insurance / yr
- —
Fire risk No data
- Est. fire insurance / yr
- —
Heat risk No data
- Hot days now (above °F)
- days/yr
- Hot days in 30 yrs
- days/yr
Wind risk No data
- Chance of severe wind over 30 yrs
- %
Air-quality risk No data
- Unhealthy air days now
- days/yr
- Unhealthy air days in 30 yrs
- days/yr
Risk factors via First Street. Map © Google.
Why this score? — see what drove the D+ grade
The composite is a weighted blend of 9 inputs, each scored 0–100. Each bar is that input's sub-score; the figure is the points it added to the 100-point composite (weight × sub-score).
- Cash flow +15.0/30.0
- ARV discount +7.5/15.0
- 1% rule +5.0/10.0
- DSCR +5.0/10.0
- Schools +4.3/10.0
- Livability +4.2/5.0
- Rent growth +2.5/5.0
- Condition / age +2.5/5.0
- Appreciation +0.0/10.0
$35,900
🖨 Deal sheet (PDF) 📄 Offer letter ✓ Due diligence
Key facts
- Clubhouse
- Tree-lined streets
- Wooded setting
Tags
Neighborhood map
What this means for you Summary
Snapshot
- This is a 2-bed/2.0-bath manufactured listed at $36k.
Deal economics
- At list price, monthly cash flow is $935 ($11k/yr) — positive.
- The deal already cash-flows at list — no discount required.
- Meets the 1% rule at list price ($1k rent vs $36k).
- Recommended offer: $32k (12.0% below list) — sets the bar for market timing.
- Cap rate 37.5% vs local median 2.6% in Stewartville — top-decile yield for the area; either an underpriced asset or a hidden risk that comps aren't pricing in. Stress-test before assuming the spread holds.
Location & tenants
- Location reads 85/100 on livability (#18 in MN, #527 nationally) — a professional / high-income tenant draw. Strengths: commute A+, employment A+, housing A+; Watch: amenities F.
- Stewartville Public School District (town): math 46% / reading 52% proficiency, ranked #120 of 301 in MN (top 40%) — families likely to look elsewhere, expect single-tenant / working-renter base with shorter leases; only 17% free/reduced lunch — higher-income household profile.
- Market conditions: 67 active listings in the ZIP; 2 comparable units currently listed for rent nearby; 1,267 units permitted in Olmsted County in 2024 (915 in 5+ unit buildings).
Forward outlook
- Local home prices are declining (-3.0%/yr); year-one equity from $248 of loan paydown is wiped out by about $1k of value loss. Plan a longer hold.
- Olmsted County population projected at +16% by 2050 — long-run rental-demand tailwind backs the buy-and-hold thesis.
- At projected returns (-3.0% appreciation + 3.0% rent growth), your $10k cash investment doubles in ~1 year — after that, you're playing with house money.
Negotiation context
- It's been on market 178 days — a 12% lower offer ($32k) is reasonable based on typical stale-listing flexibility.
Questions for the listing agent
- It's been on market 178 days. Have you received any prior offers? Is the seller open to a 12% concession, seller financing, or rate buy-down credit?
- Why hasn't it sold? Are there any deal-killer items the seller is aware of (foundation, flood, title, zoning, code violations)?
- Is there a deadline driving the sale (1031 exchange, divorce, estate, relocation)? That informs how much negotiation room exists.
- Schools are A-rated — typically a magnet for longer-tenancy family renters. What's the average tenant stay here, and is there a school-zone premium baked into asking?
- The area grade is low — what's the realistic commute time and amenity access for the typical tenant pool here? Any planned neighborhood developments (good or bad) we should know about?
- What's the average days-on-market for RENTAL listings here right now (not sales)? A rising rental-DOM trend means longer vacancies and softer asking-rent achievability than the comps imply.
- What's the recent tenant-quality profile in this submarket — average credit score on applications, eviction rate, late-payment / NSF rate, and stable-employment percentage? A property-management company in the area should have these aggregated.
- How much new for-sale + rental construction is in the pipeline within 1–3 miles? Heavy new supply typically softens prices + rents 12–24 months out; constrained supply supports both.
Investment metrics
- 1% rule
- 4.17% ✓
- Cap rate
- 37.53%
- Cash-on-cash
- 111.57%
- DSCR
- 5.96
- GRM
- 2.0
CMA / ARV
No comps found within radius.
Projected returns pro-forma
-3.0% appreciation · 3.0% rent growth · sell at horizon
- IRR
- —
- Equity multiple
- 6.35×
- Total profit
- $53,730
- Equity at exit
- $5,353
- IRR
- —
- Equity multiple
- 13.29×
- Total profit
- $123,526
- Equity at exit
- $3,104
Cash invested: $10,052 (down + closing). Projections, not guarantees.
Landlord ↔ Tenant lean methodology
- Overall (STATE)
- 46 Balanced
- State Minnesota
- 46 Balanced · D+2
- County
- — inherits STATE
- City
- — inherits STATE
ZIP-level market 55976
- Home prices YoY
- -27.8%
- Active inventory
- 67
- Price-to-rent
- 2.0×
Monthly cashflow live
- Estimated rent
- $1,497 medium interval (Pro) →
- Mortgage (P&I)
- −$188
- Tax est. 1.5%
- −$45 /mo · $538/yr
- Insurance
- −$15
- HOA
- −$0
- Vacancy / Maint / Mgmt
- −$314
- Net cashflow
- $935
Break-even live
Sensitivity live
| Price | -10% $959 | -5% $947 | +0% $935 | +5% $922 | +10% $910 |
|---|---|---|---|---|---|
| Rent | -10% $816 | -5% $875 | +0% $935 | +5% $994 | +10% $1,053 |
| Rate | -1.0pp $953 | -0.5pp $944 | base $935 | +0.5pp $925 | +1.0pp $916 |
UW: 25.0% down · 7.5% · 30yr · 1.5% tax · 5.0% vac · 8.0% maint · 8.0% mgmt
Financing live
Cash to close
- Down payment
- $8,975
- Closing costs
- $1,077
- Reserves months
- —
- Total cash needed
- —
Loan-product check · same deal, 3 products live
Conventional
25% down · 7.5% · 30yr
- Down + closing
- —
- Monthly P&I
- —
- Monthly cashflow
- —
- DSCR
- —
- Eligible?
- —
Personal DTI + credit; lowest rate.
DSCR
20% down · 8.5% · 30yr
- Down + closing
- —
- Monthly P&I
- —
- Monthly cashflow
- —
- DSCR
- —
- Eligible?
- —
No personal income docs; deal must DSCR.
Hard money
10% down · 12.0% · 12mo
- Down + closing
- —
- Monthly P&I
- —
- Monthly cashflow
- —
- DSCR
- —
- Eligible?
- —
Short-term bridge; refi at stabilization.
Rent comps 2 comps
| Address | Beds | Baths | Sqft | Rent | $/sqft | DOM | Units | Dist |
|---|---|---|---|---|---|---|---|---|
| 2020 Lark Ln NW Unit 200 Stewartville, MN | 3.0 | 2.0 | 1056 | $1,449 | $1.37 | 22d | 1 | 0.34mi |
| 1821 Daniel Ln NE Stewartville, MN | 2.0 | 1.5 | 1080 | $1,550 | $1.44 | 44d | 1 | 0.36mi |
Listing history 2 events
-
2026-06-19days on market $35,900 Active 178 DOM
-
2026-06-18$35,900 Active 177 DOM
ⓘ Source: listings_history table (triggers on properties + properties_extension) + one-shot
backfill from property_details.listing_events for pre-trigger history.
Nearby sold comps map
Loading sold comps map…
Walkable amenities ~0.75 mi
Loading nearby amenities…
Taxation est. · year 1
- Rental income
- $17,965
- − Mortgage interest
- −$2,011
- − Property taxes
- −$538
- − Insurance
- −$180
- − Repairs & maintenance
- −$1,437
- − Management
- −$1,437
- − Depreciation
- −$1,044
- Taxable income
- $11,317
- Est. tax owed @ 24.0%
- −$2,716
- After-tax cash flow
- $8,499/yr
For passive investors: Depreciation is non-cash, so a rental often shows a tax loss while cash-flowing — sheltering income. Rental losses are passive: they offset passive income freely, and up to $25,000/yr can offset ordinary (W-2) income if you actively participate and your MAGI is under $100k (phasing out to $0 by $150k); unused losses carry forward. On sale, claimed depreciation is recaptured at up to 25%, and gains may owe capital-gains tax (a 1031 exchange can defer both). Figures are a year-1 estimate at your 24.0% rate — not tax advice; consult a CPA.
Schools (NCES district)
- District
- Stewartville Public School District
- NCES district ID
- 2738160
- Math proficiency
- 46% ▼ -14.00%
- Reading proficiency
- 52% ▼ -10.00%
- Median HH income
- $58,649
- Composite
- 42.76/100
- National rank
- #3156
- State rank
- #120 of 301 in MN
Livability — Stewartville
- Score
- 85/100
- State rank
- #18
- US rank
- #527
Category grades
Schools grade is shown separately in the Schools card above.
Census & demographics
- Census place
- Stewartville, MN
- City population
- 8,542
- Population (ZIP)
- 8,542
Population outlook (Olmsted County) Hauer SSP2
- Today (2025)
- 165,999 people
- By 2030
- 172,425 · +3.9%
- By 2040
- 183,785 · +10.7%
- By 2050
- 192,981 · +16.3%
- By 2075
- 215,284 · +29.7%
- By 2100
- 224,887 · +35.5%
Race, ethnicity, and origin ACS 2023
- Neighborhood character
- Predominantly White (92%)
- Race & ethnicity
- White 92% Two or more races 6% Hispanic / Latino 4%
- Common ancestry
- Portuguese 20% Iranian 3% Slovak 2%
- Foreign-born
- 1% · Canada
- Languages at home
- 96% English-only · Spanish 3%
Political lean MEDSL · Olmsted
- 2024 margin
- D (+10.7) · D 54.3% · R 43.6% · Other 2.1%
- 2008→2024 swing
- +7.4pp toward D · 2008: 3.3pp · 2024: 10.7pp
- All cycles
- 2024: D+10.7 2020: D+10.7 2016: D+0.8 2012: D+3.2 2008: D+3.3
Not yet ingested
- Civics
- —
Market trends
- HPI YoY
- ▼ -103.02%
- Current HPI
- 267.7547
- Rent YoY
- —
- Metro
- —
- State GDP YoY
- ▲ 2.41%
- F500 in state
- 34
Industry mix (Fortune 500 HQ in MN)
| Industry | F500 HQs | Revenue |
|---|---|---|
| Healthcare | 2 | $407B |
|
||
| Retail | 2 | $150B |
|
||
| Consumer Goods | 2 | $32B |
|
||
| Industrial Machinery | 2 | $6B |
|
||
| Agriculture | 1 | $40B |
|
||
| Healthcare / Medical Devices | 1 | $32B |
|
||
Cash-flow waterfall
monthlySold comps — $/sqft
last 12 mo · ≤1 miLoading sold comps…