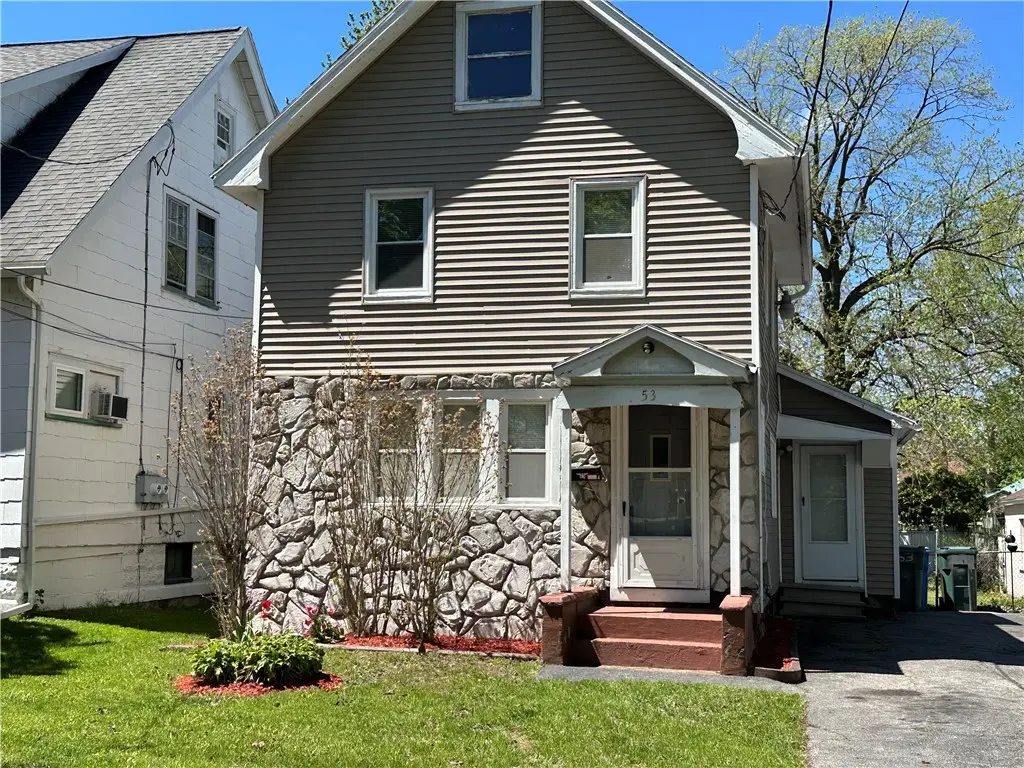
53 Roser St · Rochester, NY
Flood risk 1/10 · Minimal
- FEMA flood zone
- X (unshaded)
- Chance of flooding over 30 yrs
- 0.0%
- Est. flood insurance / yr
- $473 – $860
Fire risk 1/10 · Minimal
- Est. fire insurance / yr
- $691 – $1,283
Heat risk 2/10 · Minimal
- Hot days now (above 95°F)
- 7 days/yr
- Hot days in 30 yrs
- 15 days/yr
Wind risk 1/10 · Minimal
- Chance of severe wind over 30 yrs
- —
Air-quality risk 2/10 · Minimal
- Unhealthy air days now
- 1 days/yr
- Unhealthy air days in 30 yrs
- 2 days/yr
Risk factors via First Street. Map © Google.
Why this score? — see what drove the B+ grade
The composite is a weighted blend of 9 inputs, each scored 0–100. Each bar is that input's sub-score; the figure is the points it added to the 100-point composite (weight × sub-score).
- Cash flow +30.0/30.0
- ARV discount +15.0/15.0
- DSCR +10.0/10.0
- 1% rule +9.7/10.0
- Rent growth +4.7/5.0
- Livability +3.8/5.0
- Condition / age +2.5/5.0
- Schools +1.9/10.0
- Appreciation +0.0/10.0
$94,900
🖨 Deal sheet (PDF) 📄 Offer letter ✓ Due diligence
Listing remarks
You Must See This 3-bedroom, 2 full bath Cape/Colonial Home! Totally renovated with newer kitchen and baths. 1st floor bedroom with full bath and laundry. 2 Bedrooms up with flex space and full bath. Large living room, side & back enclosed porches led to private fenced yard. Plenty of storage space in full attic. Delayed Showings-Showings to start 5/12/26. Delayed Negotiations-No negotiations will take place until 5/18/26 @1pm.
Key facts
- Renovated baths
- Renovated kitchen
- Private fenced yard
Tags
Property features AI
Exterior
- Parking: No garage
- Utilities: Public water connected; Sewer connected; Cable available; Circuit breaker electric
- Home design: Two stories; Resale property
- Construction: Stone and vinyl siding exterior; Asphalt roof; Block foundation; Copper plumbing; Existing construction (year built details available)
- Exterior features: Blacktop driveway; Enclosed porch; Porch; Fully fenced yard; Private yard; See remarks
Interior
- Kitchen: Gas range; Gas oven; Refrigerator; Solid surface counters; Eat-in layout
- Bedrooms: One bedroom on the main level
- Flooring: Carpet; Laminate; Luxury vinyl; Varies
- Bathrooms: Two full bathrooms; One full bathroom on the main level
- Heating & cooling: Gas forced-air heating
- Interior features: Ceiling fans; Den; Eat-in kitchen; Separate/formal living room; Pull-down attic stairs; Solid surface counters; Thermal windows; Has full basement
- Laundry & utility: Washer; Dryer; Main-level laundry
Neighborhood map
What this means for you Summary
Snapshot
- This is a 2-bed/1.5-bath single-family listed at $95k.
Deal economics
- At list price, monthly cash flow is $473 ($6k/yr) — positive.
- The deal already cash-flows at list — no discount required.
- Meets the 1% rule at list price ($1k rent vs $95k).
- Cap rate 12.3% vs local median 9.3% in Rochester — top-decile yield for the area; either an underpriced asset or a hidden risk that comps aren't pricing in. Stress-test before assuming the spread holds.
Location & tenants
- Location reads 76/100 on livability (#222 in NY, #3,482 nationally) — a middle-class / working-renter tenant base. Strengths: commute A+, cost of living A+, housing A+; Watch: crime F, employment F.
- Rochester City School District (urban): math 21% / reading 26% proficiency, ranked #589 of 590 in NY (top 100%) — low school quality limits family demand, transient renter base, plan for 1-2y turnover; 82% free/reduced lunch — lower-income household profile, screen leases tightly.
- Zoned schools: School 50-Helen Barrett Montgomery (math 2% / reading 12%, grade F, #2,087 of 2,108 statewide, top 99%, 628 students, 90% FRL); East Lower School (math 2% / reading 22%, grade F, #715 of 729 statewide, top 98%, 304 students, 86% FRL); Edison Career And Technology High School (math 44% / reading 50%, grade D-, #1,007 of 1,100 statewide, top 93%, 1,233 students, 91% FRL).
- Market conditions: Rents rising fast (+8.9%/yr); 116 active listings in the ZIP; 19 comparable units currently listed for rent nearby; rentals at typical pace (median 21d on market — plan ~3-4 weeks tenant-placement turnaround); lower-income renter base — watch delinquency; 1,169 units permitted in Monroe County in 2024 (591 in 5+ unit buildings).
- At $1,392/mo this rent would consume 47% of the median local household income ($35k/yr) (locally 2756% of renters already pay >50% of income on rent) — very limited rent-growth headroom before tenants either downsize or default.
Forward outlook
- Local home prices are declining (-3.0%/yr); year-one equity from $656 of loan paydown is wiped out by about $3k of value loss. Plan a longer hold.
- Monroe County population projected to shrink 6% by 2050 — rents likely to lag national; underwrite the cash flow, not the appreciation.
- At projected returns (-3.0% appreciation + 8.0% rent growth), your $27k cash investment doubles in ~5 years — after that, you're playing with house money.
Negotiation context
- Only 8 days on market — expect competitive offers; lowballing is unlikely to land.
Risks & watch-outs
- Watch-outs: built in 1940 — expect roof / HVAC / electrical / plumbing capex.
Questions for the listing agent
- Built in 1940 — when were the roof, HVAC, electrical panel, plumbing, and water heater last replaced?
- Is there a deadline driving the sale (1031 exchange, divorce, estate, relocation)? That informs how much negotiation room exists.
- Schools are D-rated, which usually means shorter tenancies and higher turnover. Who's the typical renter profile here, and what's been the actual vacancy rate?
- Crime grade is F in this area — have there been break-ins, vandalism, or insurance claims at this property in the last 3 years? What carrier currently insures it and at what premium?
- What's the average days-on-market for RENTAL listings here right now (not sales)? A rising rental-DOM trend means longer vacancies and softer asking-rent achievability than the comps imply.
- What's the recent tenant-quality profile in this submarket — average credit score on applications, eviction rate, late-payment / NSF rate, and stable-employment percentage? A property-management company in the area should have these aggregated.
- How much new for-sale + rental construction is in the pipeline within 1–3 miles? Heavy new supply typically softens prices + rents 12–24 months out; constrained supply supports both.
Investment metrics
- 1% rule
- 1.47% ✓
- Cap rate
- 12.27%
- Cash-on-cash
- 21.36%
- DSCR
- 1.95
- GRM
- 5.7
CMA / ARV
- ARV (median comp)
- $164,336
- List price
- $94,900
- Delta
- -42.25%
- Verdict
- UNDERPRICED
- Comps
- 20 within 1.0 mi
Show comp detail 12 sales within ~0.75 mi
| Address | Dist | Beds/Ba | Sqft | Sold | Price | $/sf | Match |
|---|---|---|---|---|---|---|---|
| 34 Zygment St | 0.12mi | 3/1.0 (+1) | 1,137 (+3%) | 2mo | $182,000 | $160 | 81 |
| 51 Sayne St | 0.38mi | 2/1.0 | 1,100 (-0%) | 4mo | $165,000 | $150 | 76 |
| 65 Kosciusko St | 0.41mi | 3/1.0 (+1) | 1,097 (-1%) | 3mo | $55,000 | $50 | 70 |
| 57 Milan St | 0.42mi | 3/1.0 (+1) | 1,097 (-1%) | 3mo | $190,000 | $173 | 70 |
| 1475 North St | 0.37mi | 3/1.0 (+1) | 1,080 (-2%) | 3mo | $136,740 | $127 | 69 |
| 95 Cleon St | 0.55mi | 3/1.0 (+1) | 1,089 (-2%) | 1mo | $83,000 | $76 | 64 |
| 56 Northlane Dr | 0.34mi | 2/1.5 | 1,232 (+11%) | 2mo | $90,142 | $73 | 64 |
| 334 E Ridge Rd | 0.54mi | 3/1.0 (+1) | 1,176 (+6%) | 4mo | $194,900 | $166 | 54 |
| 235 Ernst St | 0.69mi | 3/1.5 (+1) | 1,164 (+5%) | 2mo | $170,000 | $146 | 52 |
| 263 Weyl St | 0.50mi | 3/1.0 (+1) | 1,202 (+9%) | 4mo | $85,000 | $71 | 52 |
| 74 Meyerhill Cir E | 0.49mi | 3/1.5 (+1) | 1,237 (+12%) | 4mo | $260,000 | $210 | 49 |
| 623 Avenue D | 0.73mi | 3/1.0 (+1) | 1,254 (+13%) | 2mo | $70,000 | $56 | 35 |
Match score weights: distance 35% · size 25% · config 20% · recency 20%. Top-matched comps best support the ARV.
Projected returns pro-forma
-3.0% appreciation · 8.0% rent growth · sell at horizon
- IRR
- 19.3%
- Equity multiple
- 1.83×
- Total profit
- $22,100
- Equity at exit
- $14,150
- IRR
- 30.8%
- Equity multiple
- 4.44×
- Total profit
- $91,517
- Equity at exit
- $8,205
Cash invested: $26,572 (down + closing). Projections, not guarantees.
Landlord ↔ Tenant lean methodology
- Overall (STATE)
- 15 Strongly Tenant-Friendly
- State New York
- 15 Strongly Tenant-Friendly · D+10
- County
- — inherits STATE
- City
- — inherits STATE
ZIP-level market 14621
- Home prices YoY
- -4.0%
- Rents YoY
- 8.9%
- Active inventory
- 116
- Price-to-rent
- 5.7×
Monthly cashflow live
- Estimated rent
- $1,392 high interval (Pro) →
- Mortgage (P&I)
- −$498
- Tax from tax record
- −$89 /mo · $1,073/yr
- Insurance
- −$40
- HOA
- −$0
- Vacancy / Maint / Mgmt
- −$292
- Net cashflow
- $473
Break-even live
Sensitivity live
| Price | -10% $527 | -5% $500 | +0% $473 | +5% $446 | +10% $419 |
|---|---|---|---|---|---|
| Rent | -10% $363 | -5% $418 | +0% $473 | +5% $528 | +10% $583 |
| Rate | -1.0pp $521 | -0.5pp $497 | base $473 | +0.5pp $448 | +1.0pp $423 |
UW: 25.0% down · 7.5% · 30yr · 1.5% tax · 5.0% vac · 8.0% maint · 8.0% mgmt
Financing live
Cash to close
- Down payment
- $23,725
- Closing costs
- $2,847
- Reserves months
- —
- Total cash needed
- —
Loan-product check · same deal, 3 products live
Conventional
25% down · 7.5% · 30yr
- Down + closing
- —
- Monthly P&I
- —
- Monthly cashflow
- —
- DSCR
- —
- Eligible?
- —
Personal DTI + credit; lowest rate.
DSCR
20% down · 8.5% · 30yr
- Down + closing
- —
- Monthly P&I
- —
- Monthly cashflow
- —
- DSCR
- —
- Eligible?
- —
No personal income docs; deal must DSCR.
Hard money
10% down · 12.0% · 12mo
- Down + closing
- —
- Monthly P&I
- —
- Monthly cashflow
- —
- DSCR
- —
- Eligible?
- —
Short-term bridge; refi at stabilization.
Rent comps 19 comps
| Address | Beds | Baths | Sqft | Rent | $/sqft | DOM | Units | Dist |
|---|---|---|---|---|---|---|---|---|
| 14-42 Seneca Manor Dr Rochester, NY | 1.0–2.0 | 1.0 | 800 | $1,120 | $1.40 | 45d | 1 | 0.40mi |
| 239 Weyl St Rochester, NY | 3.0 | 1.0 | 1208 | $1,600 | $1.32 | 20d | 1 | 0.48mi |
| 100 Fairbanks St Rochester, NY | 2.0 | 1.0 | 1456 | $1,100 | $0.76 | 46d | 1 | 0.53mi |
| 56 Brambury Dr Rochester, NY | 1.0–2.0 | 1.0 | 720 | $1,425 | $1.98 | 12d | 1 | 0.54mi |
| 1750 Hudson Ave Irondequoit, NY | 1.0–2.0 | 1.0 | 654 | $1,900 | $2.90 | 4d | 4 | 0.63mi |
| 176 Roycroft Dr Rochester, NY | 3.0 | 1.0 | 1169 | $950 | $0.81 | 12d | 1 | 0.67mi |
| 171 Mohawk St Rochester, NY | 3.0 | 2.0 | 1054 | $1,775 | $1.68 | 45d | 1 | 0.73mi |
| 493 Hollenbeck St Rochester, NY | 2.0 | 1.5 | 936 | $1,275 | $1.36 | 16d | 1 | 0.79mi |
| 83 Navarre Rd Rochester, NY | 3.0 | 2.0 | 1322 | $2,250 | $1.70 | 4d | 1 | 0.89mi |
| — Rochester, NY | 2.0 | 1.0 | 896 | $1,100 | $1.23 | 15d | 1 | 0.93mi |
| 21 Portland Ct Rochester, NY | 2.0 | 1.0 | 850 | $1,210 | $1.42 | 45d | 1 | 0.94mi |
| 127 Carter St #125 Rochester, NY | 2.0 | 1.0 | 1320 | $1,400 | $1.06 | 45d | 1 | 0.94mi |
| 1196 E Ridge Rd Rochester, NY | 1.0–2.0 | 1.0 | 800 | $1,265 | $1.58 | 25d | 1 | 0.96mi |
| 32 Portland Pkwy Rochester, NY | 2.0 | 1.0 | 652 | $1,485 | $2.28 | 4d | 8 | 0.97mi |
| 95 Onondaga Rd Rochester, NY | 1.0–2.0 | 1.0 | 825 | $1,630 | $1.98 | 4d | 1 | 0.98mi |
| 25 Trust St Rochester, NY | 3.0 | 1.5 | 1003 | $1,600 | $1.60 | 4d | 1 | 1.10mi |
| 11 Maria St Unit 1 DN Rochester, NY | 2.0 | 1.0 | 800 | $895 | $1.12 | 45d | 1 | 1.14mi |
| 76 Avenue A Unit Up Rochester, NY | 3.0 | 1.0 | 796 | $1,700 | $2.14 | 45d | 1 | 1.38mi |
| 28-30 Carthage Dr Unit 28 Rochester, NY | 3.0 | 1.0 | 1415 | $1,600 | $1.13 | 25d | 1 | 1.48mi |
Listing history 1 events
-
2026-05-11$94,900 Active 437-char remark
ⓘ Source: listings_history table (triggers on properties + properties_extension) + one-shot
backfill from property_details.listing_events for pre-trigger history.
Tax reassessment forecast NY · Partial reset (capped growth)
- Current annual tax
- $1,073 · $89/mo
- Projected year-2 tax
- $1,338 · $112/mo
- Expected delta
- +$265/yr (+$22/mo · 24.7%)
ⓘ Screening estimate from a state-policy table — verify with the county assessor before closing.
Climate risk First Street
- Flood 1/10 Low FEMA zone X (unshaded) · 0% chance over 30 yrs
- Wildfire 1/10 Low
- Heat 2/10 Low 7 d/yr ≥95°F today · 15 d/yr by 30 yrs out
- Wind 1/10 Low
- Air quality 2/10 Low 1 unhealthy d/yr today · 2 by 30 yrs out
Nearby sold comps map
Loading sold comps map…
Walkable amenities ~0.75 mi
Loading nearby amenities…
Taxation est. · year 1
- Rental income
- $16,701
- − Mortgage interest
- −$5,316
- − Property taxes
- −$1,073
- − Insurance
- −$474
- − Repairs & maintenance
- −$1,336
- − Management
- −$1,336
- − Depreciation
- −$2,761
- Taxable income
- $4,405
- Est. tax owed @ 24.0%
- −$1,057
- After-tax cash flow
- $4,618/yr
For passive investors: Depreciation is non-cash, so a rental often shows a tax loss while cash-flowing — sheltering income. Rental losses are passive: they offset passive income freely, and up to $25,000/yr can offset ordinary (W-2) income if you actively participate and your MAGI is under $100k (phasing out to $0 by $150k); unused losses carry forward. On sale, claimed depreciation is recaptured at up to 25%, and gains may owe capital-gains tax (a 1031 exchange can defer both). Figures are a year-1 estimate at your 24.0% rate — not tax advice; consult a CPA.
Schools (NCES district)
- District
- Rochester City School District
- NCES district ID
- 3624750
- Math proficiency
- 21% ▬ 0.00%
- Reading proficiency
- 26% ▲ 4.00%
- Median HH income
- $30,923
- Composite
- 18.98/100
- National rank
- #8850
- State rank
- #589 of 590 in NY
Livability — Rochester
- Score
- 76/100
- State rank
- #222
- US rank
- #3482
Category grades
Schools grade is shown separately in the Schools card above.
Census & demographics
- Census place
- Rochester, NY
- County
- Monroe County · 674,131 people
- City population
- 432,803
- Metro
- Rochester, NY
- Population (ZIP)
- 32,381
- Household income
- $35,383
- Rent vs Own
- Severe rent burden
- 2756.0
Population outlook (Monroe County) Hauer SSP2
- Today (2025)
- 759,460 people
- By 2030
- 757,154 · -0.3%
- By 2040
- 740,644 · -2.5%
- By 2050
- 714,443 · -5.9%
- By 2075
- 645,883 · -15.0%
- By 2100
- 547,084 · -28.0%
Race, ethnicity, and origin ACS 2023
- Neighborhood character
- Diverse neighborhood (Simpson 0.66)
- Race & ethnicity
- Hispanic / Latino 40% Black 40% White 14% Two or more races 12% Asian 1%
- Hispanic origin (detail)
- Mexican 1% Puerto Rican 32% Dominican 3%
- Common ancestry
- Romanian 1% Lithuanian 1% Serbian 1%
- Foreign-born
- 8% · Canada, Jamaica
- Languages at home
- 65% English-only · Spanish 30% Other Asian/Pacific 2% French/Haitian/Cajun 1%
Political lean MEDSL · Monroe
- 2024 margin
- D (+19.1) · D 59.5% · R 40.5%
- 2008→2024 swing
- +1.4pp toward D · 2008: 17.7pp · 2024: 19.1pp
- All cycles
- 2024: D+19.1 2020: D+21.0 2016: D+14.1 2012: D+17.4 2008: D+17.7
Not yet ingested
- Civics
- —
Market trends
- HPI YoY
- ▼ -10.66%
- Current HPI
- 254.1805
- Rent YoY
- ▲ 8.88%
- Metro
- Rochester, NY
- State GDP YoY
- ▲ 2.60%
- F500 in state
- 92
Industry mix (Fortune 500 HQ in NY)
| Industry | F500 HQs | Revenue |
|---|---|---|
| Financial Services | 10 | $950B |
|
||
| Consumer Goods | 9 | $162B |
|
||
| Insurance | 4 | $225B |
|
||
| Telecommunications | 2 | $144B |
|
||
| Pharmaceuticals | 2 | $112B |
|
||
| Media / Entertainment | 2 | $69B |
|
||
Price history
2 events — show timeline
- 2026-05-19 Pending — UNYREIS
- 2026-05-11 Listed $94,900 UNYREIS
Property tax history
+1.0%/yrLatest (2025): $1,073 · +11.5% YoY. Source: county tax records.
Cash-flow waterfall
monthlySold comps — $/sqft
last 12 mo · ≤1 miLoading sold comps…