 Multi-family
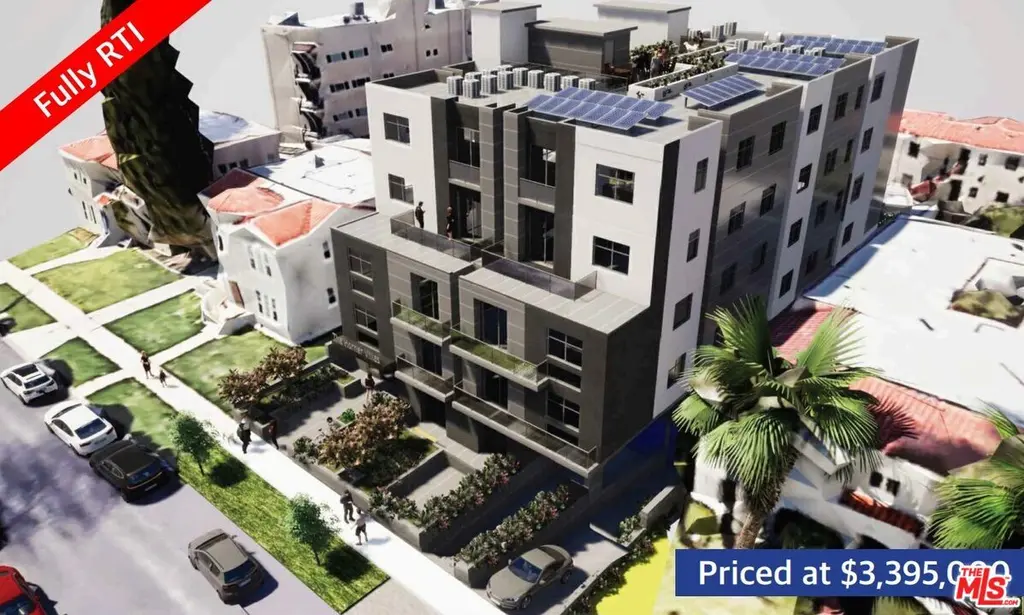
8521 Horner St · Los Angeles, CA
Flood risk 6/10 · Moderate
- FEMA flood zone
- X (shaded)
- Chance of flooding over 30 yrs
- 0.96%
- Est. flood insurance / yr
- $507 – $1,088
Fire risk 1/10 · Minimal
- Est. fire insurance / yr
- $659 – $1,223
Heat risk 6/10 · Moderate
- Hot days now (above 88°F)
- 7 days/yr
- Hot days in 30 yrs
- 21 days/yr
Wind risk 1/10 · Minimal
- Chance of severe wind over 30 yrs
- —
Air-quality risk 5/10 · Moderate
- Unhealthy air days now
- 7 days/yr
- Unhealthy air days in 30 yrs
- 7 days/yr
Risk factors via First Street. Map © Google.
Why this score? — see what drove the B- grade
The composite is a weighted blend of 9 inputs, each scored 0–100. Each bar is that input's sub-score; the figure is the points it added to the 100-point composite (weight × sub-score).
- Cash flow +30.0/30.0
- 1% rule +10.0/10.0
- DSCR +10.0/10.0
- Appreciation +6.4/10.0
- Schools +3.6/10.0
- Livability +3.4/5.0
- Condition / age +2.5/5.0
- Rent growth +2.1/5.0
- ARV discount +0.0/15.0
$3,395,000
🖨 Deal sheet (PDF) 📄 Offer letter ✓ Due diligence
Multi-family units
County records classify this as Multi-Family (5+ Unit). Listing-text estimate: 1 unit. estimate disagrees with records
5+ unit building — per-unit beds/baths from public records are typically unavailable; the breakdown below (if shown) is an estimate from the listing text.
Listing remarks
We are proud to offer an outstanding 35-Unit RTI Multifamily Development Opportunity located at 8521 Horner Street, Los Angeles, CA 90035, in the highly desirable Pico-Robertson area. The project is situated on an approximately 9,800 SF lot and is designed as a 5-story residential building with one level of subterranean parking. The approved plans currently include 29 base units, with additional storage areas that may be converted into ADU units. The ADU component can be designed as either 3 larger two-bedroom/two-bathroom ADUs of approximately 850 SF each, or as 6 studio ADUs of approximately 425 SF each, subject to final design and buyer verification. The planned project is currently pres
Key facts
- Subterranean parking
- Adu component
- 29 base units
Tags
Property features AI
Finance
- Other: No disclosures reported
- Financial info: Assessor parcel number 4303-032-022
Exterior
- Home design: Residential land
- Exterior features: Lot approximately 9,802 sq ft (0.225 acres); Has city and city lights views; Zoned [Q]R3-1-O
Interior
- Interior features: City and city lights views
Neighborhood map
What this means for you Summary
Snapshot
- This is a 8-bed/8.0-bath multifamily listed at $3.40M.
Deal economics
- At list price, monthly cash flow is $58k ($702k/yr) — positive.
- The deal already cash-flows at list — no discount required.
- Meets the 1% rule at list price ($102k rent vs $3.40M).
- Recommended offer: $3.34M (1.5% below list) — sets the bar for market timing.
- Cap rate 27.0% vs local median 2.1% in Los Angeles — top-decile yield for the area; either an underpriced asset or a hidden risk that comps aren't pricing in. Stress-test before assuming the spread holds.
Location & tenants
- Location reads 68/100 on livability (#273 in CA) — a middle-class / working-renter tenant base. Strengths: amenities A+, commute A+, employment B; Watch: health & safety C-, schools D+, crime F.
- Los Angeles Unified (urban): math 29% / reading 54% proficiency, ranked #223 of 517 in CA (top 43%) — families likely to look elsewhere, expect single-tenant / working-renter base with shorter leases; 67% free/reduced lunch — lower-income household profile, screen leases tightly.
- Market conditions: Rents soft (-1.6%/yr); 106 active listings in the ZIP; 1 comparable units currently listed for rent nearby; solid renter incomes; 19,697 units permitted in Los Angeles County in 2024 (9,426 in 5+ unit buildings).
Forward outlook
- In year one you build about $116k of equity ($23k loan paydown + $92k appreciation (2.7% local appreciation)).
- Los Angeles County population projected at +9% by 2050 — modest demand growth; plan on rents tracking national, not racing it.
- At projected returns (2.7% appreciation + 0.0% rent growth), your $951k cash investment doubles in ~2 years — after that, you're playing with house money.
- By year 3, paydown + projected appreciation supports a ~$289k cash-out refi (75% LTV) — recoverable capital for the next deal without selling this one.
Negotiation context
- It's been on market 17 days — a 2% lower offer ($3.34M) is reasonable based on typical stale-listing flexibility.
- 7 sale attempts since 9y ago with the ask held roughly flat each time — persistent listings suggest the price (not the market) is what's stuck; bring a comps-based counter.
- Current owner paid $2.40M; 41% above their basis — modest negotiation headroom, anchor on the comps not their cost.
Risks & watch-outs
- Watch-outs: built in 1931 — expect roof / HVAC / electrical / plumbing capex.
- Climate carrying-cost: major flood risk; extreme-heat days projected 7→21/yr by 2055 (HVAC capex compounding) — expect insurance premiums to compound above CPI over the hold.
Questions for the listing agent
- Built in 1931 — when were the roof, HVAC, electrical panel, plumbing, and water heater last replaced?
- Is there a deadline driving the sale (1031 exchange, divorce, estate, relocation)? That informs how much negotiation room exists.
- Schools are D-rated, which usually means shorter tenancies and higher turnover. Who's the typical renter profile here, and what's been the actual vacancy rate?
- Crime grade is F in this area — have there been break-ins, vandalism, or insurance claims at this property in the last 3 years? What carrier currently insures it and at what premium?
- What's the average days-on-market for RENTAL listings here right now (not sales)? A rising rental-DOM trend means longer vacancies and softer asking-rent achievability than the comps imply.
- What's the recent tenant-quality profile in this submarket — average credit score on applications, eviction rate, late-payment / NSF rate, and stable-employment percentage? A property-management company in the area should have these aggregated.
- How much new apartment / multifamily construction is in the pipeline within 1–3 miles? Heavy new supply (>2% of stock underway) typically softens rents 12–24 months out; light construction supports rent growth.
Investment metrics
- 1% rule
- 3.00% ✓
- Cap rate
- 26.96%
- Cash-on-cash
- 73.82%
- DSCR
- 4.28
- GRM
- 2.8
CMA / ARV
- ARV (on-the-fly)
- $2,378,249
- Comps found
- 4
Show comp detail 4 sales within ~0.75 mi
| Address | Dist | Beds/Ba | Sqft | Sold | Price | $/sf | Match |
|---|---|---|---|---|---|---|---|
| 8553 Alcott St | 0.19mi | 8/8.0 | 7,000 (-5%) | 4mo | $1,610,000 | $230 | 80 |
| 1243 S La Cienega Blvd | 0.29mi | 8/10.0 | 6,842 (-7%) | 13mo | $2,212,500 | $323 | 56 |
| 1239 S La Cienega Blvd | 0.30mi | 8/10.0 | 6,842 (-7%) | 13mo | $2,212,500 | $323 | 55 |
| 1947 S Shenandoah St | 0.69mi | 9/10.0 (+1) | 6,816 (-7%) | 17mo | $1,814,999 | $266 | 28 |
Match score weights: distance 35% · size 25% · config 20% · recency 20%. Top-matched comps best support the ARV.
Projected returns pro-forma
2.72% appreciation · 0.0% rent growth · sell at horizon
- IRR
- 75.2%
- Equity multiple
- 4.98×
- Total profit
- $3,784,922
- Equity at exit
- $1,472,767
- IRR
- 74.0%
- Equity multiple
- 9.38×
- Total profit
- $7,968,032
- Equity at exit
- $2,228,757
Cash invested: $950,600 (down + closing). Projections, not guarantees.
Landlord ↔ Tenant lean methodology
- Overall (CITY)
- 0 Strongly Tenant-Friendly
- State California
- 18 Strongly Tenant-Friendly · D+13
- County
- — inherits STATE
- City Los Angeles
- 0 Strongly Tenant-Friendly · D+22
ZIP-level market 90035
- Home prices YoY
- 0.7%
- Rents YoY
- -1.6%
- Active inventory
- 106
- Price-to-rent
- 97.1×
Monthly cashflow live
- Estimated rent
- $101,927 high interval (Pro) →
- Mortgage (P&I)
- −$17,804
- Tax from tax record
- −$2,825 /mo · $33,905/yr
- Insurance
- −$1,415
- HOA
- −$0
- Vacancy / Maint / Mgmt
- −$21,405
- Net cashflow
- $58,479
Break-even live
Sensitivity live
| Price | -10% $60,400 | -5% $59,440 | +0% $58,479 | +5% $57,518 | +10% $56,557 |
|---|---|---|---|---|---|
| Rent | -10% $50,426 | -5% $54,452 | +0% $58,479 | +5% $62,505 | +10% $66,531 |
| Rate | -1.0pp $60,188 | -0.5pp $59,342 | base $58,479 | +0.5pp $57,599 | +1.0pp $56,704 |
35-unit breakdown (identical units grouped — click to expand)
| Units | Beds | Baths | Est. rent |
|---|---|---|---|
| 35× units | 2 | 2 | $101,920 |
| #1 | 2 | 2 | $2,912 |
| #2 | 2 | 2 | $2,912 |
| #3 | 2 | 2 | $2,912 |
| #4 | 2 | 2 | $2,912 |
| #5 | 2 | 2 | $2,912 |
| #6 | 2 | 2 | $2,912 |
| #7 | 2 | 2 | $2,912 |
| #8 | 2 | 2 | $2,912 |
| #9 | 2 | 2 | $2,912 |
| #10 | 2 | 2 | $2,912 |
| #11 | 2 | 2 | $2,912 |
| #12 | 2 | 2 | $2,912 |
| #13 | 2 | 2 | $2,912 |
| #14 | 2 | 2 | $2,912 |
| #15 | 2 | 2 | $2,912 |
| #16 | 2 | 2 | $2,912 |
| #17 | 2 | 2 | $2,912 |
| #18 | 2 | 2 | $2,912 |
| #19 | 2 | 2 | $2,912 |
| #20 | 2 | 2 | $2,912 |
| #21 | 2 | 2 | $2,912 |
| #22 | 2 | 2 | $2,912 |
| #23 | 2 | 2 | $2,912 |
| #24 | 2 | 2 | $2,912 |
| #25 | 2 | 2 | $2,912 |
| #26 | 2 | 2 | $2,912 |
| #27 | 2 | 2 | $2,912 |
| #28 | 2 | 2 | $2,912 |
| #29 | 2 | 2 | $2,912 |
| #30 | 2 | 2 | $2,912 |
| #31 | 2 | 2 | $2,912 |
| #32 | 2 | 2 | $2,912 |
| #33 | 2 | 2 | $2,912 |
| #34 | 2 | 2 | $2,912 |
| #35 | 2 | 2 | $2,912 |
| Total (35 units) | $101,927 | ||
UW: 25.0% down · 7.5% · 30yr · 1.5% tax · 5.0% vac · 8.0% maint · 8.0% mgmt
Financing live
Cash to close
- Down payment
- $848,750
- Closing costs
- $101,850
- Reserves months
- —
- Total cash needed
- —
Loan-product check · same deal, 3 products live
Conventional
25% down · 7.5% · 30yr
- Down + closing
- —
- Monthly P&I
- —
- Monthly cashflow
- —
- DSCR
- —
- Eligible?
- —
Personal DTI + credit; lowest rate.
DSCR
20% down · 8.5% · 30yr
- Down + closing
- —
- Monthly P&I
- —
- Monthly cashflow
- —
- DSCR
- —
- Eligible?
- —
No personal income docs; deal must DSCR.
Hard money
10% down · 12.0% · 12mo
- Down + closing
- —
- Monthly P&I
- —
- Monthly cashflow
- —
- DSCR
- —
- Eligible?
- —
Short-term bridge; refi at stabilization.
Rent comps 1 comps
| Address | Beds | Baths | Sqft | Rent | $/sqft | DOM | Units | Dist |
|---|---|---|---|---|---|---|---|---|
| 9041 Cattaraugus Ave Los Angeles, CA | 8.0 | 8.0 | 5689 | $15,500 | $2.72 | 44d | 1 | 1.26mi |
Listing history 12 events
-
2026-06-18days on market $3,395,000 Active 17 DOM
-
2026-06-17days on market $3,395,000 Active 16 DOM
-
2026-06-16days on market $3,395,000 Active 15 DOM
-
2026-06-15days on market $3,395,000 Active 14 DOM
-
2026-06-13days on market $3,395,000 Active 12 DOM
-
2026-06-09days on market $3,395,000 Active 8 DOM
-
2026-06-08days on market $3,395,000 Active 7 DOM
-
2026-06-07days on market $3,395,000 Active 6 DOM
-
2026-06-04days on market $3,395,000 Active 3 DOM
-
2026-06-03days on market $3,395,000 Active 2 DOM
-
2026-06-02remarks 699-char remark
-
2026-06-02$3,395,000 Active 1 DOM
ⓘ Source: listings_history table (triggers on properties + properties_extension) + one-shot
backfill from property_details.listing_events for pre-trigger history.
Tax reassessment forecast CA · Resets to sale price
- Current annual tax
- $33,905 · $2,825/mo
- Projected year-2 tax
- $33,905 · $2,825/mo
- Expected delta
- $0/yr ($0/mo · 0.0%)
ⓘ Screening estimate from a state-policy table — verify with the county assessor before closing.
Climate risk First Street
- Flood 6/10 Major FEMA zone X (shaded) · 96% chance over 30 yrs
- Wildfire 1/10 Low
- Heat 6/10 Major 7 d/yr ≥88°F today · 21 d/yr by 30 yrs out
- Wind 1/10 Low
- Air quality 5/10 Major 7 unhealthy d/yr today · 7 by 30 yrs out
Nearby sold comps map
Loading sold comps map…
Walkable amenities ~0.75 mi
Loading nearby amenities…
Taxation est. · year 1
- Rental income
- $1,223,124
- − Mortgage interest
- −$190,173
- − Property taxes
- −$33,905
- − Insurance
- −$16,975
- − Repairs & maintenance
- −$97,850
- − Management
- −$97,850
- − Depreciation
- −$98,764
- Taxable income
- $687,608
- Est. tax owed @ 24.0%
- −$165,026
- After-tax cash flow
- $536,717/yr
For passive investors: Depreciation is non-cash, so a rental often shows a tax loss while cash-flowing — sheltering income. Rental losses are passive: they offset passive income freely, and up to $25,000/yr can offset ordinary (W-2) income if you actively participate and your MAGI is under $100k (phasing out to $0 by $150k); unused losses carry forward. On sale, claimed depreciation is recaptured at up to 25%, and gains may owe capital-gains tax (a 1031 exchange can defer both). Figures are a year-1 estimate at your 24.0% rate — not tax advice; consult a CPA.
Schools (NCES district)
- District
- Los Angeles Unified
- NCES district ID
- 0622710
- Math proficiency
- 29% ▼ -4.00%
- Reading proficiency
- 54% ▲ 10.00%
- Median HH income
- $50,403
- Composite
- 35.67/100
- National rank
- #4875
- State rank
- #223 of 517 in CA
Livability — Los Angeles
- Score
- 68/100
- State rank
- #273
- US rank
- #9237
Category grades
Schools grade is shown separately in the Schools card above.
Census & demographics
- Census place
- Los Angeles, CA
- County
- Los Angeles County · 9,444,647 people
- City population
- 3,838,149
- Metro
- Los Angeles-Long Beach-Anaheim, CA
- Population (ZIP)
- 29,000
- Household income
- $105,013
- Rent vs Own
- Severe rent burden
- 2317.0
Population outlook (Los Angeles County) Hauer SSP2
- Today (2025)
- 10,940,515 people
- By 2030
- 11,256,481 · +2.9%
- By 2040
- 11,729,929 · +7.2%
- By 2050
- 11,948,407 · +9.2%
- By 2075
- 11,818,114 · +8.0%
- By 2100
- 10,842,928 · -0.9%
Race, ethnicity, and origin ACS 2023
- Neighborhood character
- Diverse neighborhood (Simpson 0.57)
- Race & ethnicity
- White 64% Hispanic / Latino 14% Two or more races 11% Asian 7% Black 7%
- Hispanic origin (detail)
- Mexican 7% Cuban 1%
- Common ancestry
- Scotch-Irish 4% Italian 3% Romanian 3%
- Foreign-born
- 21% · Canada, China, South Korea
- Languages at home
- 72% English-only · Other Indo-European 8% Spanish 7% Russian/Polish/Slavic 1%
Political lean MEDSL · Los Angeles
- 2024 margin
- Solid D (+32.9) · D 64.8% · R 31.9% · Other 3.3%
- 2008→2024 swing
- -7.4pp toward R · 2008: 40.4pp · 2024: 32.9pp
- All cycles
- 2024: D+32.9 2020: D+44.2 2016: D+48.0 2012: D+40.0 2008: D+40.4
Not yet ingested
- Civics
- —
Market trends
- HPI YoY
- ▲ 2.72%
- Current HPI
- 394.903
- Rent YoY
- ▼ -1.60%
- Metro
- Los Angeles-Long Beach-Anaheim, CA
- State GDP YoY
- ▲ 3.21%
- F500 in state
- 116
Industry mix (Fortune 500 HQ in CA)
| Industry | F500 HQs | Revenue |
|---|---|---|
| Technology | 27 | $1,492B |
|
||
| Financial Services | 3 | $174B |
|
||
| Retail | 3 | $44B |
|
||
| Insurance | 3 | $26B |
|
||
| Media / Entertainment | 2 | $115B |
|
||
| Pharmaceuticals / Biotech | 2 | $62B |
|
||
Price history
+1606.0% since first listed16 events — show timeline
- 2026-06-01 Listed $3,395,000 TheMLS
- 2026-02-16 Relisted — TheMLS
- 2026-02-13 Price Changed — TheMLS
- 2025-10-20 Price Changed — TheMLS
- 2025-08-05 Listed — TheMLS
- 2018-09-09 Listing Removed — SDMLS
- 2018-09-09 Delisted — TheMLS
- 2018-08-15 Listed $2,699,000 SDMLS
- 2018-08-15 Listed — TheMLS
- 2018-03-01 Sold (Public Records) $5,825,000 Public Records
- 2018-03-01 Sold (MLS) $2,400,000 SDMLS
- 2018-03-01 Sold (MLS) $2,400,000 TheMLS
- 2017-12-21 Pending — TheMLS
- 2017-12-12 Listed $2,350,000 SDMLS
- 2017-12-12 Listed $2,350,000 TheMLS
- 1979-07-20 Sold (Public Records) $199,000 Public Records
Property tax history
+12.0%/yrLatest (2025): $33,905 · +1.1% YoY. Source: county tax records.
Cash-flow waterfall
monthlySold comps — $/sqft
last 12 mo · ≤1 miLoading sold comps…