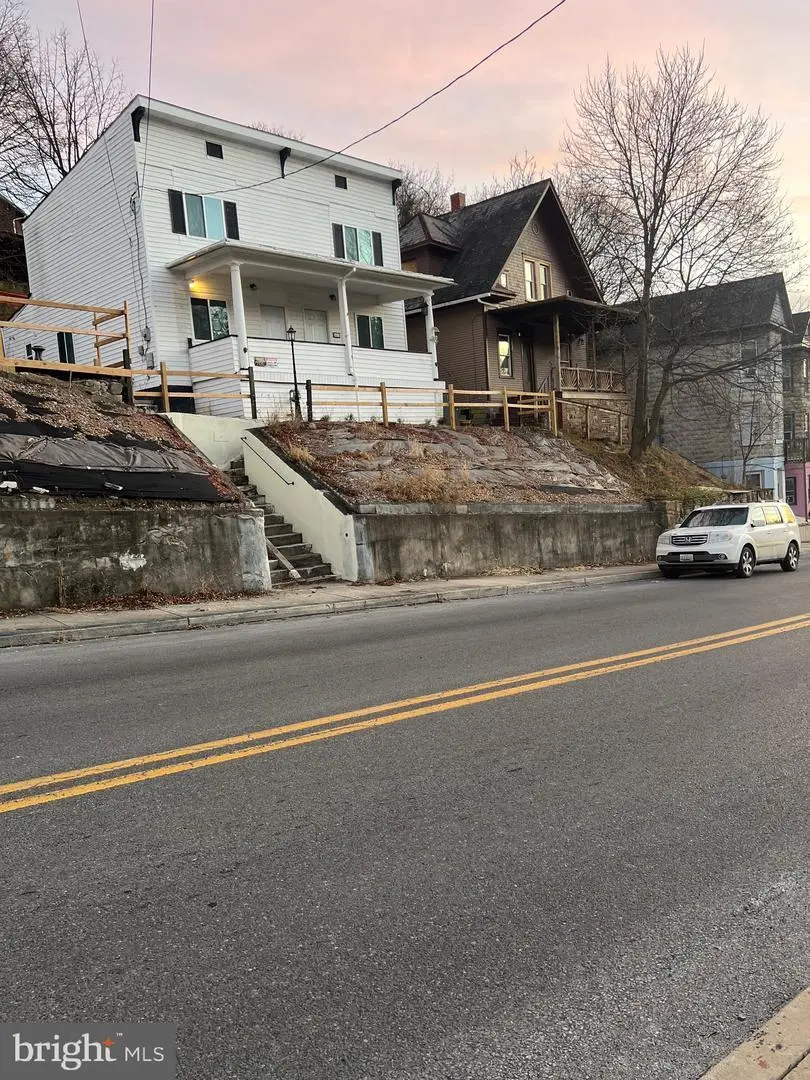
465 Baltimore Ave · Cumberland, MD
Flood risk 1/10 · Minimal
- FEMA flood zone
- X (unshaded)
- Chance of flooding over 30 yrs
- 0.0%
- Est. flood insurance / yr
- $473 – $860
Fire risk 3/10 · Minor
- Est. fire insurance / yr
- $755 – $1,403
Heat risk 5/10 · Moderate
- Hot days now (above 101°F)
- 7 days/yr
- Hot days in 30 yrs
- 18 days/yr
Wind risk 2/10 · Minimal
- Chance of severe wind over 30 yrs
- —
Air-quality risk 2/10 · Minimal
- Unhealthy air days now
- 0 days/yr
- Unhealthy air days in 30 yrs
- 1 days/yr
Risk factors via First Street. Map © Google.
Why this score? — see what drove the B+ grade
The composite is a weighted blend of 9 inputs, each scored 0–100. Each bar is that input's sub-score; the figure is the points it added to the 100-point composite (weight × sub-score).
- Cash flow +30.0/30.0
- ARV discount +15.0/15.0
- 1% rule +10.0/10.0
- DSCR +10.0/10.0
- Rent growth +5.0/5.0
- Livability +3.9/5.0
- Condition / age +2.5/5.0
- Schools +1.9/10.0
- Appreciation +0.0/10.0
$97,000
🖨 Deal sheet 📄 Offer letter ✓ Due diligence
Listing remarks
Investment property is here for you!! A duplex with 3 bedrooms and 1.5 baths and the 2nd side has 2 bedrooms and 1.5 baths! Garage and open second lot, plenty of open space! New Roof in 2023, new furnace and all new windows Close to Hospital / Downtown / Allegany College and Highway 68 This property is being sold "as is" as the second duplex needs finished!
Key facts
- Close to hospital
- New furnace
- Open second lot
Tags
Property features AI
Finance
- Other: Fee simple ownership; Approximately 750 sq ft below grade (unfinished); Approximately 1,770 sq ft finished above grade; Total below-grade area listed as 750 (source: assessor)
Exterior
- Parking: Alley access; Off-site parking available
- Utilities: Public water; Public sewer; Natural gas available; Electric available; Water available
- Home design: Detached property; Architectural shingle roof
- Construction: Brick and combination construction; Stone and brick/mortar foundation; Year built (source: assessor)
- Exterior features: Not in a federal flood zone; Above-grade and below-grade structures
Interior
- Kitchen: Stove; Refrigerator; Microwave; Freezer; Dishwasher
- Bedrooms: Five bedrooms on the upper level
- Flooring: Vinyl; Luxury vinyl plank
- Bathrooms: Two full bathrooms (upper levels); One half bathroom on the main level
- Heating & cooling: Central heating; Natural gas heat
- Interior features: Level entry to main floor; Basement with outside entrance and dirt floor
- Laundry & utility: Washer and dryer on the main floor; Electric hot water
Neighborhood map
What this means for you Summary
Snapshot
- This is a 5-bed/1.0-bath single-family listed at $97k.
Deal economics
- At list price, monthly cash flow is $676 ($8k/yr) — positive.
- The deal already cash-flows at list — no discount required.
- Meets the 1% rule at list price ($2k rent vs $97k).
- Recommended offer: $85k (12.0% below list) — sets the bar for market timing.
- Cap rate 14.7% vs local median 6.7% in Cumberland — top-decile yield for the area; either an underpriced asset or a hidden risk that comps aren't pricing in. Stress-test before assuming the spread holds.
Location & tenants
- Location reads 78/100 on livability (#64 in MD, #2,385 nationally) — a middle-class / working-renter tenant base. Strengths: amenities A+, commute A+, cost of living A+; Watch: schools D+, crime F, employment F.
- Allegany County Public Schools (other): math 15% / reading 30% proficiency, ranked #18 of 24 in MD (top 75%) — low school quality limits family demand, transient renter base, plan for 1-2y turnover.
- Market conditions: Rents rising fast (+10.9%/yr); 235 active listings in the ZIP; 1 comparable units currently listed for rent nearby; 24 units permitted in Allegany County in 2024 (0 in 5+ unit buildings).
- This rent runs 31% of the median local income ($61k/yr) — at the standard rent-burdened threshold; future hikes will face affordability resistance.
Forward outlook
- Local home prices are declining (-3.0%/yr); year-one equity from $671 of loan paydown is wiped out by about $3k of value loss. Plan a longer hold.
- Allegany County population projected at -14% by 2050 — secular population decline; favor cash flow + early exit over multi-decade hold.
- At projected returns (-3.0% appreciation + 8.0% rent growth), your $27k cash investment doubles in ~4 years — after that, you're playing with house money.
Negotiation context
- It's been on market 152 days — a 12% lower offer ($85k) is reasonable based on typical stale-listing flexibility.
- 4 sale attempts since 2y ago; this cycle's ask has dropped $33k (25%) from the opening price — seller is motivated, your offer sets the floor, not the list.
Risks & watch-outs
- Watch-outs: built in 1910 — expect roof / HVAC / electrical / plumbing capex.
- Climate carrying-cost: extreme-heat days projected 7→18/yr by 2055 (HVAC capex compounding) — expect insurance premiums to compound above CPI over the hold.
Questions for the listing agent
- It's been on market 152 days. Have you received any prior offers? Is the seller open to a 12% concession, seller financing, or rate buy-down credit?
- Built in 1910 — when were the roof, HVAC, electrical panel, plumbing, and water heater last replaced?
- Why hasn't it sold? Are there any deal-killer items the seller is aware of (foundation, flood, title, zoning, code violations)?
- Is there a deadline driving the sale (1031 exchange, divorce, estate, relocation)? That informs how much negotiation room exists.
- Schools are D-rated, which usually means shorter tenancies and higher turnover. Who's the typical renter profile here, and what's been the actual vacancy rate?
- Crime grade is F in this area — have there been break-ins, vandalism, or insurance claims at this property in the last 3 years? What carrier currently insures it and at what premium?
- What's the average days-on-market for RENTAL listings here right now (not sales)? A rising rental-DOM trend means longer vacancies and softer asking-rent achievability than the comps imply.
- What's the recent tenant-quality profile in this submarket — average credit score on applications, eviction rate, late-payment / NSF rate, and stable-employment percentage? A property-management company in the area should have these aggregated.
- How much new for-sale + rental construction is in the pipeline within 1–3 miles? Heavy new supply typically softens prices + rents 12–24 months out; constrained supply supports both.
Investment metrics
- 1% rule
- 1.63% ✓
- Cap rate
- 14.66%
- Cash-on-cash
- 29.88%
- DSCR
- 2.33
- GRM
- 5.1
CMA / ARV
- ARV (on-the-fly)
- $123,900
- Comps found
- 8
Show comp detail 8 sales within ~0.75 mi
| Address | Dist | Beds/Ba | Sqft | Sold | Price | $/sf | Match |
|---|---|---|---|---|---|---|---|
| 340 Davidson St | 0.29mi | 4/2.0 (-1) | 1,728 (-2%) | 4mo | $169,900 | $98 | 70 |
| 304 Park St | 0.52mi | 4/2.0 (-1) | 1,764 (-0%) | 9mo | $46,000 | $26 | 59 |
| 307 Helen St | 0.28mi | 4/1.0 (-1) | 1,966 (+11%) | 13mo | $55,000 | $28 | 53 |
| 603 Lincoln St | 0.33mi | 5/2.0 | 2,032 (+15%) | 7mo | $179,900 | $89 | 50 |
| 310 Williams St | 0.66mi | 5/2.0 | 1,880 (+6%) | 11mo | $47,000 | $25 | 46 |
| 147 Polk St | 0.51mi | 4/2.0 (-1) | 2,024 (+14%) | 2mo | $55,000 | $27 | 42 |
| 320 Columbia St | 0.68mi | 4/2.0 (-1) | 1,962 (+11%) | 11mo | $138,000 | $70 | 32 |
| 10007 Carrington Ct | 0.70mi | 4/2.5 (-1) | 1,916 (+8%) | 17mo | $440,179 | $230 | 28 |
Match score weights: distance 35% · size 25% · config 20% · recency 20%. Top-matched comps best support the ARV.
Projected returns pro-forma
-3.0% appreciation · 8.0% rent growth · sell at horizon
- IRR
- 29.6%
- Equity multiple
- 2.31×
- Total profit
- $35,689
- Equity at exit
- $14,463
- IRR
- 39.5%
- Equity multiple
- 5.58×
- Total profit
- $124,466
- Equity at exit
- $8,387
Cash invested: $27,160 (down + closing). Projections, not guarantees.
Landlord ↔ Tenant lean methodology
- Overall (STATE)
- 27 Tenant-Leaning
- State Maryland
- 27 Tenant-Leaning · D+14
- County
- — inherits STATE
- City
- — inherits STATE
ZIP-level market 21502
- Home prices YoY
- -17.4%
- Rents YoY
- 10.9%
- Active inventory
- 235
- Price-to-rent
- 5.1×
Monthly cashflow live
- Estimated rent
- $1,582 medium interval (Pro) →
- Mortgage (P&I)
- −$509
- Tax from tax record
- −$25 /mo · $295/yr
- Insurance
- −$40
- HOA
- −$0
- Vacancy / Maint / Mgmt
- −$332
- Net cashflow
- $676
Break-even live
UW: 25.0% down · 7.5% · 30yr · 1.5% tax · 5.0% vac · 8.0% maint · 8.0% mgmt
Financing live
Cash to close
- Down payment
- $24,250
- Closing costs
- $2,910
- Reserves months
- —
- Total cash needed
- —
Loan-product check · same deal, 3 products live
Conventional
25% down · 7.5% · 30yr
- Down + closing
- —
- Monthly P&I
- —
- Monthly cashflow
- —
- DSCR
- —
- Eligible?
- —
Personal DTI + credit; lowest rate.
DSCR
20% down · 8.5% · 30yr
- Down + closing
- —
- Monthly P&I
- —
- Monthly cashflow
- —
- DSCR
- —
- Eligible?
- —
No personal income docs; deal must DSCR.
Hard money
10% down · 12.0% · 12mo
- Down + closing
- —
- Monthly P&I
- —
- Monthly cashflow
- —
- DSCR
- —
- Eligible?
- —
Short-term bridge; refi at stabilization.
Rent comps 1 comps
| Address | Beds | Baths | Sqft | Rent | $/sqft | DOM | Units | Dist |
|---|---|---|---|---|---|---|---|---|
| 630 Hill Top Dr Cumberland, MD | 5.0 | 1.5 | 2300 | $1,495 | $0.65 | 43d | 1 | 0.99mi |
Listing history 28 events
-
2026-06-19days on market $97,000 Active 152 DOM
-
2026-06-18days on market $97,000 Active 151 DOM
-
2026-06-17days on market $97,000 Active 150 DOM
-
2026-06-16days on market $97,000 Active 149 DOM
-
2026-06-15days on market $97,000 Active 148 DOM
-
2026-06-14days on market $97,000 Active 146 DOM
-
2026-06-12days on market $97,000 Active 145 DOM
-
2026-06-09days on market $97,000 Active 142 DOM
-
2026-06-08days on market $97,000 Active 141 DOM
-
2026-06-07days on market $97,000 Active 140 DOM
-
2026-06-02days on market $97,000 Active 135 DOM
-
2026-06-01days on market $97,000 Active 134 DOM
-
2026-05-31days on market $97,000 Active 133 DOM
-
2026-05-30pricedays on market $97,000 Active 132 DOM
-
2026-05-25status Active
-
2026-05-20status Active
-
2026-05-20historical
-
2026-04-25historical Active Under Contract
-
2026-03-28price $99,900
-
2026-03-05price $110,000
-
2026-01-13price $119,900
-
2025-12-20$129,900 Active
-
2025-06-19historical
-
2025-04-09price $135,000
-
2025-04-02price $145,000
-
2025-02-06price $150,000
-
2024-12-13price $157,000
-
2024-11-11$160,000 Active
ⓘ Source: listings_history table (triggers on properties + properties_extension) + one-shot
backfill from property_details.listing_events for pre-trigger history.
Tax reassessment forecast MD · Partial reset (capped growth)
- Current annual tax
- $295 · $25/mo
- Projected year-2 tax
- $676 · $56/mo
- Expected delta
- +$381/yr (+$32/mo · 129.3%)
ⓘ Screening estimate from a state-policy table — verify with the county assessor before closing.
Climate risk First Street
- Flood 1/10 Low FEMA zone X (unshaded) · 0% chance over 30 yrs
- Wildfire 3/10 Moderate
- Heat 5/10 Major 7 d/yr ≥101°F today · 18 d/yr by 30 yrs out
- Wind 2/10 Low
- Air quality 2/10 Low 0 unhealthy d/yr today · 1 by 30 yrs out
Nearby sold comps map
Loading sold comps map…
Walkable amenities ~0.75 mi
Loading nearby amenities…
Taxation est. · year 1
- Rental income
- $18,988
- − Mortgage interest
- −$5,434
- − Property taxes
- −$295
- − Insurance
- −$485
- − Repairs & maintenance
- −$1,519
- − Management
- −$1,519
- − Depreciation
- −$2,822
- Taxable income
- $6,915
- Est. tax owed @ 24.0%
- −$1,660
- After-tax cash flow
- $6,457/yr
For passive investors: Depreciation is non-cash, so a rental often shows a tax loss while cash-flowing — sheltering income. Rental losses are passive: they offset passive income freely, and up to $25,000/yr can offset ordinary (W-2) income if you actively participate and your MAGI is under $100k (phasing out to $0 by $150k); unused losses carry forward. On sale, claimed depreciation is recaptured at up to 25%, and gains may owe capital-gains tax (a 1031 exchange can defer both). Figures are a year-1 estimate at your 24.0% rate — not tax advice; consult a CPA.
Schools (NCES district)
- District
- Allegany County Public Schools
- NCES district ID
- 2400030
- Math proficiency
- 15% ▼ -26.00%
- Reading proficiency
- 30% ▼ -20.00%
- Median HH income
- $39,760
- Composite
- 18.95/100
- National rank
- #8854
- State rank
- #18 of 24 in MD
Livability — Cumberland
- Score
- 78/100
- State rank
- #64
- US rank
- #2385
Category grades
Schools grade is shown separately in the Schools card above.
Census & demographics
- Census place
- Cumberland, MD
- County
- Allegany County · 41,015 people
- City population
- 41,015
- Metro
- Cumberland, MD-WV
- Population (ZIP)
- 41,015
- Household income
- $60,725
- Rent vs Own
- Severe rent burden
- 824.0
Population outlook (Allegany County) Hauer SSP2
- Today (2025)
- 68,778 people
- By 2030
- 66,766 · -2.9%
- By 2040
- 62,784 · -8.7%
- By 2050
- 59,179 · -14.0%
- By 2075
- 50,732 · -26.2%
- By 2100
- 40,837 · -40.6%
Race, ethnicity, and origin ACS 2023
- Neighborhood character
- Predominantly White (83%)
- Race & ethnicity
- White 83% Black 9% Two or more races 5% Hispanic / Latino 2%
- Common ancestry
- Slovak 3% Romanian 2% Italian 1%
- Foreign-born
- 2% · Canada
- Languages at home
- 96% English-only · Spanish 2%
Political lean MEDSL · Allegany
- 2024 margin
- Solid R (+40.3) · D 28.9% · R 69.2% · Other 2.0%
- 2008→2024 swing
- -14.4pp toward R · 2008: -25.9pp · 2024: -40.3pp
- All cycles
- 2024: R+40.3 2020: R+38.3 2016: R+48.0 2012: R+32.9 2008: R+25.9
Not yet ingested
- Civics
- —
Market trends
- HPI YoY
- ▼ -54.33%
- Current HPI
- 258.6676
- Rent YoY
- ▲ 10.88%
- Metro
- Cumberland, MD-WV
- State GDP YoY
- ▲ 2.97%
- F500 in state
- 12
Industry mix (Fortune 500 HQ in MD)
| Industry | F500 HQs | Revenue |
|---|---|---|
| Aerospace / Defense | 1 | $71B |
|
||
| Utilities | 1 | $25B |
|
||
| Hotels | 1 | $24B |
|
||
| Consumer Goods | 1 | $7B |
|
||
| Real Estate | 1 | $6B |
|
||
| Chemicals | 1 | $2B |
|
||
Price history
-37.6% since first listed14 events — show timeline
- 2026-05-25 Relisted — BRIGHT MLS
- 2026-05-20 Relisted — BRIGHT MLS
- 2026-05-20 Listing Removed — BRIGHT MLS
- 2026-04-25 Contingent — BRIGHT MLS
- 2026-03-28 Price Changed $99,900 BRIGHT MLS
- 2026-03-05 Price Changed $110,000 BRIGHT MLS
- 2026-01-13 Price Changed $119,900 BRIGHT MLS
- 2025-12-20 Listed $129,900 BRIGHT MLS
- 2025-06-19 Listing Removed — BRIGHT MLS
- 2025-04-09 Price Changed $135,000 BRIGHT MLS
- 2025-04-02 Price Changed $145,000 BRIGHT MLS
- 2025-02-06 Price Changed $150,000 BRIGHT MLS
- 2024-12-13 Price Changed $157,000 BRIGHT MLS
- 2024-11-11 Listed $160,000 BRIGHT MLS
Property tax history
+4.5%/yrLatest (2025): $295 · +4.8% YoY. Source: county tax records.
Cash-flow waterfall
monthlySold comps — $/sqft
last 12 mo · ≤1 miLoading sold comps…