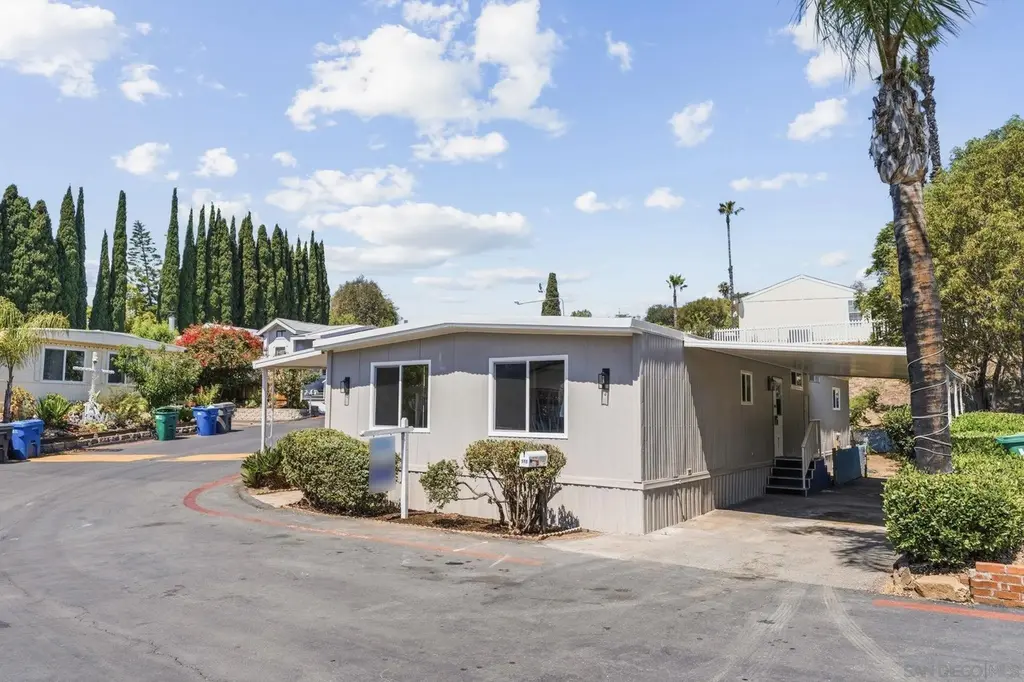
12970 Hwy 8 Business Spc 111 · Winter Gardens, CA
Flood risk 1/10 · Minimal
- FEMA flood zone
- X (unshaded)
- Chance of flooding over 30 yrs
- 0.0%
- Est. flood insurance / yr
- $507 – $1,088
Fire risk 6/10 · Moderate
- Est. fire insurance / yr
- $659 – $1,223
Heat risk 5/10 · Moderate
- Hot days now (above 98°F)
- 5 days/yr
- Hot days in 30 yrs
- 13 days/yr
Wind risk 1/10 · Minimal
- Chance of severe wind over 30 yrs
- —
Air-quality risk 4/10 · Minor
- Unhealthy air days now
- 6 days/yr
- Unhealthy air days in 30 yrs
- 7 days/yr
Risk factors via First Street. Map © Google.
Why this score? — see what drove the B- grade
The composite is a weighted blend of 9 inputs, each scored 0–100. Each bar is that input's sub-score; the figure is the points it added to the 100-point composite (weight × sub-score).
- Cash flow +30.0/30.0
- 1% rule +10.0/10.0
- DSCR +10.0/10.0
- ARV discount +7.5/15.0
- Schools +4.0/10.0
- Livability +3.1/5.0
- Condition / age +2.5/5.0
- Rent growth +2.3/5.0
- Appreciation +0.0/10.0
$219,000
🖨 Deal sheet (PDF) 📄 Offer letter ✓ Due diligence
Listing remarks
Beautifully remodeled 4-bedroom, 2-bath manufactured home located in a desirable all-ages community! This move-in ready home has been completely updated from top to bottom with modern finishes throughout. Enjoy a brand-new kitchen featuring updated cabinetry, countertops, and stainless steel appliances. The spacious layout offers comfortable living with plenty of room for family, guests, or a home office. Situated on a prime corner lot, the property features a fenced yard perfect for kids or pets. A rare opportunity to own a turnkey home in a great park with convenient access to nearby shopping, dining, and amenities!
Key facts
- Turnkey home
- Fenced yard
- Brand-new kitchen
Tags
Property features AI
Finance
- Other: Located in the Rancho Valley community (El Cajon)
- HOA & community: Community pool and clubhouse
Exterior
- Parking: Tandem parking for 2 vehicles
- Utilities: Sewer connected
- Home design: Manufactured home; Single-story
- Construction: Metal roof
- Exterior features: Full fencing; Community pool; Community clubhouse; Community spa/hot tub
Interior
- Kitchen: Gas cooktop; Gas oven; Gas range; Dishwasher
- Bedrooms: Up to 4 bedrooms possible
- Bathrooms: 2 full bathrooms
- Interior features: Dishwasher; Gas oven; Gas range; Gas cooktop; Central air conditioning; Forced air heating (natural gas)
Neighborhood map
What this means for you Summary
Snapshot
- This is a 4-bed/2.0-bath land listed at $219k.
Deal economics
- At list price, monthly cash flow is $1k ($14k/yr) — positive.
- The deal already cash-flows at list — no discount required.
- Meets the 1% rule at list price ($3k rent vs $219k).
- Recommended offer: $212k (3.0% below list) — sets the bar for market timing.
- Cap rate 12.9% vs local median 2.6% in Winter Gardens — top-decile yield for the area; either an underpriced asset or a hidden risk that comps aren't pricing in. Stress-test before assuming the spread holds.
Location & tenants
- Location reads 61/100 on livability (#515 in CA) — a middle-class / working-renter tenant base. Strengths: commute A+, employment A-, housing A-; Watch: crime D-, amenities F, cost of living F.
- Grossmont Union High (suburban): math 31% / reading 60% proficiency, ranked #173 of 517 in CA (top 34%) — families likely to look elsewhere, expect single-tenant / working-renter base with shorter leases; only 17% free/reduced lunch — higher-income household profile.
- Zoned schools: W. D. Hall Elementary (540 students, 81% FRL); Greenfield Middle (663 students, 84% FRL); El Capitan High (math 20% / reading 54%, grade F, #578 of 1,170 statewide, top 51%, 1,825 students, 52% FRL) — zoned schools average 72% FRL vs 17% district-wide (56 pts higher); higher-poverty schools than district average — tighter screening recommended.
- Market conditions: Rents soft (-0.8%/yr); 244 active listings in the ZIP; 7 comparable units currently listed for rent nearby; rentals leasing fast (median 0d on market — plan ~1-2 weeks tenant-placement turnaround); 11,759 units permitted in San Diego County in 2024 (7,244 in 5+ unit buildings).
- At $3,440/mo this rent would consume 56% of the median local household income ($74k/yr) (locally 4178% of renters already pay >50% of income on rent) — very limited rent-growth headroom before tenants either downsize or default.
Forward outlook
- Local home prices are declining (-3.0%/yr); year-one equity from $2k of loan paydown is wiped out by about $7k of value loss. Plan a longer hold.
- San Diego County population projected at +20% by 2050 — long-run rental-demand tailwind backs the buy-and-hold thesis.
- At projected returns (-3.0% appreciation + 0.0% rent growth), your $61k cash investment doubles in ~7 years — after that, you're playing with house money.
Negotiation context
- It's been on market 31 days — a 3% lower offer ($212k) is reasonable based on typical stale-listing flexibility.
- 39 sale attempts since 24y ago; this cycle's ask is 33% above the opening price — seller raised mid-cycle; expect resistance to lowballs.
- Current owner paid $135k; list at $219k implies a 62% gain — meaningful room to come down on a strong offer.
Risks & watch-outs
- Climate carrying-cost: major wildfire risk; extreme-heat days projected 5→13/yr by 2055 (HVAC capex compounding) — expect insurance premiums to compound above CPI over the hold.
Questions for the listing agent
- It's been on market 31 days. Have you received any prior offers? Is the seller open to a 3% concession, seller financing, or rate buy-down credit?
- Built in 1972 — when were the roof, HVAC, electrical panel, plumbing, and water heater last replaced?
- Is there a deadline driving the sale (1031 exchange, divorce, estate, relocation)? That informs how much negotiation room exists.
- Crime grade is D in this area — have there been break-ins, vandalism, or insurance claims at this property in the last 3 years? What carrier currently insures it and at what premium?
- What's the average days-on-market for RENTAL listings here right now (not sales)? A rising rental-DOM trend means longer vacancies and softer asking-rent achievability than the comps imply.
- What's the recent tenant-quality profile in this submarket — average credit score on applications, eviction rate, late-payment / NSF rate, and stable-employment percentage? A property-management company in the area should have these aggregated.
- How much new for-sale + rental construction is in the pipeline within 1–3 miles? Heavy new supply typically softens prices + rents 12–24 months out; constrained supply supports both.
Investment metrics
- 1% rule
- 1.57% ✓
- Cap rate
- 12.89%
- Cash-on-cash
- 23.57%
- DSCR
- 2.05
- GRM
- 5.3
CMA / ARV
No comps found within radius.
Projected returns pro-forma
-3.0% appreciation · 0.0% rent growth · sell at horizon
- IRR
- 13.2%
- Equity multiple
- 1.51×
- Total profit
- $31,193
- Equity at exit
- $32,654
- IRR
- 19.7%
- Equity multiple
- 2.42×
- Total profit
- $87,186
- Equity at exit
- $18,935
Cash invested: $61,320 (down + closing). Projections, not guarantees.
Landlord ↔ Tenant lean methodology
- Overall (STATE)
- 18 Strongly Tenant-Friendly
- State California
- 18 Strongly Tenant-Friendly · D+13
- County
- — inherits STATE
- City
- — inherits STATE
ZIP-level market 92021
- Rents YoY
- -0.8%
- Active inventory
- 244
- Price-to-rent
- 5.3×
Monthly cashflow live
- Estimated rent
- $3,440 high interval (Pro) →
- Mortgage (P&I)
- −$1,148
- Tax est. 1.5%
- −$274 /mo · $3,285/yr
- Insurance
- −$91
- HOA
- −$0
- Vacancy / Maint / Mgmt
- −$722
- Net cashflow
- $1,204
Break-even live
Sensitivity live
| Price | -10% $1,356 | -5% $1,280 | +0% $1,204 | +5% $1,129 | +10% $1,053 |
|---|---|---|---|---|---|
| Rent | -10% $933 | -5% $1,069 | +0% $1,204 | +5% $1,340 | +10% $1,476 |
| Rate | -1.0pp $1,315 | -0.5pp $1,260 | base $1,204 | +0.5pp $1,148 | +1.0pp $1,090 |
UW: 25.0% down · 7.5% · 30yr · 1.5% tax · 5.0% vac · 8.0% maint · 8.0% mgmt
Financing live
Cash to close
- Down payment
- $54,750
- Closing costs
- $6,570
- Reserves months
- —
- Total cash needed
- —
Loan-product check · same deal, 3 products live
Conventional
25% down · 7.5% · 30yr
- Down + closing
- —
- Monthly P&I
- —
- Monthly cashflow
- —
- DSCR
- —
- Eligible?
- —
Personal DTI + credit; lowest rate.
DSCR
20% down · 8.5% · 30yr
- Down + closing
- —
- Monthly P&I
- —
- Monthly cashflow
- —
- DSCR
- —
- Eligible?
- —
No personal income docs; deal must DSCR.
Hard money
10% down · 12.0% · 12mo
- Down + closing
- —
- Monthly P&I
- —
- Monthly cashflow
- —
- DSCR
- —
- Eligible?
- —
Short-term bridge; refi at stabilization.
Rent comps 7 comps
| Address | Beds | Baths | Sqft | Rent | $/sqft | DOM | Units | Dist |
|---|---|---|---|---|---|---|---|---|
| 2000 E Main St El Cajon, CA | 3.0 | 1.5–2.5 | 1165 | $3,300 | $2.83 | 0d | 1 | 0.11mi |
| 1704 Broadway El Cajon, CA | 4.0 | 2.0 | 1808 | $4,800 | $2.65 | 9d | 1 | 1.00mi |
| 8809 Los Coches Rd Lakeside, CA | 4.0 | 2.0 | 1350 | $3,800 | $2.81 | 0d | 1 | 1.01mi |
| 8031 Winter Gardens Blvd El Cajon, CA | 3.0 | 2.0 | 1124 | $2,995 | $2.66 | 0d | 1 | 1.04mi |
| 8424 Pueblo Rd Unit 8424 Lakeside, CA | 3.0 | 1.0 | 1000 | $2,750 | $2.75 | 0d | 1 | 1.05mi |
| 9092 Los Coches Rd Lakeside, CA | 3.0 | 2.5 | 1300 | $4,000 | $3.08 | 3d | 1 | 1.21mi |
| 9094 Los Coches Rd Lakeside, CA | 3.0 | 2.5 | 1200 | $4,000 | $3.33 | 0d | 1 | 1.21mi |
Listing history 50 events
-
2026-06-21days on market $219,000 Active 31 DOM
-
2026-06-18days on market $219,000 Active 28 DOM
-
2026-06-17days on market $219,000 Active 27 DOM
-
2026-06-16days on market $219,000 Active 26 DOM
-
2026-06-15days on market $219,000 Active 25 DOM
-
2026-06-13days on market $219,000 Active 23 DOM
-
2026-06-13days on market $219,000 Active 22 DOM
-
2026-06-09days on market $219,000 Active 19 DOM
-
2026-06-08days on market $219,000 Active 18 DOM
-
2026-06-07days on market $219,000 Active 17 DOM
-
2026-06-04days on market $219,000 Active 14 DOM
-
2026-06-03days on market $219,000 Active 13 DOM
-
2026-06-02days on market $219,000 Active 12 DOM
-
2026-06-01days on market $219,000 Active 11 DOM
-
2026-05-31days on market $219,000 Active 10 DOM
-
2012-09-25price $38,500
-
2012-09-25price $38,500
-
2012-09-25price $38,500
-
2007-07-27historical
-
2007-03-31historical
-
2007-03-31historical
-
2007-03-31historical
-
2007-03-31historical
-
2007-03-15soldstatus $135,000
-
2007-03-04historical
-
2007-03-04historical
-
2007-03-01$165,000
-
2007-02-28historical
-
2007-02-18historical
-
2007-02-18historical
-
2007-02-15$74,900
-
2007-02-15$74,900
-
2007-02-11$59,900
-
2007-02-11$59,900
-
2006-12-31historical
-
2006-12-31historical
-
2006-12-01historical
-
2006-12-01historical
-
2006-10-21historical
-
2006-10-19$139,900
-
2006-09-22$200,000
-
2006-09-04$180,000
-
2006-09-04$180,000
-
2006-08-25historical
-
2006-08-25historical
-
2006-08-10historical
-
2006-08-10historical
-
2006-07-17historical
-
2006-07-04$49,000
-
2006-06-25$52,000
ⓘ Source: listings_history table (triggers on properties + properties_extension) + one-shot
backfill from property_details.listing_events for pre-trigger history.
Climate risk First Street
- Flood 1/10 Low FEMA zone X (unshaded) · 0% chance over 30 yrs
- Wildfire 6/10 Major
- Heat 5/10 Major 5 d/yr ≥98°F today · 13 d/yr by 30 yrs out
- Wind 1/10 Low
- Air quality 4/10 Moderate 6 unhealthy d/yr today · 7 by 30 yrs out
Nearby sold comps map
Loading sold comps map…
Walkable amenities ~0.75 mi
Loading nearby amenities…
Taxation est. · year 1
- Rental income
- $41,284
- − Mortgage interest
- −$12,267
- − Property taxes
- −$3,285
- − Insurance
- −$1,095
- − Repairs & maintenance
- −$3,303
- − Management
- −$3,303
- − Depreciation
- −$6,371
- Taxable income
- $11,661
- Est. tax owed @ 24.0%
- −$2,799
- After-tax cash flow
- $11,655/yr
For passive investors: Depreciation is non-cash, so a rental often shows a tax loss while cash-flowing — sheltering income. Rental losses are passive: they offset passive income freely, and up to $25,000/yr can offset ordinary (W-2) income if you actively participate and your MAGI is under $100k (phasing out to $0 by $150k); unused losses carry forward. On sale, claimed depreciation is recaptured at up to 25%, and gains may owe capital-gains tax (a 1031 exchange can defer both). Figures are a year-1 estimate at your 24.0% rate — not tax advice; consult a CPA.
Schools (NCES district)
- District
- Grossmont Union High
- NCES district ID
- 0616230
- Math proficiency
- 31% ▼ -1.00%
- Reading proficiency
- 60% ▲ 5.00%
- Median HH income
- $61,801
- Composite
- 40.07/100
- National rank
- #3810
- State rank
- #173 of 517 in CA
Livability — Winter Gardens
- Score
- 61/100
- State rank
- #515
- US rank
- #17448
Category grades
Schools grade is shown separately in the Schools card above.
Census & demographics
- Census place
- Winter Gardens, CA
- County
- San Diego County · 3,178,799 people
- Metro
- San Diego-Chula Vista-Carlsbad, CA
- Population (ZIP)
- 70,501
- Household income
- $74,013
- Rent vs Own
- Severe rent burden
- 4178.0
Population outlook (San Diego County) Hauer SSP2
- Today (2025)
- 3,678,185 people
- By 2030
- 3,856,546 · +4.8%
- By 2040
- 4,171,407 · +13.4%
- By 2050
- 4,421,607 · +20.2%
- By 2075
- 4,831,599 · +31.4%
- By 2100
- 4,832,502 · +31.4%
Race, ethnicity, and origin ACS 2023
- Neighborhood character
- Diverse neighborhood (Simpson 0.62)
- Race & ethnicity
- White 54% Hispanic / Latino 28% Two or more races 14% Black 6% Asian 5% Native American 2%
- Hispanic origin (detail)
- Mexican 24%
- Common ancestry
- Arab 6% Italian 2% Lithuanian 2%
- Foreign-born
- 22% · Canada
- Languages at home
- 65% English-only · Spanish 18% Arabic 7% Other Indo-European 3%
Political lean MEDSL · San Diego
- 2024 margin
- D (+16.8) · D 56.9% · R 40.1% · Other 2.9%
- 2008→2024 swing
- +6.6pp toward D · 2008: 10.2pp · 2024: 16.8pp
- All cycles
- 2024: D+16.8 2020: D+22.8 2016: D+17.8 2012: D+5.1 2008: D+10.2
Not yet ingested
- Civics
- —
Market trends
- HPI YoY
- ▼ -654.88%
- Current HPI
- 335.0617
- Rent YoY
- ▼ -0.83%
- Metro
- San Diego-Chula Vista-Carlsbad, CA
- State GDP YoY
- ▲ 3.21%
- F500 in state
- 116
Industry mix (Fortune 500 HQ in CA)
| Industry | F500 HQs | Revenue |
|---|---|---|
| Technology | 27 | $1,492B |
|
||
| Financial Services | 3 | $174B |
|
||
| Retail | 3 | $44B |
|
||
| Insurance | 3 | $26B |
|
||
| Media / Entertainment | 2 | $115B |
|
||
| Pharmaceuticals / Biotech | 2 | $62B |
|
||
Price history
-94.6% since first listed86 events — show timeline
- 2012-09-25 Price Changed $38,500 CRMLS
- 2012-09-25 Price Changed $38,500 CRMLS
- 2012-09-25 Price Changed $38,500 CRMLS
- 2007-07-27 Listing Removed — SDMLS
- 2007-03-31 Listing Removed — CRMLS
- 2007-03-31 Listing Removed — CRMLS
- 2007-03-31 Listing Removed — SDMLS
- 2007-03-31 Listing Removed — SDMLS
- 2007-03-15 Sold (MLS) $135,000 CRMLS
- 2007-03-04 Listing Removed — CRMLS
- 2007-03-04 Listing Removed — SDMLS
- 2007-03-01 Listed $165,000 SDMLS
- 2007-02-28 Listing Removed — SDMLS
- 2007-02-18 Listing Removed — CRMLS
- 2007-02-18 Listing Removed — SDMLS
- 2007-02-15 Listed $74,900 CRMLS
- 2007-02-15 Listed $74,900 SDMLS
- 2007-02-11 Listed $59,900 CRMLS
- 2007-02-11 Listed $59,900 SDMLS
- 2006-12-31 Listing Removed — SDMLS
- 2006-12-31 Listing Removed — CRMLS
- 2006-12-01 Listing Removed — SDMLS
- 2006-12-01 Listing Removed — CRMLS
- 2006-10-21 Listing Removed — SDMLS
- 2006-10-19 Listed $139,900 CRMLS
- 2006-09-22 Listed $200,000 SDMLS
- 2006-09-04 Listed $180,000 CRMLS
- 2006-09-04 Listed $180,000 SDMLS
- 2006-08-25 Listing Removed — CRMLS
- 2006-08-25 Listing Removed — SDMLS
- 2006-08-10 Listing Removed — SDMLS
- 2006-08-10 Listing Removed — CRMLS
- 2006-07-17 Listing Removed — SDMLS
- 2006-07-04 Listed $49,000 SDMLS
- 2006-06-25 Listed $52,000 SDMLS
- 2006-06-25 Listed $52,000 CRMLS
- 2006-06-01 Listed $95,000 SDMLS
- 2006-06-01 Listed $95,000 CRMLS
- 2006-05-11 Listed $155,000 CRMLS
- 2006-05-11 Listed $155,000 SDMLS
- 2006-04-21 Listed $47,500 SDMLS
- 2006-02-25 Listed $199,500 CRMLS
- 2006-02-25 Listed $199,500 SDMLS
- 2006-02-10 Listed $124,900 SDMLS
- 2006-02-10 Listed $124,900 CRMLS
- 2006-01-12 Listing Removed — SDMLS
- 2005-08-27 Listing Removed — CRMLS
- 2005-08-27 Listing Removed — SDMLS
- 2005-07-12 Listed $45,000 SDMLS
- 2005-06-28 Listing Removed — CRMLS
- 2005-06-28 Listing Removed — SDMLS
- 2004-12-28 Listed $25,000 CRMLS
- 2004-12-28 Listed $25,000 SDMLS
- 2004-11-01 Listing Removed — CRMLS
- 2004-11-01 Listing Removed — SDMLS
- 2004-10-02 Listing Removed — CRMLS
- 2004-10-02 Listing Removed — SDMLS
- 2004-09-30 Listing Removed — CRMLS
- 2004-09-30 Listing Removed — SDMLS
- 2004-08-02 Listed $25,000 CRMLS
- 2004-08-02 Listed $25,000 SDMLS
- 2004-03-31 Listed $25,000 CRMLS
- 2004-03-31 Listed $25,000 SDMLS
- 2004-02-28 Listed $95,000 CRMLS
- 2004-02-28 Listed $95,000 SDMLS
- 2004-02-09 Listing Removed — SDMLS
- 2003-10-16 Listed $79,900 SDMLS
- 2003-08-10 Listing Removed — SDMLS
- 2003-06-22 Listing Removed — SDMLS
- 2003-05-30 Sold (MLS) $24,500 CRMLS
- 2003-04-21 Listed $99,950 CRMLS
- 2003-04-21 Listed $99,950 SDMLS
- 2003-04-09 Listed $24,900 CRMLS
- 2003-03-29 Listing Removed — CRMLS
- 2003-03-29 Listing Removed — SDMLS
- 2003-03-12 Listed $45,000 SDMLS
- 2003-03-03 Listed $45,000 CRMLS
- 2003-03-03 Listed $45,000 SDMLS
- 2003-02-20 Sold (MLS) $57,900 CRMLS
- 2003-02-10 Listed $70,000 SDMLS
- 2002-08-21 Listed $56,000 CRMLS
- 2001-12-04 Listing Removed — SDMLS
- 2001-12-04 Price Changed $719,000 CRMLS
- 2001-12-04 Price Changed $719,000 CRMLS
- 2001-11-26 Listing Removed — SDMLS
- 2001-11-26 Listing Removed — CRMLS
Property tax history
+38.5%/yrLatest (2025): $134,966 · +6.3% YoY. Source: county tax records.
Cash-flow waterfall
monthlySold comps — $/sqft
last 12 mo · ≤1 miLoading sold comps…