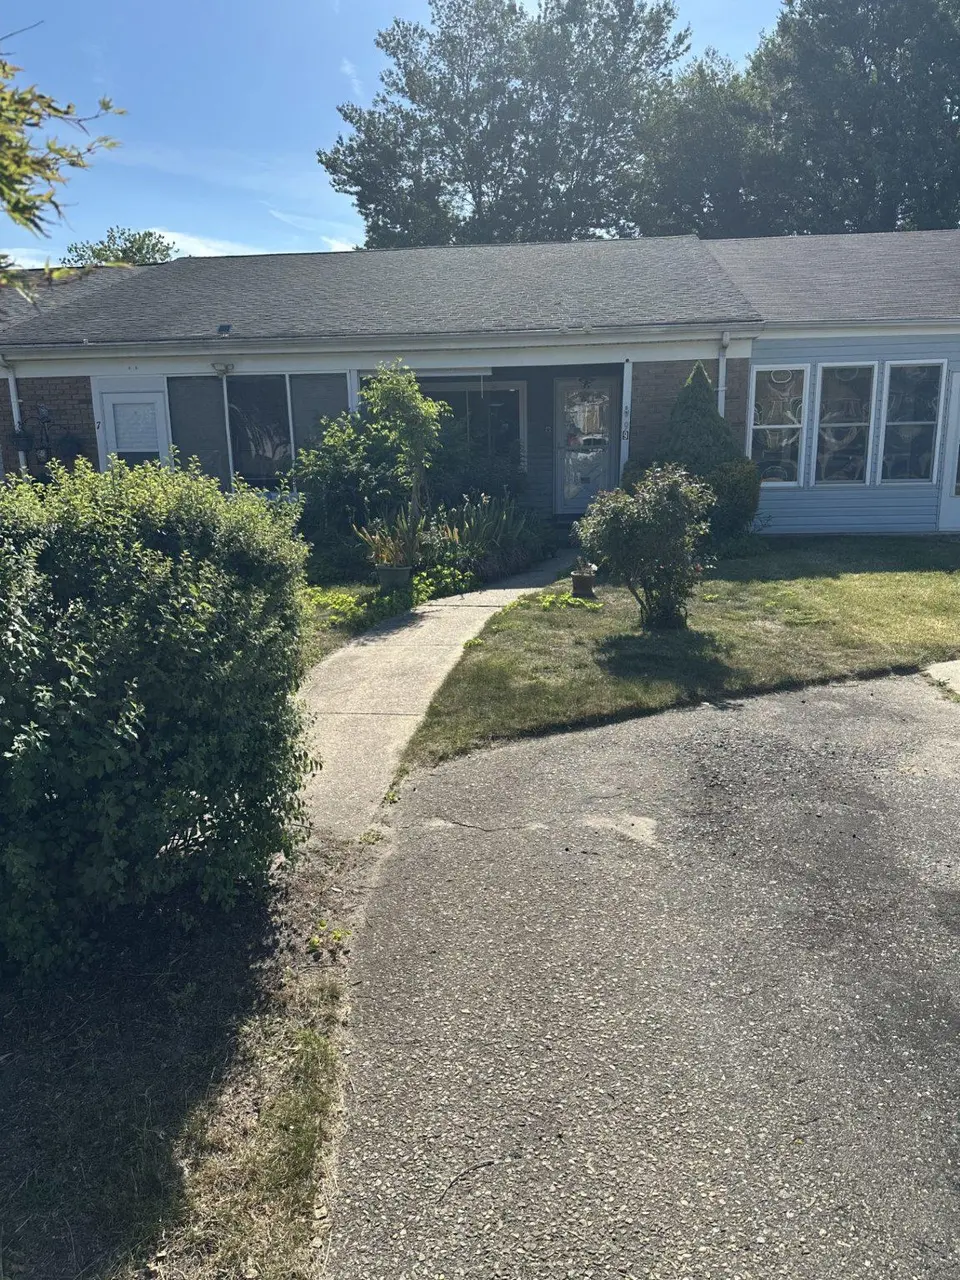
9 Farrington Ct · Leisuretowne, NJ
Flood risk 1/10 · Minimal
- FEMA flood zone
- X (unshaded)
- Chance of flooding over 30 yrs
- 0.0%
- Est. flood insurance / yr
- $507 – $1,088
Fire risk 5/10 · Moderate
- Est. fire insurance / yr
- $526 – $976
Heat risk 7/10 · Major
- Hot days now (above 103°F)
- 7 days/yr
- Hot days in 30 yrs
- 16 days/yr
Wind risk 6/10 · Moderate
- Chance of severe wind over 30 yrs
- 67.0%
Air-quality risk 4/10 · Minor
- Unhealthy air days now
- 4 days/yr
- Unhealthy air days in 30 yrs
- 5 days/yr
Risk factors via First Street. Map © Google.
Why this score? — see what drove the C- grade
The composite is a weighted blend of 9 inputs, each scored 0–100. Each bar is that input's sub-score; the figure is the points it added to the 100-point composite (weight × sub-score).
- Cash flow +17.6/30.0
- ARV discount +12.0/15.0
- DSCR +5.5/10.0
- 1% rule +4.9/10.0
- Schools +4.5/10.0
- Livability +2.9/5.0
- Rent growth +2.5/5.0
- Condition / age +2.5/5.0
- Appreciation +0.0/10.0
$169,000
🖨 Deal sheet 📄 Offer letter ✓ Due diligence
Listing remarks
One of the lowest-priced homes in LeisureTowne! Why rent when you can own? Situated on a quiet cul-de-sac with minimal traffic, this home offers a convenient location close to the front entrance while remaining tucked away from the main thoroughfare. Ready for immediate occupancy, features a range, refrigerator, washer, and dryer. Enjoy the nicely landscaped setting with mature trees in both the front and rear yards, creating a pleasant outdoor environment. The backyard offers additional space to relax and enjoy the surroundings. Don't miss this opportunity—homes at this price point are hard to find in LeisureTowne!
Key facts
- Quiet cul-de-sac
- Convenient location
- Backyard space
Tags
Property features AI
Finance
- HOA & community: Monthly HOA fee of $89; HOA covers common area maintenance, trash, and pool(s); Community amenities include swimming pool and tennis courts; Ground rent paid annually
Exterior
- Parking: Driveway (1 space); 1 total garage/parking space
- Utilities: Public water; Private sewer; Electric hot water
- Home design: Interior townhouse/rowhouse; Fee simple ownership; Senior community (55+)
- Construction: Aluminum siding and stone exterior; Slab foundation; Above grade structure
- Exterior features: Porch(es); Sidewalks; Street lights; Front yard; Rear yard
Interior
- Kitchen: Range hood; Refrigerator
- Bedrooms: 1 bedroom on main level; Rooms include: Living Room, Master Bedroom, Kitchen (4 total rooms)
- Flooring: Fully carpeted; Vinyl; Tile/brick
- Bathrooms: 1 full bathroom on main level
- Heating & cooling: 90% forced air heating; Electric heating fuel; Central air (electric)
- Interior features: Breakfast area; Estimated living area
- Laundry & utility: Main floor laundry; Dryer
Neighborhood map
What this means for you Summary
Snapshot
- This is a 1-bed/1.0-bath townhouse listed at $169k.
Deal economics
- At list price, monthly cash flow is $133 ($2k/yr) — positive.
- The deal already cash-flows at list — no discount required.
- To meet the 1% rule (rent ≥ 1% of price), the offer needs to be $167k (1.3% below list).
- Recommended offer: $167k (1.3% below list) — sets the bar for 1% rule.
- Cap rate 7.2% vs local median 4.2% in Leisuretowne — top-decile yield for the area; either an underpriced asset or a hidden risk that comps aren't pricing in. Stress-test before assuming the spread holds.
Location & tenants
- Location reads 57/100 on livability (#516 in NJ) — a working-class tenant base; expect higher turnover. Strengths: crime A+, housing A+, cost of living A-; Watch: amenities F, commute F, health & safety F.
- Lenape Regional High School District (suburban): math 34% / reading 60% proficiency, ranked #136 of 472 in NJ (top 29%) — families likely to look elsewhere, expect single-tenant / working-renter base with shorter leases.
- Zoned schools: Seneca High School (math 34% / reading 57%, grade D-, #138 of 399 statewide, top 36%, 1,018 students, 12% FRL).
- Market conditions: 156 active listings in the ZIP; 2 comparable units currently listed for rent nearby; 2,161 units permitted in Burlington County in 2024 (988 in 5+ unit buildings).
Forward outlook
- Local home prices are declining (-3.0%/yr); year-one equity from $1k of loan paydown is wiped out by about $5k of value loss. Plan a longer hold.
- Burlington County population projected to shrink 5% by 2050 — rents likely to lag national; underwrite the cash flow, not the appreciation.
Negotiation context
- Only 13 days on market — expect competitive offers; lowballing is unlikely to land.
- 2 sale attempts since 24y ago with the ask held roughly flat each time — persistent listings suggest the price (not the market) is what's stuck; bring a comps-based counter.
- Current owner paid $65k; list at $169k implies a 160% gain — meaningful room to come down on a strong offer.
Risks & watch-outs
- Climate carrying-cost: major wind risk, 67% chance of damaging wind over 30y; moderate wildfire risk; extreme-heat days projected 7→16/yr by 2055 (HVAC capex compounding) — expect insurance premiums to compound above CPI over the hold.
Questions for the listing agent
- Built in 1971 — when were the roof, HVAC, electrical panel, plumbing, and water heater last replaced?
- What does the HOA fee cover, when was the last increase, and are there any pending special assessments or reserve-fund shortfalls?
- Is there a deadline driving the sale (1031 exchange, divorce, estate, relocation)? That informs how much negotiation room exists.
- Schools are F-rated, which usually means shorter tenancies and higher turnover. Who's the typical renter profile here, and what's been the actual vacancy rate?
- What's the average days-on-market for RENTAL listings here right now (not sales)? A rising rental-DOM trend means longer vacancies and softer asking-rent achievability than the comps imply.
- What's the recent tenant-quality profile in this submarket — average credit score on applications, eviction rate, late-payment / NSF rate, and stable-employment percentage? A property-management company in the area should have these aggregated.
- How much new for-sale + rental construction is in the pipeline within 1–3 miles? Heavy new supply typically softens prices + rents 12–24 months out; constrained supply supports both.
Investment metrics
- 1% rule
- 0.99% ✗
- Cap rate
- 7.24%
- Cash-on-cash
- 3.38%
- DSCR
- 1.15
- GRM
- 8.4
CMA / ARV
- ARV (on-the-fly)
- $187,680
- Comps found
- 2
Show comp detail 2 sales within ~0.75 mi
| Address | Dist | Beds/Ba | Sqft | Sold | Price | $/sf | Match |
|---|---|---|---|---|---|---|---|
| 24 Farrington Ct | 0.04mi | 1/1.0 | 782 (0%) | 0mo | $188,000 | $240 | 98 |
| 7 Kingston Way | 0.21mi | 1/1.0 | 782 (0%) | 23mo | $136,500 | $175 | 72 |
Match score weights: distance 35% · size 25% · config 20% · recency 20%. Top-matched comps best support the ARV.
Projected returns pro-forma
-3.0% appreciation · 3.0% rent growth · sell at horizon
- IRR
- -11.0%
- Equity multiple
- 0.60×
- Total profit
- $-18,860
- Equity at exit
- $25,198
- IRR
- -1.7%
- Equity multiple
- 0.89×
- Total profit
- $-5,347
- Equity at exit
- $14,612
Cash invested: $47,320 (down + closing). Projections, not guarantees.
Landlord ↔ Tenant lean methodology
- Overall (STATE)
- 21 Tenant-Leaning
- State New Jersey
- 21 Tenant-Leaning · D+6
- County
- — inherits STATE
- City
- — inherits STATE
ZIP-level market 08088
- Active inventory
- 156
- Price-to-rent
- 8.4×
Monthly cashflow live
- Estimated rent
- $1,668 medium interval (Pro) →
- Mortgage (P&I)
- −$886
- Tax from tax record
- −$139 /mo · $1,670/yr
- Insurance
- −$70
- HOA
- −$89
- Vacancy / Maint / Mgmt
- −$350
- Net cashflow
- $133
Break-even live
UW: 25.0% down · 7.5% · 30yr · 1.5% tax · 5.0% vac · 8.0% maint · 8.0% mgmt
Financing live
Cash to close
- Down payment
- $42,250
- Closing costs
- $5,070
- Reserves months
- —
- Total cash needed
- —
Loan-product check · same deal, 3 products live
Conventional
25% down · 7.5% · 30yr
- Down + closing
- —
- Monthly P&I
- —
- Monthly cashflow
- —
- DSCR
- —
- Eligible?
- —
Personal DTI + credit; lowest rate.
DSCR
20% down · 8.5% · 30yr
- Down + closing
- —
- Monthly P&I
- —
- Monthly cashflow
- —
- DSCR
- —
- Eligible?
- —
No personal income docs; deal must DSCR.
Hard money
10% down · 12.0% · 12mo
- Down + closing
- —
- Monthly P&I
- —
- Monthly cashflow
- —
- DSCR
- —
- Eligible?
- —
Short-term bridge; refi at stabilization.
Rent comps 2 comps
| Address | Beds | Baths | Sqft | Rent | $/sqft | DOM | Units | Dist |
|---|---|---|---|---|---|---|---|---|
| 62 Kingston Way Southampton, NJ | 1.0 | 1.0 | 782 | $1,500 | $1.92 | 1d | 1 | 0.10mi |
| 9 Narberth Pl Southampton, NJ | 2.0 | 1.0 | 984 | $2,100 | $2.13 | 1d | 1 | 0.20mi |
HOA detail
- Monthly dues
- $89 · $1,068/yr
Listing history 10 events
-
2026-06-18days on market $169,000 Active 13 DOM
-
2026-06-17days on market $169,000 Active 12 DOM
-
2026-06-16days on market $169,000 Active 11 DOM
-
2026-06-15days on market $169,000 Active 10 DOM
-
2026-06-13days on market $169,000 Active 8 DOM
-
2026-06-13days on market $169,000 Active 7 DOM
-
2026-06-09days on market $169,000 Active 4 DOM
-
2026-06-08days on market $169,000 Active 3 DOM
-
2026-06-07remarks 623-char remark
-
2026-06-07$169,000 Active 2 DOM
ⓘ Source: listings_history table (triggers on properties + properties_extension) + one-shot
backfill from property_details.listing_events for pre-trigger history.
Tax reassessment forecast NJ · Partial reset (capped growth)
- Current annual tax
- $1,670 · $139/mo
- Projected year-2 tax
- $2,939 · $245/mo
- Expected delta
- +$1,269/yr (+$106/mo · 76.0%)
ⓘ Screening estimate from a state-policy table — verify with the county assessor before closing.
Climate risk First Street
- Flood 1/10 Low FEMA zone X (unshaded) · 0% chance over 30 yrs
- Wildfire 5/10 Major
- Heat 7/10 Severe 7 d/yr ≥103°F today · 16 d/yr by 30 yrs out
- Wind 6/10 Major 67% chance of damaging wind over 30 yrs
- Air quality 4/10 Moderate 4 unhealthy d/yr today · 5 by 30 yrs out
Nearby sold comps map
Loading sold comps map…
Walkable amenities ~0.75 mi
Loading nearby amenities…
Taxation est. · year 1
- Rental income
- $20,022
- − Mortgage interest
- −$9,467
- − Property taxes
- −$1,670
- − Insurance
- −$845
- − Repairs & maintenance
- −$1,602
- − Management
- −$1,602
- − HOA
- −$1,068
- − Depreciation
- −$4,916
- Taxable loss
- −$1,147
- Est. tax savings @ 24.0%
- +$275
- After-tax cash flow
- $1,875/yr
For passive investors: Depreciation is non-cash, so a rental often shows a tax loss while cash-flowing — sheltering income. Rental losses are passive: they offset passive income freely, and up to $25,000/yr can offset ordinary (W-2) income if you actively participate and your MAGI is under $100k (phasing out to $0 by $150k); unused losses carry forward. On sale, claimed depreciation is recaptured at up to 25%, and gains may owe capital-gains tax (a 1031 exchange can defer both). Figures are a year-1 estimate at your 24.0% rate — not tax advice; consult a CPA.
Schools (NCES district)
- District
- Lenape Regional High School District
- NCES district ID
- 3408490
- Math proficiency
- 34% ▼ -2.00%
- Reading proficiency
- 60% ▼ -5.00%
- Median HH income
- $98,739
- Composite
- 44.86/100
- National rank
- #2724
- State rank
- #136 of 472 in NJ
Livability — Leisuretowne
- Score
- 57/100
- State rank
- #516
- US rank
- #21971
Category grades
Schools grade is shown separately in the Schools card above.
Census & demographics
- Census place
- Leisuretowne, NJ
- Population (ZIP)
- 24,153
Population outlook (Burlington County) Hauer SSP2
- Today (2025)
- 453,425 people
- By 2030
- 452,359 · -0.2%
- By 2040
- 445,033 · -1.9%
- By 2050
- 431,760 · -4.8%
- By 2075
- 406,277 · -10.4%
- By 2100
- 364,732 · -19.6%
Race, ethnicity, and origin ACS 2023
- Neighborhood character
- Predominantly White (90%)
- Race & ethnicity
- White 90% Hispanic / Latino 4% Two or more races 4% Asian 2% Black 1%
- Common ancestry
- Romanian 8% Slovak 2% Iranian 2%
- Foreign-born
- 4% · Canada, China
- Languages at home
- 94% English-only · Spanish 3% Chinese 1%
Political lean MEDSL · Burlington
- 2024 margin
- D (+16.6) · D 57.6% · R 41.0% · Other 1.3%
- 2008→2024 swing
- -2.0pp toward R · 2008: 18.6pp · 2024: 16.6pp
- All cycles
- 2024: D+16.6 2020: D+19.5 2016: D+14.8 2012: D+18.7 2008: D+18.6
Not yet ingested
- Civics
- —
Market trends
- HPI YoY
- ▼ -214.45%
- Current HPI
- 302.9094
- Rent YoY
- —
- Metro
- —
- State GDP YoY
- ▲ 2.05%
- F500 in state
- 34
Industry mix (Fortune 500 HQ in NJ)
| Industry | F500 HQs | Revenue |
|---|---|---|
| Consumer Goods | 3 | $31B |
|
||
| Pharmaceuticals | 2 | $153B |
|
||
| Technology | 2 | $21B |
|
||
| Insurance | 2 | $20B |
|
||
| Healthcare | 2 | $19B |
|
||
| Financial Services | 1 | $70B |
|
||
Price history
+356.8% since first listed5 events — show timeline
- 2026-06-05 Listed $169,000 BRIGHT MLS
- 2004-05-18 Sold (Public Records) $65,000 Public Records
- 2002-03-30 Listing Removed — BRIGHT MLS
- 2002-03-30 Listed $46,500 BRIGHT MLS
- 1998-02-06 Sold (Public Records) $37,000 Public Records
Property tax history
+0.4%/yrLatest (2025): $1,670 · +1.6% YoY. Source: county tax records.
Cash-flow waterfall
monthlySold comps — $/sqft
last 12 mo · ≤1 miLoading sold comps…