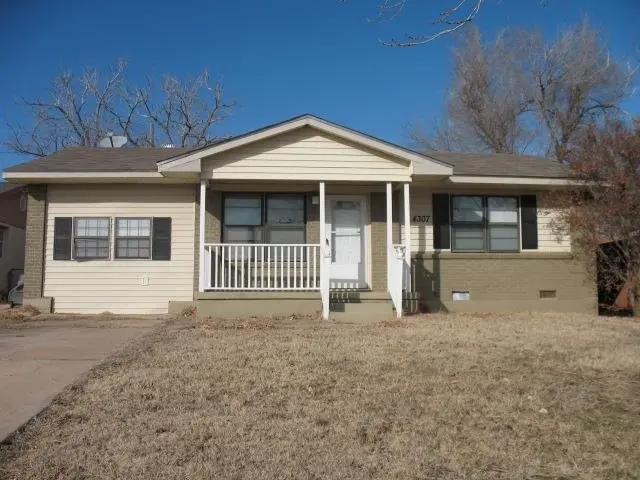
4307 NW Pollard · Lawton, OK
Flood risk 1/10 · Minimal
- FEMA flood zone
- X (unshaded)
- Chance of flooding over 30 yrs
- 0.0%
- Est. flood insurance / yr
- $507 – $1,088
Fire risk 6/10 · Moderate
- Est. fire insurance / yr
- $2,463 – $4,575
Heat risk 6/10 · Moderate
- Hot days now (above 109°F)
- 7 days/yr
- Hot days in 30 yrs
- 19 days/yr
Wind risk 2/10 · Minimal
- Chance of severe wind over 30 yrs
- 5.0%
Air-quality risk 1/10 · Minimal
- Unhealthy air days now
- 0 days/yr
- Unhealthy air days in 30 yrs
- 0 days/yr
Risk factors via First Street. Map © Google.
Why this score? — see what drove the B- grade
The composite is a weighted blend of 9 inputs, each scored 0–100. Each bar is that input's sub-score; the figure is the points it added to the 100-point composite (weight × sub-score).
- Cash flow +30.0/30.0
- 1% rule +10.0/10.0
- DSCR +10.0/10.0
- ARV discount +7.5/15.0
- Rent growth +3.8/5.0
- Livability +3.2/5.0
- Condition / age +2.5/5.0
- Schools +2.0/10.0
- Appreciation +0.0/10.0
$64,950
🖨 Deal sheet 📄 Offer letter ✓ Due diligence
Listing remarks
Welcome to this charming 3 bedroom, 1 bath home offering approximately 1,300 sq. ft. of comfortable living space. You’ll love the oversized living room, expertly converted to maximize the home's footprint. The heart of the home features a classic kitchen, complemented by a large utility room that doubles as a mudroom with plenty of storage right off the kitchen. Enjoy peaceful mornings on the front porch or entertain out back on the open patio in the spacious backyard. This energy-efficient, total electric home is ready for new owners. Call Richard Hixon today at 580-585-0595 for additional information or to schedule a private tour.
Key facts
- Open patio
- Front porch
- Classic kitchen
Tags
Property features AI
Exterior
- Parking: No garage (garage converted)
- Security: Smoke detectors
- Utilities: Public water; Public sewer
- Home design: Single-family residence; One-level
- Construction: Brick veneer construction
- Exterior features: Covered patio and porch; Porch; Patio; Partial chain-link fencing; Storm doors; Composition roof; Paved, city-maintained street frontage (public road)
Interior
- Kitchen: Cooktop; Refrigerator; Range hood; Electric water heater
- Flooring: Carpet; Laminate
- Bathrooms: 1 full bathroom
- Heating & cooling: Central heating; Heat pump; Central air; Ceiling fans; Electric cooling
- Interior features: Double-pane windows with window coverings; Updated/remodeled condition; Smoke detectors
- Laundry & utility: Washer hookup; Crawl space
Neighborhood map
What this means for you Summary
Snapshot
- This is a 3-bed/1.0-bath single-family listed at $65k.
Deal economics
- At list price, monthly cash flow is $570 ($7k/yr) — positive.
- The deal already cash-flows at list — no discount required.
- Meets the 1% rule at list price ($1k rent vs $65k).
- Recommended offer: $63k (3.0% below list) — sets the bar for market timing.
- Cap rate 16.8% vs local median 6.1% in Lawton — top-decile yield for the area; either an underpriced asset or a hidden risk that comps aren't pricing in. Stress-test before assuming the spread holds.
Location & tenants
- Location reads 63/100 on livability (#206 in OK) — a middle-class / working-renter tenant base. Strengths: cost of living A+, housing A+; Watch: employment D, crime F, commute F.
- Lawton (urban): math 20% / reading 26% proficiency, ranked #137 of 270 in OK (top 51%) — low school quality limits family demand, transient renter base, plan for 1-2y turnover.
- Zoned schools: Ridgecrest Es (math 27% / reading 17%, grade F, #413 of 845 statewide, top 54%, 453 students, 0% FRL); Eisenhower Ms (math 20% / reading 30%, grade F, #90 of 345 statewide, top 27%, 1,035 students, 0% FRL); Eisenhower Hs (math 19% / reading 29%, grade F, #215 of 447 statewide, top 48%, 1,350 students, 0% FRL) — zoned schools average 0% FRL vs 54% district-wide (54 pts lower); this property's tenant base skews higher-income than the district average.
- Market conditions: Rents rising fast (+5.1%/yr); 398 active listings in the ZIP; 133 units permitted in Comanche County in 2024 (0 in 5+ unit buildings).
Forward outlook
- Local home prices are declining (-3.0%/yr); year-one equity from $450 of loan paydown is wiped out by about $2k of value loss. Plan a longer hold.
- Comanche County population projected to shrink 3% by 2050 — rents likely to lag national; underwrite the cash flow, not the appreciation.
- At projected returns (-3.0% appreciation + 5.1% rent growth), your $18k cash investment doubles in ~4 years — after that, you're playing with house money.
Negotiation context
- It's been on market 59 days — a 3% lower offer ($63k) is reasonable based on typical stale-listing flexibility.
- 4 sale attempts since 2y ago with the ask held roughly flat each time — persistent listings suggest the price (not the market) is what's stuck; bring a comps-based counter.
Risks & watch-outs
- Climate carrying-cost: major wildfire risk; extreme-heat days projected 7→19/yr by 2055 (HVAC capex compounding) — expect insurance premiums to compound above CPI over the hold.
Questions for the listing agent
- It's been on market 59 days. Have you received any prior offers? Is the seller open to a 3% concession, seller financing, or rate buy-down credit?
- Built in 1961 — when were the roof, HVAC, electrical panel, plumbing, and water heater last replaced?
- Is there a deadline driving the sale (1031 exchange, divorce, estate, relocation)? That informs how much negotiation room exists.
- Schools are D-rated, which usually means shorter tenancies and higher turnover. Who's the typical renter profile here, and what's been the actual vacancy rate?
- Crime grade is F in this area — have there been break-ins, vandalism, or insurance claims at this property in the last 3 years? What carrier currently insures it and at what premium?
- What's the average days-on-market for RENTAL listings here right now (not sales)? A rising rental-DOM trend means longer vacancies and softer asking-rent achievability than the comps imply.
- What's the recent tenant-quality profile in this submarket — average credit score on applications, eviction rate, late-payment / NSF rate, and stable-employment percentage? A property-management company in the area should have these aggregated.
- How much new for-sale + rental construction is in the pipeline within 1–3 miles? Heavy new supply typically softens prices + rents 12–24 months out; constrained supply supports both.
Investment metrics
- 1% rule
- 1.95% ✓
- Cap rate
- 16.83%
- Cash-on-cash
- 37.63%
- DSCR
- 2.67
- GRM
- 4.3
CMA / ARV
- ARV (on-the-fly)
- $147,516
- Comps found
- 12
Show comp detail 12 sales within ~0.75 mi
| Address | Dist | Beds/Ba | Sqft | Sold | Price | $/sf | Match |
|---|---|---|---|---|---|---|---|
| 4313 NW Pollard Ave | 0.03mi | 4/1.0 (+1) | 1,400 (+8%) | 1mo | $76,000 | $54 | 79 |
| 1712 NW 49th St | 0.67mi | 3/1.0 | 1,300 (+0%) | 4mo | $46,001 | $35 | 65 |
| 4811 NW Lindy Ave | 0.40mi | 3/2.0 | 1,200 (-7%) | 4mo | $141,492 | $118 | 62 |
| 1707 NW 49th St | 0.71mi | 3/2.0 | 1,300 (+0%) | 1mo | $165,000 | $127 | 61 |
| 1703 NW 43rd St | 0.49mi | 3/2.0 | 1,200 (-7%) | 2mo | $171,450 | $143 | 60 |
| 2306 NW 47th St | 0.28mi | 3/1.5 | 1,100 (-15%) | 1mo | $125,000 | $114 | 59 |
| 4635 NW Lincoln Ave | 0.53mi | 3/1.5 | 1,200 (-7%) | 4mo | $110,000 | $92 | 58 |
| 3512 NW Rogers Ln | 0.57mi | 2/1.0 (-1) | 1,200 (-7%) | 2mo | $94,700 | $79 | 54 |
| 2414 NW 30th St | 0.63mi | 3/2.0 | 1,200 (-7%) | 2mo | $45,000 | $38 | 52 |
| 4508 NW Denver Ave | 0.49mi | 4/2.0 (+1) | 1,400 (+8%) | 3mo | $155,000 | $111 | 52 |
| 4607 NW Lincoln Ave | 0.41mi | 3/2.0 | 1,100 (-15%) | 4mo | $127,500 | $116 | 49 |
| 1709 NW 50th St | 0.68mi | 3/1.5 | 1,400 (+8%) | 5mo | $174,900 | $125 | 49 |
Match score weights: distance 35% · size 25% · config 20% · recency 20%. Top-matched comps best support the ARV.
Projected returns pro-forma
-3.0% appreciation · 5.14% rent growth · sell at horizon
- IRR
- 36.0%
- Equity multiple
- 2.57×
- Total profit
- $28,591
- Equity at exit
- $9,684
- IRR
- 43.8%
- Equity multiple
- 5.60×
- Total profit
- $83,638
- Equity at exit
- $5,616
Cash invested: $18,186 (down + closing). Projections, not guarantees.
Landlord ↔ Tenant lean methodology
- Overall (STATE)
- 83 Strongly Landlord-Friendly
- State Oklahoma
- 83 Strongly Landlord-Friendly · R+20
- County
- — inherits STATE
- City
- — inherits STATE
ZIP-level market 73505
- Rents YoY
- 5.1%
- Active inventory
- 398
- Price-to-rent
- 4.3×
Monthly cashflow live
- Estimated rent
- $1,266 medium interval (Pro) →
- Mortgage (P&I)
- −$341
- Tax from tax record
- −$62 /mo · $747/yr
- Insurance
- −$27
- HOA
- −$0
- Vacancy / Maint / Mgmt
- −$266
- Net cashflow
- $570
Break-even live
UW: 25.0% down · 7.5% · 30yr · 1.5% tax · 5.0% vac · 8.0% maint · 8.0% mgmt
Financing live
Cash to close
- Down payment
- $16,238
- Closing costs
- $1,948
- Reserves months
- —
- Total cash needed
- —
Loan-product check · same deal, 3 products live
Conventional
25% down · 7.5% · 30yr
- Down + closing
- —
- Monthly P&I
- —
- Monthly cashflow
- —
- DSCR
- —
- Eligible?
- —
Personal DTI + credit; lowest rate.
DSCR
20% down · 8.5% · 30yr
- Down + closing
- —
- Monthly P&I
- —
- Monthly cashflow
- —
- DSCR
- —
- Eligible?
- —
No personal income docs; deal must DSCR.
Hard money
10% down · 12.0% · 12mo
- Down + closing
- —
- Monthly P&I
- —
- Monthly cashflow
- —
- DSCR
- —
- Eligible?
- —
Short-term bridge; refi at stabilization.
Listing history 25 events
-
2026-06-19days on market $64,950 Active 59 DOM
-
2026-06-18days on market $64,950 Active 58 DOM
-
2026-06-17days on market $64,950 Active 57 DOM
-
2026-06-16days on market $64,950 Active 56 DOM
-
2026-06-15days on market $64,950 Active 55 DOM
-
2026-06-14days on market $64,950 Active 53 DOM
-
2026-06-13days on market $64,950 Active 52 DOM
-
2026-06-10days on market $64,950 Active 50 DOM
-
2026-06-09days on market $64,950 Active 49 DOM
-
2026-06-08days on market $64,950 Active 48 DOM
-
2026-06-07days on market $64,950 Active 47 DOM
-
2026-06-05days on market $64,950 Active 44 DOM
-
2026-06-03days on market $64,950 Active 43 DOM
-
2026-06-02days on market $64,950 Active 42 DOM
-
2026-06-01days on market $64,950 Active 41 DOM
-
2026-05-31days on market $64,950 Active 40 DOM
-
2026-05-30days on market $64,950 Active 39 DOM
-
2026-05-28status Active
-
2026-05-28price $64,950
-
2026-03-16$67,500 Active
-
2025-03-27status Active
-
2024-10-28price $72,500
-
2024-09-13$78,500 Active
-
2006-09-19soldstatus $76,500
-
2006-04-19soldstatus $45,000
ⓘ Source: listings_history table (triggers on properties + properties_extension) + one-shot
backfill from property_details.listing_events for pre-trigger history.
Tax reassessment forecast OK · Resets to sale price
- Current annual tax
- $747 · $62/mo
- Projected year-2 tax
- $747 · $62/mo
- Expected delta
- $0/yr ($0/mo · 0.0%)
ⓘ Screening estimate from a state-policy table — verify with the county assessor before closing.
Climate risk First Street
- Flood 1/10 Low FEMA zone X (unshaded) · 0% chance over 30 yrs
- Wildfire 6/10 Major
- Heat 6/10 Major 7 d/yr ≥109°F today · 19 d/yr by 30 yrs out
- Wind 2/10 Low 5% chance of damaging wind over 30 yrs
- Air quality 1/10 Low 0 unhealthy d/yr today · 0 by 30 yrs out
Nearby sold comps map
Loading sold comps map…
Walkable amenities ~0.75 mi
Loading nearby amenities…
Taxation est. · year 1
- Rental income
- $15,194
- − Mortgage interest
- −$3,638
- − Property taxes
- −$747
- − Insurance
- −$325
- − Repairs & maintenance
- −$1,215
- − Management
- −$1,215
- − Depreciation
- −$1,889
- Taxable income
- $6,163
- Est. tax owed @ 24.0%
- −$1,479
- After-tax cash flow
- $5,365/yr
For passive investors: Depreciation is non-cash, so a rental often shows a tax loss while cash-flowing — sheltering income. Rental losses are passive: they offset passive income freely, and up to $25,000/yr can offset ordinary (W-2) income if you actively participate and your MAGI is under $100k (phasing out to $0 by $150k); unused losses carry forward. On sale, claimed depreciation is recaptured at up to 25%, and gains may owe capital-gains tax (a 1031 exchange can defer both). Figures are a year-1 estimate at your 24.0% rate — not tax advice; consult a CPA.
Schools (NCES district)
- District
- Lawton
- NCES district ID
- 4017250
- Math proficiency
- 20% ▼ -12.00%
- Reading proficiency
- 26% ▼ -9.00%
- Median HH income
- $42,618
- Composite
- 19.68/100
- National rank
- #8732
- State rank
- #137 of 270 in OK
Livability — Lawton
- Score
- 63/100
- State rank
- #206
- US rank
- #15131
Category grades
Schools grade is shown separately in the Schools card above.
Census & demographics
- Census place
- Lawton, OK
- County
- Comanche County · 96,361 people
- City population
- 89,233
- Metro
- Lawton, OK
- Population (ZIP)
- 47,790
- Household income
- $58,272
- Rent vs Own
- Severe rent burden
- 1986.0
Population outlook (Comanche County) Hauer SSP2
- Today (2025)
- 124,518 people
- By 2030
- 124,231 · -0.2%
- By 2040
- 122,193 · -1.9%
- By 2050
- 120,368 · -3.3%
- By 2075
- 120,492 · -3.2%
- By 2100
- 123,113 · -1.1%
Race, ethnicity, and origin ACS 2023
- Neighborhood character
- Diverse neighborhood (Simpson 0.70)
- Race & ethnicity
- White 50% Black 17% Two or more races 16% Hispanic / Latino 16% Native American 4% Asian 3%
- Hispanic origin (detail)
- Mexican 11% Puerto Rican 2%
- Common ancestry
- Lithuanian 2% Slovak 2% Romanian 1%
- Foreign-born
- 6% · Canada, South Korea
- Languages at home
- 88% English-only · Spanish 6% German/W. Germanic 2% Korean 1%
Political lean MEDSL · Comanche
- 2024 margin
- Strong R (+23.3) · D 37.4% · R 60.7% · Other 1.9%
- 2008→2024 swing
- -5.8pp toward R · 2008: -17.5pp · 2024: -23.3pp
- All cycles
- 2024: R+23.3 2020: R+20.1 2016: R+23.7 2012: R+17.0 2008: R+17.5
Not yet ingested
- Civics
- —
Market trends
- HPI YoY
- ▼ -134.88%
- Current HPI
- 169.4524
- Rent YoY
- ▲ 5.14%
- Metro
- Lawton, OK
- State GDP YoY
- ▲ 1.55%
- F500 in state
- 6
Industry mix (Fortune 500 HQ in OK)
| Industry | F500 HQs | Revenue |
|---|---|---|
| Energy | 3 | $48B |
|
||
Price history
+44.3% since first listed8 events — show timeline
- 2026-05-28 Relisted — LBRMLS
- 2026-05-28 Price Changed $64,950 LBRMLS
- 2026-03-16 Listed $67,500 LBRMLS
- 2025-03-27 Relisted — LBRMLS
- 2024-10-28 Price Changed $72,500 LBRMLS
- 2024-09-13 Listed $78,500 LBRMLS
- 2006-09-19 Sold (Public Records) $76,500 Public Records
- 2006-04-19 Sold (Public Records) $45,000 Public Records
Property tax history
+0.0%/yrLatest (2025): $747 · -0.5% YoY. Source: county tax records.
Cash-flow waterfall
monthlySold comps — $/sqft
last 12 mo · ≤1 miLoading sold comps…