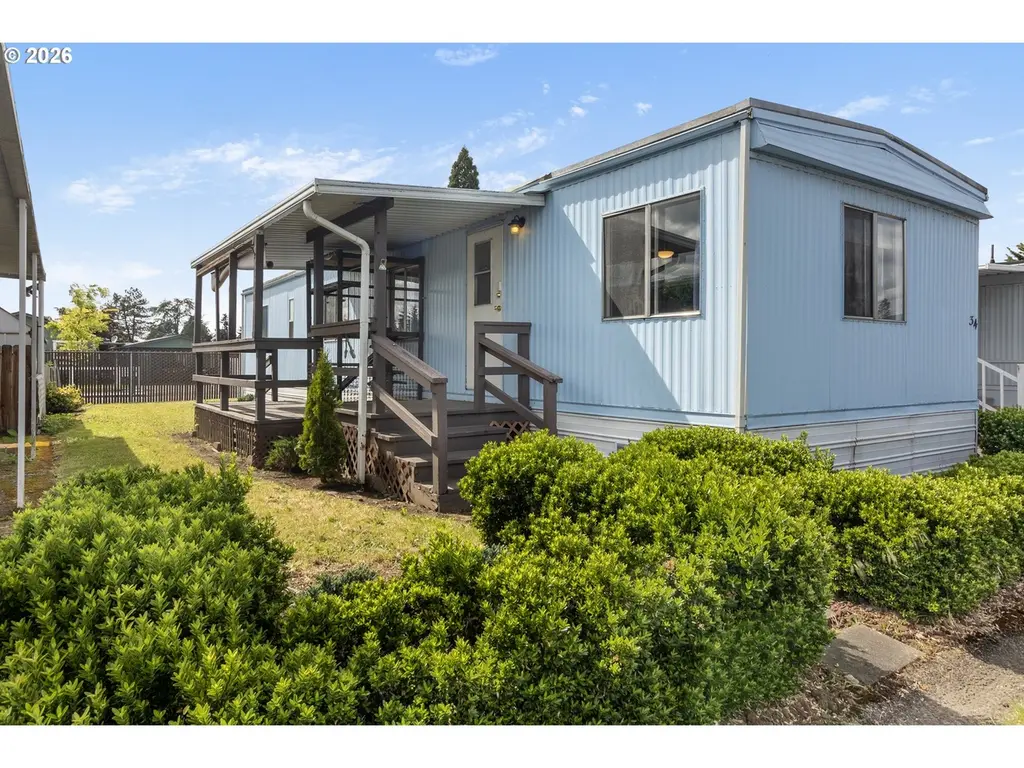
5335 Main St #34 · Springfield, OR
Flood risk 1/10 · Minimal
- FEMA flood zone
- X (unshaded)
- Chance of flooding over 30 yrs
- 0.0%
- Est. flood insurance / yr
- $507 – $1,088
Fire risk 5/10 · Moderate
- Est. fire insurance / yr
- $498 – $926
Heat risk 4/10 · Minor
- Hot days now (above 91°F)
- 7 days/yr
- Hot days in 30 yrs
- 15 days/yr
Wind risk 1/10 · Minimal
- Chance of severe wind over 30 yrs
- —
Air-quality risk 10/10 · Severe
- Unhealthy air days now
- 13 days/yr
- Unhealthy air days in 30 yrs
- 15 days/yr
Risk factors via First Street. Map © Google.
Why this score? — see what drove the C- grade
The composite is a weighted blend of 9 inputs, each scored 0–100. Each bar is that input's sub-score; the figure is the points it added to the 100-point composite (weight × sub-score).
- Cash flow +15.0/30.0
- ARV discount +15.0/15.0
- 1% rule +5.0/10.0
- DSCR +5.0/10.0
- Livability +4.2/5.0
- Rent growth +3.3/5.0
- Condition / age +2.5/5.0
- Schools +2.4/10.0
- Appreciation +0.0/10.0
$29,900
🖨 Deal sheet (PDF) 📄 Offer letter ✓ Due diligence
Listing remarks
Affordable and move-in ready home in Santiago Estates 55+ Community! This 1978 singlewide offers 2 bedrooms, 1 bathroom, and 728 sq ft of comfortable living space. All appliances are included, along with a stackable washer and dryer, making this home ready for its next owner. Mini split systems in both the living room and primary bedroom offer efficient heating and cooling. Enjoy the covered patio and unique enclosed cat shelter connected to the living room window, giving indoor cats a safe way to enjoy the outdoors. This home also features a partially fenced yard, storage shed, and carport. Enjoy resort-style amenities including a clubhouse, indoor Jacuzzi, fitness room, bocce ball court,
Key facts
- Carport
- Covered patio
- Storage shed
Tags
Property features AI
Finance
- Other: Lot size range listed as 0K to 2,999 SqFt; Unit dimensions approximately 52 ft by 14 ft; PARK NAME: Santiago Estates
- Financial info: Lot rent $1,050 per month
- HOA & community: 55+ senior community (Santiago Estates); Community amenities: clubhouse, pool, workout room, athletic court, bocce ball court, putting green, horseshoe area, sauna, spa/hot tub, weight room, recreation facilities
Exterior
- Parking: Carport (1 space)
- Security: No security features listed
- Utilities: Electric fuel; Public water; Public sewer
- Home design: Manufactured home in park; Residential property; Single-story (one level); Facing information not provided; Model: Sun Valley (1978)
- Construction: Built in 1978; Aluminum exterior; Membrane roof; Pillar/post/pier foundation
- Exterior features: Covered patio; In-ground pool; Sauna; Spa/hot tub; Tool shed; Yard; Level lot
Interior
- Kitchen: Dishwasher; Free-standing range; Range hood; Free-standing refrigerator
- Bedrooms: Primary bedroom (main level); Second bedroom (main level)
- Flooring: Vinyl; Carpet
- Bathrooms: 1 full bathroom (main level)
- Heating & cooling: Ductless heating (mini-split); Mini-split cooling
- Interior features: Vinyl flooring; Wall-to-wall carpet; Aluminum window frames with double-pane windows; One-level (accessible)
- Laundry & utility: Electric tank hot water
Neighborhood map
What this means for you Summary
Snapshot
- This is a 2-bed/1.0-bath manufactured listed at $30k.
Deal economics
- At list price, monthly cash flow is $983 ($12k/yr) — positive.
- The deal already cash-flows at list — no discount required.
- Meets the 1% rule at list price ($2k rent vs $30k).
- Recommended offer: $29k (1.5% below list) — sets the bar for market timing.
- Cap rate 45.8% vs local median 3.0% in Springfield — top-decile yield for the area; either an underpriced asset or a hidden risk that comps aren't pricing in. Stress-test before assuming the spread holds.
Location & tenants
- Location reads 83/100 on livability (#40 in OR, #934 nationally) — a professional / high-income tenant draw. Strengths: amenities A+, commute A+, housing A+; Watch: crime D+, employment D+.
- Springfield SD 19 (suburban): math 19% / reading 38% proficiency, ranked #48 of 58 in OR (top 83%) — low school quality limits family demand, transient renter base, plan for 1-2y turnover.
- Zoned schools: Mt Vernon Elementary School (math 5% / reading 34%, grade F, #366 of 412 statewide, top 91%, 412 students, 63% FRL); Agnes Stewart Middle School (math 16% / reading 36%, grade F, #101 of 128 statewide, top 80%, 513 students, 63% FRL); Thurston High School (math 22% / reading 52%, grade F, #85 of 143 statewide, top 61%, 1,277 students, 65% FRL).
- Market conditions: Rents rising (+3.4%/yr); 270 active listings in the ZIP; 1 comparable units currently listed for rent nearby; solid renter incomes; 1,808 units permitted in Lane County in 2024 (972 in 5+ unit buildings).
Forward outlook
- Local home prices are declining (-3.0%/yr); year-one equity from $207 of loan paydown is wiped out by about $897 of value loss. Plan a longer hold.
- Lane County population projected at +15% by 2050 — long-run rental-demand tailwind backs the buy-and-hold thesis.
- At projected returns (-3.0% appreciation + 3.4% rent growth), your $8k cash investment doubles in ~1 year — after that, you're playing with house money.
Negotiation context
- It's been on market 15 days — a 2% lower offer ($29k) is reasonable based on typical stale-listing flexibility.
Risks & watch-outs
- Climate carrying-cost: moderate wildfire risk — expect insurance premiums to compound above CPI over the hold.
Questions for the listing agent
- Built in 1978 — when were the roof, HVAC, electrical panel, plumbing, and water heater last replaced?
- Is there a deadline driving the sale (1031 exchange, divorce, estate, relocation)? That informs how much negotiation room exists.
- Schools are D-rated, which usually means shorter tenancies and higher turnover. Who's the typical renter profile here, and what's been the actual vacancy rate?
- Crime grade is D in this area — have there been break-ins, vandalism, or insurance claims at this property in the last 3 years? What carrier currently insures it and at what premium?
- What's the average days-on-market for RENTAL listings here right now (not sales)? A rising rental-DOM trend means longer vacancies and softer asking-rent achievability than the comps imply.
- What's the recent tenant-quality profile in this submarket — average credit score on applications, eviction rate, late-payment / NSF rate, and stable-employment percentage? A property-management company in the area should have these aggregated.
- How much new for-sale + rental construction is in the pipeline within 1–3 miles? Heavy new supply typically softens prices + rents 12–24 months out; constrained supply supports both.
Investment metrics
- 1% rule
- 5.04% ✓
- Cap rate
- 45.76%
- Cash-on-cash
- 140.95%
- DSCR
- 7.27
- GRM
- 1.7
CMA / ARV
- ARV (on-the-fly)
- $38,584
- Comps found
- 12
Show comp detail 12 sales within ~0.75 mi
| Address | Dist | Beds/Ba | Sqft | Sold | Price | $/sf | Match |
|---|---|---|---|---|---|---|---|
| 5335 Main St #34 | 0.00mi | 2/1.0 | 728 (0%) | 0mo | $29,900 | $41 | 100 |
| 205 S 54th St #108 | 0.16mi | 2/1.0 | 728 (0%) | 8mo | $60,000 | $82 | 86 |
| 5335 Main St #187 | 0.00mi | 2/1.0 | 784 (+8%) | 2mo | $55,000 | $70 | 86 |
| 5335 Main St #187 | 0.08mi | 2/1.0 | 746 (+2%) | 19mo | $60,000 | $80 | 76 |
| 205 S 54th St #108 | 0.08mi | 2/1.0 | 710 (-2%) | 23mo | $60,900 | $86 | 73 |
| 205 S 54th St | 0.15mi | 2/1.0 | 672 (-8%) | 13mo | $31,400 | $47 | 70 |
| 205 S 54th St #107 | 0.16mi | 2/1.0 | 768 (+6%) | 17mo | $11,500 | $15 | 69 |
| 205 S 54th St #117 | 0.16mi | 2/2.0 | 800 (+10%) | 8mo | $9,000 | $11 | 66 |
| 205 S 54th St #60 | 0.16mi | 2/1.0 | 784 (+8%) | 18mo | $22,500 | $29 | 65 |
| 5335 Daisy St #130 | 0.21mi | 3/1.0 (+1) | 672 (-8%) | 12mo | $20,000 | $30 | 62 |
| 5335 Daisy St #58 | 0.28mi | 2/1.0 | 784 (+8%) | 15mo | $57,000 | $73 | 62 |
| 658 S 57 Th st Space 67 | 0.33mi | 2/1.0 | 830 (+14%) | 18mo | $44,000 | $53 | 46 |
Match score weights: distance 35% · size 25% · config 20% · recency 20%. Top-matched comps best support the ARV.
Projected returns pro-forma
-3.0% appreciation · 3.38% rent growth · sell at horizon
- IRR
- —
- Equity multiple
- 7.97×
- Total profit
- $58,385
- Equity at exit
- $4,458
- IRR
- —
- Equity multiple
- 17.00×
- Total profit
- $133,969
- Equity at exit
- $2,585
Cash invested: $8,372 (down + closing). Projections, not guarantees.
Landlord ↔ Tenant lean methodology
- Overall (STATE)
- 28 Tenant-Leaning
- State Oregon
- 28 Tenant-Leaning · D+6
- County
- — inherits STATE
- City
- — inherits STATE
ZIP-level market 97478
- Rents YoY
- 3.4%
- Active inventory
- 270
- Price-to-rent
- 1.7×
Monthly cashflow live
- Estimated rent
- $1,506 medium interval (Pro) →
- Mortgage (P&I)
- −$157
- Tax est. 1.5%
- −$37 /mo · $448/yr
- Insurance
- −$12
- HOA
- −$0
- Vacancy / Maint / Mgmt
- −$316
- Net cashflow
- $983
Break-even live
Sensitivity live
| Price | -10% $1,004 | -5% $994 | +0% $983 | +5% $973 | +10% $963 |
|---|---|---|---|---|---|
| Rent | -10% $864 | -5% $924 | +0% $983 | +5% $1,043 | +10% $1,102 |
| Rate | -1.0pp $998 | -0.5pp $991 | base $983 | +0.5pp $976 | +1.0pp $968 |
UW: 25.0% down · 7.5% · 30yr · 1.5% tax · 5.0% vac · 8.0% maint · 8.0% mgmt
Financing live
Cash to close
- Down payment
- $7,475
- Closing costs
- $897
- Reserves months
- —
- Total cash needed
- —
Loan-product check · same deal, 3 products live
Conventional
25% down · 7.5% · 30yr
- Down + closing
- —
- Monthly P&I
- —
- Monthly cashflow
- —
- DSCR
- —
- Eligible?
- —
Personal DTI + credit; lowest rate.
DSCR
20% down · 8.5% · 30yr
- Down + closing
- —
- Monthly P&I
- —
- Monthly cashflow
- —
- DSCR
- —
- Eligible?
- —
No personal income docs; deal must DSCR.
Hard money
10% down · 12.0% · 12mo
- Down + closing
- —
- Monthly P&I
- —
- Monthly cashflow
- —
- DSCR
- —
- Eligible?
- —
Short-term bridge; refi at stabilization.
Rent comps 1 comps
| Address | Beds | Baths | Sqft | Rent | $/sqft | DOM | Units | Dist |
|---|---|---|---|---|---|---|---|---|
| 4625 Main St Unit 8 Springfield, OR | 2.0 | 1.0 | 650 | $1,250 | $1.92 | 15d | 1 | 0.92mi |
Listing history 7 events
-
2026-06-07statusdays on market $29,900 Pending 15 DOM
-
2026-06-03days on market $29,900 Active 14 DOM
-
2026-06-02days on market $29,900 Active 13 DOM
-
2026-06-01days on market $29,900 Active 12 DOM
-
2026-05-31days on market $29,900 Active 11 DOM
-
2026-05-30days on market $29,900 Active 10 DOM
-
2026-05-20$29,900 Active
ⓘ Source: listings_history table (triggers on properties + properties_extension) + one-shot
backfill from property_details.listing_events for pre-trigger history.
Climate risk First Street
- Flood 1/10 Low FEMA zone X (unshaded) · 0% chance over 30 yrs
- Wildfire 5/10 Major
- Heat 4/10 Moderate 7 d/yr ≥91°F today · 15 d/yr by 30 yrs out
- Wind 1/10 Low
- Air quality 10/10 Extreme 13 unhealthy d/yr today · 15 by 30 yrs out
Nearby sold comps map
Loading sold comps map…
Walkable amenities ~0.75 mi
Loading nearby amenities…
Taxation est. · year 1
- Rental income
- $18,075
- − Mortgage interest
- −$1,675
- − Property taxes
- −$448
- − Insurance
- −$150
- − Repairs & maintenance
- −$1,446
- − Management
- −$1,446
- − Depreciation
- −$870
- Taxable income
- $12,041
- Est. tax owed @ 24.0%
- −$2,890
- After-tax cash flow
- $8,910/yr
For passive investors: Depreciation is non-cash, so a rental often shows a tax loss while cash-flowing — sheltering income. Rental losses are passive: they offset passive income freely, and up to $25,000/yr can offset ordinary (W-2) income if you actively participate and your MAGI is under $100k (phasing out to $0 by $150k); unused losses carry forward. On sale, claimed depreciation is recaptured at up to 25%, and gains may owe capital-gains tax (a 1031 exchange can defer both). Figures are a year-1 estimate at your 24.0% rate — not tax advice; consult a CPA.
Schools (NCES district)
- District
- Springfield SD 19
- NCES district ID
- 4111670
- Math proficiency
- 19% ▼ -13.00%
- Reading proficiency
- 38% ▼ -10.00%
- Median HH income
- $42,236
- Composite
- 24.14/100
- National rank
- #7746
- State rank
- #48 of 58 in OR
Livability — Springfield
- Score
- 83/100
- State rank
- #40
- US rank
- #934
Category grades
Schools grade is shown separately in the Schools card above.
Census & demographics
- Census place
- Springfield, OR
- County
- Lane County · 310,476 people
- City population
- 76,907
- Metro
- Eugene-Springfield, OR
- Population (ZIP)
- 39,373
- Household income
- $80,086
- Rent vs Own
- Severe rent burden
- 904.0
Population outlook (Lane County) Hauer SSP2
- Today (2025)
- 391,933 people
- By 2030
- 405,860 · +3.6%
- By 2040
- 429,386 · +9.6%
- By 2050
- 452,016 · +15.3%
- By 2075
- 508,825 · +29.8%
- By 2100
- 531,208 · +35.5%
Race, ethnicity, and origin ACS 2023
- Neighborhood character
- Predominantly White (79%)
- Race & ethnicity
- White 79% Hispanic / Latino 12% Two or more races 9% Native American 1% Asian 1%
- Hispanic origin (detail)
- Mexican 9%
- Common ancestry
- Slovak 4% Lithuanian 3% Portuguese 3%
- Foreign-born
- 4% · Canada
- Languages at home
- 94% English-only · Spanish 5% Tagalog/Filipino 1%
Political lean MEDSL · Lane
- 2024 margin
- Strong D (+23.1) · D 60.0% · R 36.9% · Other 3.1%
- 2008→2024 swing
- -4.3pp toward R · 2008: 27.4pp · 2024: 23.1pp
- All cycles
- 2024: D+23.1 2020: D+24.3 2016: D+18.9 2012: D+23.4 2008: D+27.4
Not yet ingested
- Civics
- —
Market trends
- HPI YoY
- ▼ -395.83%
- Current HPI
- 302.9203
- Rent YoY
- ▲ 3.38%
- Metro
- Eugene-Springfield, OR
- State GDP YoY
- ▲ 2.05%
- F500 in state
- 2
Industry mix (Fortune 500 HQ in OR)
| Industry | F500 HQs | Revenue |
|---|---|---|
| Consumer Goods | 1 | $51B |
|
||
Price history
1 event — show timeline
- 2026-05-20 Listed $29,900 RMLS
Property tax history
-41.4%/yrLatest (2015): $6 · +0.0% YoY. Source: county tax records.
Cash-flow waterfall
monthlySold comps — $/sqft
last 12 mo · ≤1 miLoading sold comps…