 Triplex
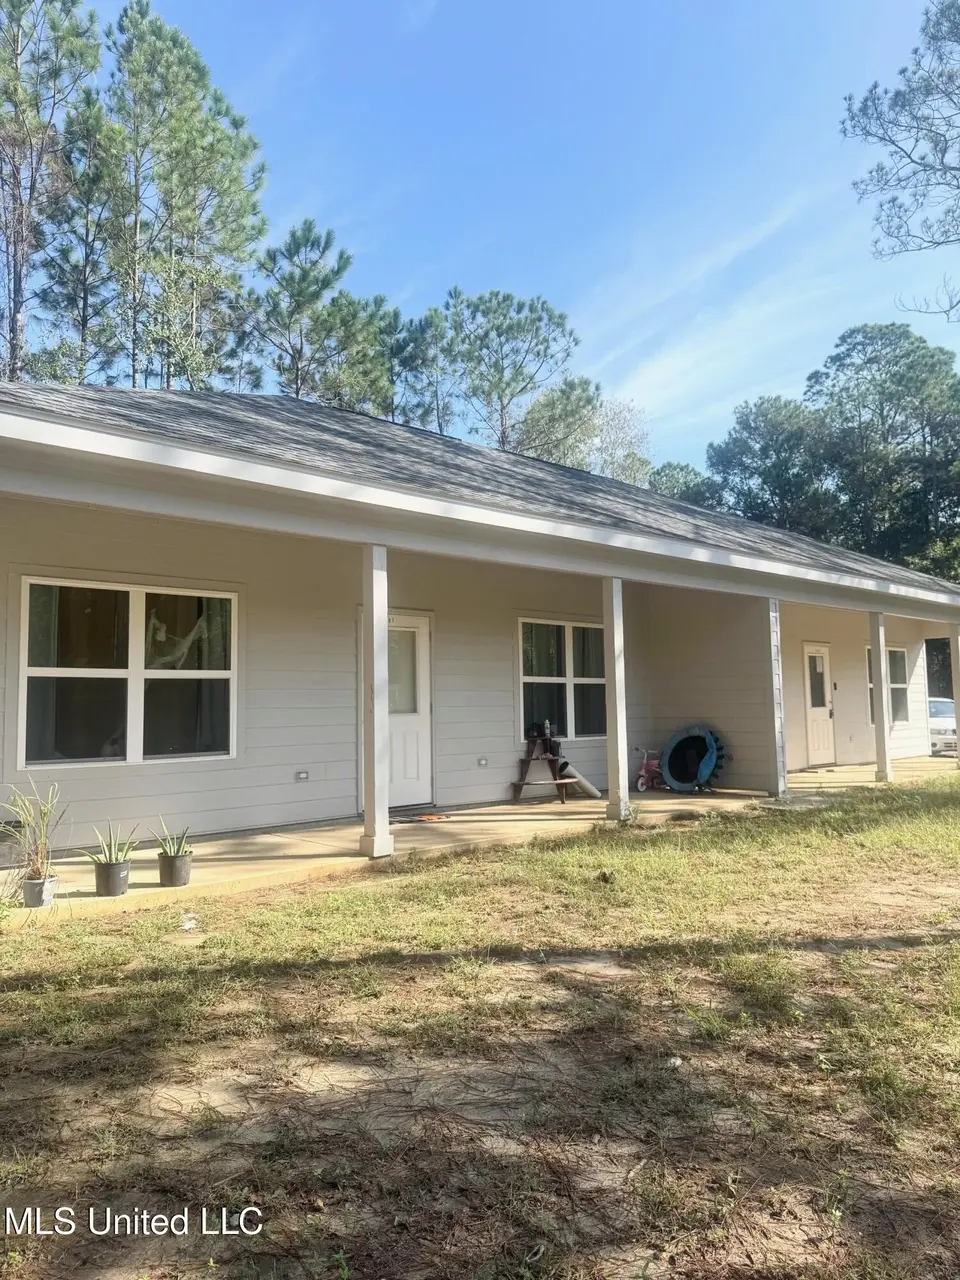
7087-7091 Hancock Dr · Waveland, MS
Flood risk 5/10 · Moderate
- FEMA flood zone
- AE
- Chance of flooding over 30 yrs
- 0.23%
- Est. flood insurance / yr
- $1,737 – $8,500
Fire risk 6/10 · Moderate
- Est. fire insurance / yr
- $1,241 – $2,305
Heat risk 10/10 · Severe
- Hot days now (above 107°F)
- 7 days/yr
- Hot days in 30 yrs
- 21 days/yr
Wind risk 10/10 · Severe
- Chance of severe wind over 30 yrs
- 99.0%
Air-quality risk 1/10 · Minimal
- Unhealthy air days now
- 0 days/yr
- Unhealthy air days in 30 yrs
- 0 days/yr
Risk factors via First Street. Map © Google.
Why this score? — see what drove the C grade
The composite is a weighted blend of 9 inputs, each scored 0–100. Each bar is that input's sub-score; the figure is the points it added to the 100-point composite (weight × sub-score).
- Cash flow +21.9/30.0
- ARV discount +7.5/15.0
- DSCR +7.0/10.0
- 1% rule +5.7/10.0
- Condition / age +4.0/5.0
- Schools +3.9/10.0
- Livability +3.1/5.0
- Rent growth +2.5/5.0
- Appreciation +0.0/10.0
$275,000
🖨 Deal sheet (PDF) 📄 Offer letter ✓ Due diligence
Multi-family units
County records classify this as Multi-Family (2-4 Unit). Listing-text estimate: 3 units. confirmed
Listing remarks MLS
New Construction Double in Bayside Park. Property currently is fully occupied. Each unit has 2 bedrooms and 1 bath with laundry hook ups and an open living/kitchen space giving plenty of room for a dining and living area. Each unit has a separate driveway. Just a few blocks from casinos and beaches. If you are looking for an investment property on the Gulf Coast...This one may be the one for you.
Key facts
- New construction
- Investment property
- Laundry hook ups
Tags
Neighborhood map
What this means for you Summary
Snapshot
- This is a 3 × 2-bed/1-bath units multifamily listed at $275k. Condition is rated good.
Deal economics
- At list price, monthly cash flow is $7 ($89/yr) — positive. Per door: $2/mo.
- The deal already cash-flows at list — no discount required.
- Meets the 1% rule at list price ($3k rent vs $275k).
- Recommended offer: $242k (12.0% below list) — sets the bar for market timing.
- Cap rate 8.2% vs local median 2.5% in Waveland — top-decile yield for the area; either an underpriced asset or a hidden risk that comps aren't pricing in. Stress-test before assuming the spread holds.
Location & tenants
- Location reads 61/100 on livability (#199 in MS) — a middle-class / working-renter tenant base. Strengths: cost of living A+, housing A+, health & safety A+; Watch: amenities F, commute F, employment D-.
- Hancock County School District (rural): math 47% / reading 44% proficiency, ranked #23 of 130 in MS (top 18%) — families likely to look elsewhere, expect single-tenant / working-renter base with shorter leases.
- Zoned schools: South Hancock Elementary School (math 34% / reading 32%, grade F, #168 of 375 statewide, top 45%, 535 students, 100% FRL); Hancock Middle School (math 48% / reading 44%, grade D+, #39 of 179 statewide, top 22%, 958 students, 100% FRL); Hancock High School (math 42% / reading 43%, grade F, #42 of 197 statewide, top 21%, 1,187 students, 100% FRL) — zoned schools average 100% FRL vs 58% district-wide (41 pts higher); higher-poverty schools than district average — tighter screening recommended.
- Market conditions: 622 active listings in the ZIP; 248 units permitted in Hancock County in 2024 (0 in 5+ unit buildings).
Forward outlook
- Local home prices are declining (-3.0%/yr); year-one equity from $2k of loan paydown is wiped out by about $8k of value loss. Plan a longer hold.
- Hancock County population projected at +20% by 2050 — long-run rental-demand tailwind backs the buy-and-hold thesis.
Negotiation context
- It's been on market 256 days — a 12% lower offer ($242k) is reasonable based on typical stale-listing flexibility.
Risks & watch-outs
- Watch-outs: flood insurance adds $427/mo.
- Climate carrying-cost: in FEMA flood zone AE (mandatory federal flood insurance); severe wind risk, 99% chance of damaging wind over 30y; major wildfire risk; extreme-heat days projected 7→21/yr by 2055 (HVAC capex compounding) — expect insurance premiums to compound above CPI over the hold.
Questions for the listing agent
- It's been on market 256 days. Have you received any prior offers? Is the seller open to a 12% concession, seller financing, or rate buy-down credit?
- Can we see the unit-by-unit rent roll, current vacancy, and any below-market leases? What's the average tenancy length?
- What capital expenditures (roof, boiler, parking lot, exteriors) have been made in the last 5 years, and what's planned in the next 2?
- What's the actual annual flood-insurance premium (NFIP or private), and is the property in a SFHA with mandatory coverage?
- Why hasn't it sold? Are there any deal-killer items the seller is aware of (foundation, flood, title, zoning, code violations)?
- Is there a deadline driving the sale (1031 exchange, divorce, estate, relocation)? That informs how much negotiation room exists.
- Schools are F-rated, which usually means shorter tenancies and higher turnover. Who's the typical renter profile here, and what's been the actual vacancy rate?
- What's the average days-on-market for RENTAL listings here right now (not sales)? A rising rental-DOM trend means longer vacancies and softer asking-rent achievability than the comps imply.
- What's the recent tenant-quality profile in this submarket — average credit score on applications, eviction rate, late-payment / NSF rate, and stable-employment percentage? A property-management company in the area should have these aggregated.
- How much new apartment / multifamily construction is in the pipeline within 1–3 miles? Heavy new supply (>2% of stock underway) typically softens rents 12–24 months out; light construction supports rent growth.
Investment metrics
- 1% rule
- 1.07% ✓
- Cap rate
- 8.19%
- Cash-on-cash
- 6.76%
- DSCR
- 1.30
- GRM
- 7.8
CMA / ARV
- ARV (median comp)
- $148,239
- List price
- $275,000
- Delta
- 85.51%
- Verdict
- OVERPRICED
- Comps
- 17 within 1.0 mi
Projected returns pro-forma
-3.0% appreciation · 3.0% rent growth · sell at horizon
- IRR
- -16.0%
- Equity multiple
- 0.43×
- Total profit
- $-43,781
- Equity at exit
- $41,003
- IRR
- -7.4%
- Equity multiple
- 0.53×
- Total profit
- $-36,267
- Equity at exit
- $23,777
Cash invested: $77,000 (down + closing). Projections, not guarantees.
Landlord ↔ Tenant lean methodology
- Overall (STATE)
- 90 Strongly Landlord-Friendly
- State Mississippi
- 90 Strongly Landlord-Friendly · R+11
- County
- — inherits STATE
- City
- — inherits STATE
ZIP-level market 39520
- Active inventory
- 622
- Price-to-rent
- 23.3×
Monthly cashflow live
- Estimated rent
- $2,955 medium interval (Pro) →
- Mortgage (P&I)
- −$1,442
- Tax est. 1.5%
- −$344 /mo · $4,125/yr
- Insurance
- −$115
- Flood insurance flood zone
- −$427 /mo · $5,118/yr
- HOA
- −$0
- Vacancy / Maint / Mgmt
- −$621
- Net cashflow
- $7
Break-even live
Sensitivity live
| Price | -10% $197 | -5% $102 | +0% $7 | +5% $-88 | +10% $-183 |
|---|---|---|---|---|---|
| Rent | -10% $-226 | -5% $-109 | +0% $7 | +5% $124 | +10% $241 |
| Rate | -1.0pp $146 | -0.5pp $77 | base $7 | +0.5pp $-64 | +1.0pp $-136 |
3-unit breakdown (identical units grouped — click to expand)
| Units | Beds | Baths | Est. rent |
|---|---|---|---|
| 3× units | 2 | 1 | $2,955 |
| #1 | 2 | 1 | $985 |
| #2 | 2 | 1 | $985 |
| #3 | 2 | 1 | $985 |
| Total (3 units) | $2,955 | ||
UW: 25.0% down · 7.5% · 30yr · 1.5% tax · 5.0% vac · 8.0% maint · 8.0% mgmt
Financing live
Cash to close
- Down payment
- $68,750
- Closing costs
- $8,250
- Reserves months
- —
- Total cash needed
- —
Loan-product check · same deal, 3 products live
Conventional
25% down · 7.5% · 30yr
- Down + closing
- —
- Monthly P&I
- —
- Monthly cashflow
- —
- DSCR
- —
- Eligible?
- —
Personal DTI + credit; lowest rate.
DSCR
20% down · 8.5% · 30yr
- Down + closing
- —
- Monthly P&I
- —
- Monthly cashflow
- —
- DSCR
- —
- Eligible?
- —
No personal income docs; deal must DSCR.
Hard money
10% down · 12.0% · 12mo
- Down + closing
- —
- Monthly P&I
- —
- Monthly cashflow
- —
- DSCR
- —
- Eligible?
- —
Short-term bridge; refi at stabilization.
Listing history 18 events
-
2026-06-21days on market $275,000 Active 256 DOM
-
2026-06-18days on market $275,000 Active 253 DOM
-
2026-06-17days on market $275,000 Active 252 DOM
-
2026-06-16days on market $275,000 Active 251 DOM
-
2026-06-15days on market $275,000 Active 250 DOM
-
2026-06-14days on market $275,000 Active 248 DOM
-
2026-06-13days on market $275,000 Active 247 DOM
-
2026-06-10days on market $275,000 Active 245 DOM
-
2026-06-09days on market $275,000 Active 244 DOM
-
2026-06-08days on market $275,000 Active 243 DOM
-
2026-06-07days on market $275,000 Active 242 DOM
-
2026-06-05days on market $275,000 Active 239 DOM
-
2026-06-03days on market $275,000 Active 238 DOM
-
2026-06-02days on market $275,000 Active 237 DOM
-
2026-06-01days on market $275,000 Active 236 DOM
-
2026-05-31days on market $275,000 Active 235 DOM
-
2026-05-30days on market $275,000 Active 234 DOM
-
2025-10-08$275,000 Active 400-char remark
Show marketing remark (400 chars)
New Construction Double in Bayside Park. Property currently is fully occupied. Each unit has 2 bedrooms and 1 bath with laundry hook ups and an open living/kitchen space giving plenty of room for a dining and living area. Each unit has a separate driveway. Just a few blocks from casinos and beaches. If you are looking for an investment property on the Gulf Coast...This one may be the one for you.
ⓘ Source: listings_history table (triggers on properties + properties_extension) + one-shot
backfill from property_details.listing_events for pre-trigger history.
Climate risk First Street
- Flood 5/10 Major FEMA zone AE · 23% chance over 30 yrs
- Wildfire 6/10 Major
- Heat 10/10 Extreme 7 d/yr ≥107°F today · 21 d/yr by 30 yrs out
- Wind 10/10 Extreme 99% chance of damaging wind over 30 yrs
- Air quality 1/10 Low 0 unhealthy d/yr today · 0 by 30 yrs out
Nearby sold comps map
Loading sold comps map…
Walkable amenities ~0.75 mi
Loading nearby amenities…
Taxation est. · year 1
- Rental income
- $35,460
- − Mortgage interest
- −$15,404
- − Property taxes
- −$4,125
- − Insurance
- −$6,494
- − Repairs & maintenance
- −$2,837
- − Management
- −$2,837
- − Depreciation
- −$8,000
- Taxable loss
- −$4,236
- Est. tax savings @ 24.0%
- +$1,017
- After-tax cash flow
- $1,106/yr
For passive investors: Depreciation is non-cash, so a rental often shows a tax loss while cash-flowing — sheltering income. Rental losses are passive: they offset passive income freely, and up to $25,000/yr can offset ordinary (W-2) income if you actively participate and your MAGI is under $100k (phasing out to $0 by $150k); unused losses carry forward. On sale, claimed depreciation is recaptured at up to 25%, and gains may owe capital-gains tax (a 1031 exchange can defer both). Figures are a year-1 estimate at your 24.0% rate — not tax advice; consult a CPA.
Condition & rehab AI · 11 photos
This multi-family property is in good condition with a cosmetic rehab level, ready for minor updates to enhance its curb appeal and interior aesthetics.
Value-add opportunities
- Both Painting exterior and interior walls — Fresh paint can enhance curb appeal and interior aesthetics.
- Both Landscaping and curb appeal improvements — Enhanced landscaping can improve curb appeal and attract potential buyers/tenants.
- Both HVAC maintenance and tune-up — A well-maintained HVAC system can improve comfort and energy efficiency, attracting more tenants and buyers.
- Both Kitchen and bathroom updates — Modernizing these spaces can increase the home's appeal and value for both buyers and tenants.
Renovation cost estimate screening
Value-add ROI direction
- Both Painting exterior and interior walls — Fresh paint can enhance curb appeal and interior aesthetics. ↑
- Both Landscaping and curb appeal improvements — Enhanced landscaping can improve curb appeal and attract potential buyers/tenants. ↑
- Both HVAC maintenance and tune-up — A well-maintained HVAC system can improve comfort and energy efficiency, attracting more tenants and buyers. ↑
- Both Kitchen and bathroom updates — Modernizing these spaces can increase the home's appeal and value for both buyers and tenants. ↑
ⓘ Cost ranges are severity-bucket heuristics (US national rule-of-thumb). Get contractor quotes + a written scope before underwriting a rehab budget.
Schools (NCES district)
- District
- Hancock County School District
- NCES district ID
- 2801740
- Math proficiency
- 47% ▼ -11.00%
- Reading proficiency
- 44% ▼ -9.00%
- Median HH income
- $47,971
- Composite
- 38.88/100
- National rank
- #4099
- State rank
- #23 of 130 in MS
Livability — Waveland
- Score
- 61/100
- State rank
- #199
- US rank
- #18110
Category grades
Schools grade is shown separately in the Schools card above.
Census & demographics
- City population
- 6,249
- Population (ZIP)
- 15,471
Population outlook (Hancock County) Hauer SSP2
- Today (2025)
- 52,161 people
- By 2030
- 54,753 · +5.0%
- By 2040
- 59,242 · +13.6%
- By 2050
- 62,417 · +19.7%
- By 2075
- 68,168 · +30.7%
- By 2100
- 69,212 · +32.7%
Race, ethnicity, and origin ACS 2023
- Neighborhood character
- Predominantly White (80%)
- Race & ethnicity
- White 80% Black 11% Two or more races 6% Hispanic / Latino 3% Asian 1%
- Common ancestry
- Lithuanian 15% Romanian 2% Serbian 2%
- Foreign-born
- 3% · Canada, China
- Languages at home
- 96% English-only · Spanish 2% Chinese 1%
Political lean MEDSL · Hancock
- 2024 margin
- Solid R (+58.7) · D 20.1% · R 78.8% · Other 1.1%
- 2008→2024 swing
- -4.4pp toward R · 2008: -54.2pp · 2024: -58.7pp
- All cycles
- 2024: R+58.7 2020: R+55.5 2016: R+59.4 2012: R+52.8 2008: R+54.2
Not yet ingested
- Civics
- —
Market trends
- HPI YoY
- ▼ -169.80%
- Current HPI
- 227.2103
- Rent YoY
- —
- Metro
- —
- State GDP YoY
- —
- F500 in state
- 0
Price history
1 event — show timeline
- 2025-10-08 Listed $275,000 MLSU
Cash-flow waterfall
monthlySold comps — $/sqft
last 12 mo · ≤1 miLoading sold comps…