 Duplex
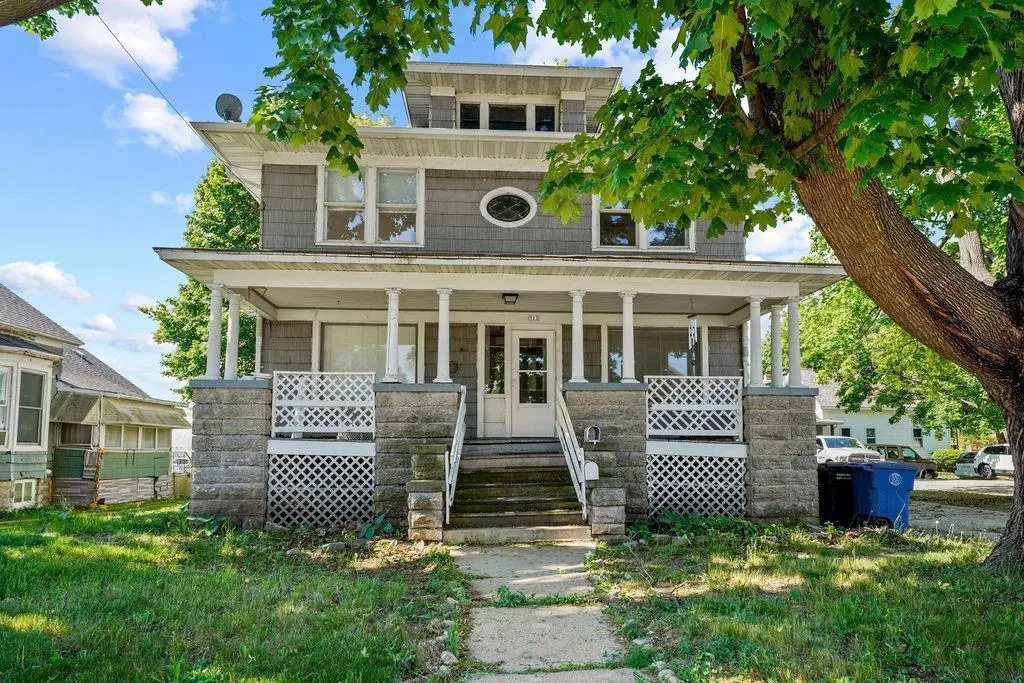
513 Ceape Ave · Oshkosh, WI
Flood risk 1/10 · Minimal
- FEMA flood zone
- X (unshaded)
- Chance of flooding over 30 yrs
- 0.0%
- Est. flood insurance / yr
- $473 – $860
Fire risk 1/10 · Minimal
- Est. fire insurance / yr
- $636 – $1,182
Heat risk 2/10 · Minimal
- Hot days now (above 97°F)
- 7 days/yr
- Hot days in 30 yrs
- 13 days/yr
Wind risk 2/10 · Minimal
- Chance of severe wind over 30 yrs
- —
Air-quality risk 2/10 · Minimal
- Unhealthy air days now
- 1 days/yr
- Unhealthy air days in 30 yrs
- 2 days/yr
Risk factors via First Street. Map © Google.
Why this score? — see what drove the C grade
The composite is a weighted blend of 9 inputs, each scored 0–100. Each bar is that input's sub-score; the figure is the points it added to the 100-point composite (weight × sub-score).
- Cash flow +25.8/30.0
- DSCR +8.7/10.0
- 1% rule +6.9/10.0
- Livability +4.2/5.0
- ARV discount +3.7/15.0
- Rent growth +3.7/5.0
- Schools +2.9/10.0
- Condition / age +2.5/5.0
- Appreciation +0.0/10.0
$199,900
🖨 Deal sheet 📄 Offer letter ✓ Due diligence
Multi-family units
County records classify this as Multi-Family (2-4 Unit). Listing-text estimate: 2 units. confirmed
Listing remarks MLS
Welcome Home! This duplex is located on the North side of Oshkosh. Perfect opportunity for house hackers, or investors looking to add more to their portfolio. The lower unit is beautifully updated! Heating type is boiler heat. This is located within walking distance of Lake Winnebago, perfect for the hot summers! Please allow 24 hour binding acceptance per seller. Upper is month to month.
Key facts
- Boiler heating
- Solid rental history
- Lake winnebago
Tags
Property features AI
Finance
- Other: Two refrigerators and two stoves included; sellers' and tenants' personal property excluded
- Financial info: Property type: Multi-family (2 units)
Exterior
- Parking: Outdoor parking
- Utilities: Municipal water; Municipal sewer; Electric service (implied); Heating fuel listed as other (see remarks)
- Home design: Multi-family duplex; Combination of 2-story and bi-level design; Estimated total livable area range 1,751–2,000
- Construction: Fiber cement siding; Information source for year built: Assessor/Public Record
- Exterior features: Fiber cement exterior; Lot size about 0.16 acres; Zoned for 2-family/duplex residential
Interior
- Kitchen: Unit 2 kitchen approx. 11 x 5; Two stoves and two refrigerators included
- Bedrooms: Each unit has 2 bedrooms; Unit 2 bedroom sizes: Master 12 x 12, Second 12 x 11
- Bathrooms: Each unit has 1 full bathroom
- Heating & cooling: Boiler heating
- Interior features: Full stone basement; Two separate units (duplex)
- Laundry & utility: Boiler heating (fuel: other — see remarks)
Neighborhood map
What this means for you Summary
Snapshot
- This is a 2 × 2-bed/1.0-bath units multifamily listed at $200k.
Deal economics
- At list price, monthly cash flow is $488 ($6k/yr) — positive. Per door: $244/mo.
- The deal already cash-flows at list — no discount required.
- Meets the 1% rule at list price ($2k rent vs $200k).
- Cap rate 9.2% vs local median 3.7% in Oshkosh — top-decile yield for the area; either an underpriced asset or a hidden risk that comps aren't pricing in. Stress-test before assuming the spread holds.
Location & tenants
- Location reads 85/100 on livability (#29 in WI, #574 nationally) — a professional / high-income tenant draw. Strengths: cost of living A+, housing A+, health & safety A+.
- Oshkosh Area School District (urban): math 33% / reading 34% proficiency, ranked #246 of 342 in WI (top 72%) — families likely to look elsewhere, expect single-tenant / working-renter base with shorter leases.
- Market conditions: Rents rising fast (+5.0%/yr); 82 active listings in the ZIP; 16 comparable units currently listed for rent nearby; rentals at typical pace (median 21d on market — plan ~3-4 weeks tenant-placement turnaround); 652 units permitted in Winnebago County in 2024 (333 in 5+ unit buildings).
- At $2,376/mo this rent would consume 46% of the median local household income ($62k/yr) (locally 1484% of renters already pay >50% of income on rent) — very limited rent-growth headroom before tenants either downsize or default.
Forward outlook
- Local home prices are declining (-3.0%/yr); year-one equity from $1k of loan paydown is wiped out by about $6k of value loss. Plan a longer hold.
- Winnebago County population projected at +3% by 2050 — modest demand growth; plan on rents tracking national, not racing it.
- At projected returns (-3.0% appreciation + 5.0% rent growth), your $56k cash investment doubles in ~9 years — after that, you're playing with house money.
Negotiation context
- Only 14 days on market — expect competitive offers; lowballing is unlikely to land.
- 2 sale attempts since 4y ago with the ask held roughly flat each time — persistent listings suggest the price (not the market) is what's stuck; bring a comps-based counter.
- Current owner paid $154k; 30% above their basis — modest negotiation headroom, anchor on the comps not their cost.
Risks & watch-outs
- Watch-outs: built in 1920 — expect roof / HVAC / electrical / plumbing capex.
Questions for the listing agent
- Can we see the unit-by-unit rent roll, current vacancy, and any below-market leases? What's the average tenancy length?
- What capital expenditures (roof, boiler, parking lot, exteriors) have been made in the last 5 years, and what's planned in the next 2?
- Built in 1920 — when were the roof, HVAC, electrical panel, plumbing, and water heater last replaced?
- Is there a deadline driving the sale (1031 exchange, divorce, estate, relocation)? That informs how much negotiation room exists.
- What's the average days-on-market for RENTAL listings here right now (not sales)? A rising rental-DOM trend means longer vacancies and softer asking-rent achievability than the comps imply.
- What's the recent tenant-quality profile in this submarket — average credit score on applications, eviction rate, late-payment / NSF rate, and stable-employment percentage? A property-management company in the area should have these aggregated.
- How much new apartment / multifamily construction is in the pipeline within 1–3 miles? Heavy new supply (>2% of stock underway) typically softens rents 12–24 months out; light construction supports rent growth.
Investment metrics
- 1% rule
- 1.19% ✓
- Cap rate
- 9.22%
- Cash-on-cash
- 10.46%
- DSCR
- 1.47
- GRM
- 7.0
CMA / ARV
- ARV (on-the-fly)
- $184,320
- Comps found
- 11
Show comp detail 11 sales within ~0.75 mi
| Address | Dist | Beds/Ba | Sqft | Sold | Price | $/sf | Match |
|---|---|---|---|---|---|---|---|
| 647 Waugoo Ave | 0.22mi | 4/2.0 | 1,940 (+1%) | 13mo | $176,900 | $91 | 77 |
| 508 Ceape Ave | 0.03mi | 3/2.0 (-1) | 1,800 (-6%) | 10mo | $175,000 | $97 | 75 |
| 701 Otter Ave | 0.21mi | 5/2.0 (+1) | 2,075 (+8%) | 8mo | $200,000 | $96 | 65 |
| 322 Hudson Ave | 0.54mi | 4/2.0 | 1,920 (0%) | 13mo | $200,000 | $104 | 64 |
| 821 E Parkway Ave | 0.63mi | 4/2.0 | 1,820 (-5%) | 12mo | $185,000 | $102 | 52 |
| 348 Bay St | 0.27mi | 3/2.0 (-1) | 1,756 (-8%) | 20mo | $144,900 | $83 | 52 |
| 567 Mt Vernon St | 0.56mi | 4/2.0 | 2,112 (+10%) | 11mo | $183,000 | $87 | 48 |
| 514 Evans St | 0.53mi | 4/2.0 | 1,816 (-5%) | 22mo | $145,000 | $80 | 48 |
| 615 Mt Vernon St | 0.63mi | 3/3.0 (-1) | 2,076 (+8%) | 2mo | $164,000 | $79 | 46 |
| 24 W 11th Ave | 0.51mi | 4/2.0 | 1,764 (-8%) | 23mo | $199,000 | $113 | 44 |
| 644 Boyd St | 0.69mi | 4/2.0 | 2,064 (+8%) | 23mo | $232,000 | $112 | 36 |
Match score weights: distance 35% · size 25% · config 20% · recency 20%. Top-matched comps best support the ARV.
Projected returns pro-forma
-3.0% appreciation · 4.97% rent growth · sell at horizon
- IRR
- 1.6%
- Equity multiple
- 1.06×
- Total profit
- $3,512
- Equity at exit
- $29,806
- IRR
- 13.1%
- Equity multiple
- 2.14×
- Total profit
- $63,736
- Equity at exit
- $17,284
Cash invested: $55,972 (down + closing). Projections, not guarantees.
Landlord ↔ Tenant lean methodology
- Overall (STATE)
- 73 Landlord-Friendly
- State Wisconsin
- 73 Landlord-Friendly · R+2
- County
- — inherits STATE
- City
- — inherits STATE
ZIP-level market 54901
- Rents YoY
- 5.0%
- Active inventory
- 82
- Price-to-rent
- 14.0×
Monthly cashflow live
- Estimated rent
- $2,376 high interval (Pro) →
- Mortgage (P&I)
- −$1,048
- Tax from tax record
- −$258 /mo · $3,093/yr
- Insurance
- −$83
- HOA
- −$0
- Vacancy / Maint / Mgmt
- −$499
- Net cashflow
- $488
Break-even live
2-unit breakdown (identical units grouped — click to expand)
| Units | Beds | Baths | Est. rent |
|---|---|---|---|
| 2× units | 2 | 1 | $2,376 |
| #1 | 2 | 1 | $1,188 |
| #2 | 2 | 1 | $1,188 |
| Total (2 units) | $2,376 | ||
UW: 25.0% down · 7.5% · 30yr · 1.5% tax · 5.0% vac · 8.0% maint · 8.0% mgmt
Financing live
Cash to close
- Down payment
- $49,975
- Closing costs
- $5,997
- Reserves months
- —
- Total cash needed
- —
Loan-product check · same deal, 3 products live
Conventional
25% down · 7.5% · 30yr
- Down + closing
- —
- Monthly P&I
- —
- Monthly cashflow
- —
- DSCR
- —
- Eligible?
- —
Personal DTI + credit; lowest rate.
DSCR
20% down · 8.5% · 30yr
- Down + closing
- —
- Monthly P&I
- —
- Monthly cashflow
- —
- DSCR
- —
- Eligible?
- —
No personal income docs; deal must DSCR.
Hard money
10% down · 12.0% · 12mo
- Down + closing
- —
- Monthly P&I
- —
- Monthly cashflow
- —
- DSCR
- —
- Eligible?
- —
Short-term bridge; refi at stabilization.
Rent comps 16 comps
| Address | Beds | Baths | Sqft | Rent | $/sqft | DOM | Units | Dist |
|---|---|---|---|---|---|---|---|---|
| 1113 Harney Ave Unit 1061625P Oshkosh, WI | 3.0 | 2.0 | 1991 | $3,154 | $1.58 | 13d | 1 | 0.44mi |
| 513 Evans St Unit 1514469P Oshkosh, WI | 3.0 | 1.5 | 1270 | $2,909 | $2.29 | 20d | 1 | 0.50mi |
| 319 E Irving Ave Oshkosh, WI | 3.0 | 1.5 | 1384 | $1,250 | $0.90 | 43d | 1 | 0.74mi |
| 95 Dawes St Oshkosh, WI | 3.0 | 2.0 | 1520 | $1,650 | $1.09 | 43d | 1 | 0.79mi |
| 500 Marion Rd Unit F204 Oshkosh, WI | 4.0 | 2.0 | 1528 | $2,000 | $1.31 | 20d | 1 | 0.83mi |
| 685 Franklin St Unit B Oshkosh, WI | 4.0 | 2.0 | 1721 | $1,700 | $0.99 | 20d | 1 | 0.88mi |
| 306 Wisconsin St Oshkosh, WI | 3.0 | 1.0 | 1500 | $1,500 | $1.00 | 43d | 1 | 0.89mi |
| 306 Wisconsin St Oshkosh, WI | 4.0 | 1.0 | 1500 | $2,000 | $1.33 | 20d | 1 | 0.89mi |
| 728 Franklin St Oshkosh, WI | 5.0 | 1.0 | 1540 | $2,250 | $1.46 | 20d | 1 | 0.94mi |
| 418 W Irving Ave Oshkosh, WI | 4.0 | 1.5 | 1536 | $2,225 | $1.45 | 43d | 1 | 0.95mi |
| 733 Wright St Oshkosh, WI | 5.0 | 2.0 | 1642 | $2,200 | $1.34 | 43d | 1 | 1.02mi |
| 825 Wisconsin St Apt 3A Oshkosh, WI | 4.0 | 1.0 | 1400 | $1,449 | $1.03 | 43d | 1 | 1.14mi |
| 825 Wisconsin St Unit 2C Oshkosh, WI | 4.0 | 1.0 | 1400 | $1,399 | $1.00 | 20d | 1 | 1.14mi |
| 1745 Oregon St Oshkosh, WI | 1.0–3.0 | 1.0–2.0 | 1079 | $1,491 | $1.38 | 13d | 6 | 1.14mi |
| 835 Wisconsin St Unit 2D Oshkosh, WI | 4.0 | 1.0 | 1400 | $1,399 | $1.00 | 20d | 1 | 1.16mi |
| 904 W 8th Ave Oshkosh, WI | 3.0 | 1.0 | 1759 | $1,600 | $0.91 | 13d | 1 | 1.43mi |
Listing history 12 events
-
2026-06-19days on market $199,900 Active 14 DOM
-
2026-06-18days on market $199,900 Active 13 DOM
-
2026-06-17days on market $199,900 Active 12 DOM
-
2026-06-16days on market $199,900 Active 11 DOM
-
2026-06-15days on market $199,900 Active 10 DOM
-
2026-06-14days on market $199,900 Active 8 DOM
-
2026-06-13days on market $199,900 Active 7 DOM
-
2026-06-10days on market $199,900 Active 5 DOM
-
2026-06-09days on market $199,900 Active 4 DOM
-
2026-06-08days on market $199,900 Active 3 DOM
-
2026-06-07remarks 479-char remark
-
2026-06-07$199,900 Active 2 DOM
ⓘ Source: listings_history table (triggers on properties + properties_extension) + one-shot
backfill from property_details.listing_events for pre-trigger history.
Tax reassessment forecast WI · Partial reset (capped growth)
- Current annual tax
- $3,093 · $258/mo
- Projected year-2 tax
- $3,396 · $283/mo
- Expected delta
- +$303/yr (+$25/mo · 9.8%)
ⓘ Screening estimate from a state-policy table — verify with the county assessor before closing.
Climate risk First Street
- Flood 1/10 Low FEMA zone X (unshaded) · 0% chance over 30 yrs
- Wildfire 1/10 Low
- Heat 2/10 Low 7 d/yr ≥97°F today · 13 d/yr by 30 yrs out
- Wind 2/10 Low
- Air quality 2/10 Low 1 unhealthy d/yr today · 2 by 30 yrs out
Nearby sold comps map
Loading sold comps map…
Walkable amenities ~0.75 mi
Loading nearby amenities…
Taxation est. · year 1
- Rental income
- $28,512
- − Mortgage interest
- −$11,198
- − Property taxes
- −$3,093
- − Insurance
- −$1,000
- − Repairs & maintenance
- −$2,281
- − Management
- −$2,281
- − Depreciation
- −$5,815
- Taxable income
- $2,845
- Est. tax owed @ 24.0%
- −$683
- After-tax cash flow
- $5,170/yr
For passive investors: Depreciation is non-cash, so a rental often shows a tax loss while cash-flowing — sheltering income. Rental losses are passive: they offset passive income freely, and up to $25,000/yr can offset ordinary (W-2) income if you actively participate and your MAGI is under $100k (phasing out to $0 by $150k); unused losses carry forward. On sale, claimed depreciation is recaptured at up to 25%, and gains may owe capital-gains tax (a 1031 exchange can defer both). Figures are a year-1 estimate at your 24.0% rate — not tax advice; consult a CPA.
Schools (NCES district)
- District
- Oshkosh Area School District
- NCES district ID
- 5511190
- Math proficiency
- 33% ▼ -7.00%
- Reading proficiency
- 34% ▼ -2.00%
- Median HH income
- $48,048
- Composite
- 28.92/100
- National rank
- #6634
- State rank
- #246 of 342 in WI
Livability — Oshkosh
- Score
- 85/100
- State rank
- #29
- US rank
- #574
Category grades
Schools grade is shown separately in the Schools card above.
Census & demographics
- Census place
- Oshkosh, WI
- County
- Winnebago County · 155,689 people
- City population
- 81,810
- Metro
- Oshkosh-Neenah, WI
- Population (ZIP)
- 37,294
- Household income
- $61,794
- Rent vs Own
- Severe rent burden
- 1484.0
Population outlook (Winnebago County) Hauer SSP2
- Today (2025)
- 175,480 people
- By 2030
- 177,928 · +1.4%
- By 2040
- 180,873 · +3.1%
- By 2050
- 181,302 · +3.3%
- By 2075
- 184,071 · +4.9%
- By 2100
- 175,932 · +0.3%
Race, ethnicity, and origin ACS 2023
- Neighborhood character
- Predominantly White (80%)
- Race & ethnicity
- White 80% Black 6% Hispanic / Latino 6% Two or more races 5% Asian 4%
- Hispanic origin (detail)
- Mexican 3% Puerto Rican 2%
- Common ancestry
- Romanian 6% Portuguese 4% Lithuanian 2%
- Foreign-born
- 4% · Canada
- Languages at home
- 93% English-only · Other Asian/Pacific 2% Spanish 2% Arabic 1%
Political lean MEDSL · Winnebago
- 2024 margin
- Toss-up / Even · D 46.9% · R 51.7% · Other 1.4%
- 2008→2024 swing
- -16.4pp toward R · 2008: 11.7pp · 2024: -4.8pp
- All cycles
- 2024: R+4.8 2020: R+4.0 2016: R+7.4 2012: D+3.8 2008: D+11.7
Not yet ingested
- Civics
- —
Market trends
- HPI YoY
- ▼ -128.12%
- Current HPI
- 187.7253
- Rent YoY
- ▲ 4.97%
- Metro
- Oshkosh-Neenah, WI
- State GDP YoY
- ▲ 2.10%
- F500 in state
- 20
Industry mix (Fortune 500 HQ in WI)
| Industry | F500 HQs | Revenue |
|---|---|---|
| Industrial Machinery | 4 | $23B |
|
||
| Industrial Technology | 2 | $36B |
|
||
| Insurance | 1 | $36B |
|
||
| Professional Services | 1 | $19B |
|
||
| Utilities | 1 | $9B |
|
||
| Consumer Goods | 1 | $3B |
|
||
Price history
+174.6% since first listed6 events — show timeline
- 2026-06-04 Listed $199,900 RANW
- 2023-03-13 Sold (Public Records) $154,000 Public Records
- 2023-01-20 Listing Removed — RANW
- 2022-12-20 Listed $169,000 RANW
- 2015-12-02 Sold (Public Records) $192,680 Public Records
- 2012-03-02 Sold (Public Records) $72,800 Public Records
Property tax history
+3.0%/yrLatest (2024): $3,093 · +23.3% YoY. Source: county tax records.
Cash-flow waterfall
monthlySold comps — $/sqft
last 12 mo · ≤1 miLoading sold comps…