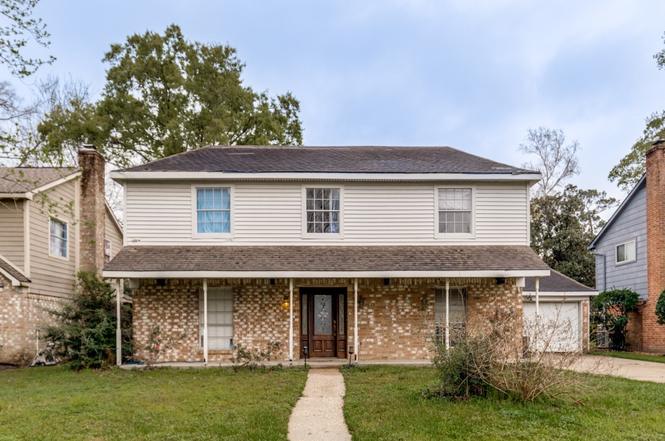
5415 Timbers Trail Dr · Atascocita, TX
Flood risk 1/10 · Minimal
- FEMA flood zone
- X (unshaded)
- Chance of flooding over 30 yrs
- 0.0%
- Est. flood insurance / yr
- $507 – $1,088
Fire risk 1/10 · Minimal
- Est. fire insurance / yr
- $1,222 – $2,270
Heat risk 8/10 · Major
- Hot days now (above 110°F)
- 6 days/yr
- Hot days in 30 yrs
- 19 days/yr
Wind risk 9/10 · Severe
- Chance of severe wind over 30 yrs
- 99.0%
Air-quality risk 3/10 · Minor
- Unhealthy air days now
- 3 days/yr
- Unhealthy air days in 30 yrs
- 3 days/yr
Risk factors via First Street. Map © Google.
Why this score? — see what drove the B grade
The composite is a weighted blend of 9 inputs, each scored 0–100. Each bar is that input's sub-score; the figure is the points it added to the 100-point composite (weight × sub-score).
- Cash flow +25.0/30.0
- ARV discount +15.0/15.0
- 1% rule +8.4/10.0
- DSCR +8.2/10.0
- Appreciation +4.5/10.0
- Schools +3.9/10.0
- Livability +3.5/5.0
- Rent growth +2.5/5.0
- Condition / age +2.5/5.0
$205,000
🖨 Deal sheet 📄 Offer letter ✓ Due diligence
Listing remarks MLS
home with beautiful updates. Travertine fireplace surround, new wood flooring downstairs, new carpet upstairs, and fresh modern paint throughout. Enjoy the freshly landscaped front yard and nice fenced in backyard, great for family leisure time and entertaining.
Key facts
- Covered front porch
- Wood floors
- Granite countertops
Tags
Neighborhood map
What this means for you Summary
Snapshot
- This is a 4-bed/2.5-bath single-family listed at $205k.
Deal economics
- At list price, monthly cash flow is $449 ($5k/yr) — positive.
- The deal already cash-flows at list — no discount required.
- Meets the 1% rule at list price ($3k rent vs $205k).
- Recommended offer: $202k (1.5% below list) — sets the bar for market timing.
- Cap rate 8.9% vs local median 4.1% in Atascocita — top-decile yield for the area; either an underpriced asset or a hidden risk that comps aren't pricing in. Stress-test before assuming the spread holds.
Location & tenants
- Location reads 70/100 on livability (#346 in TX) — a middle-class / working-renter tenant base. Strengths: employment A+, cost of living A+, housing A+; Watch: amenities F, commute F, health & safety F.
- Humble ISD (urban): math 38% / reading 44% proficiency, ranked #262 of 826 in TX (top 32%) — families likely to look elsewhere, expect single-tenant / working-renter base with shorter leases.
- Zoned schools: Timberwood Middle (math 31% / reading 46%, grade F, #704 of 1,662 statewide, top 43%, 1,094 students, 54% FRL); Atascocita H S (math 41% / reading 52%, grade D-, #621 of 1,632 statewide, top 38%, 3,829 students, 42% FRL) — zoned schools average 48% FRL vs 32% district-wide (16 pts higher); higher-poverty schools than district average — tighter screening recommended.
- Market conditions: Rents flat; 669 active listings in the ZIP; 12 comparable units currently listed for rent nearby; rentals lingering (median 44d on market — plan ~5-8 weeks vacancy on turnover, expect pricing pressure); 50% of comp listings sitting > 30 days — soft ceiling on asking rent; high-income renter base; 29,883 units permitted in Harris County in 2024 (8,621 in 5+ unit buildings).
Forward outlook
- Local home prices are declining (-0.9%/yr); year-one equity from $1k of loan paydown is wiped out by about $2k of value loss. Plan a longer hold.
- Harris County population projected at +47% by 2050 — long-run rental-demand tailwind backs the buy-and-hold thesis.
Negotiation context
- It's been on market 26 days — a 2% lower offer ($202k) is reasonable based on typical stale-listing flexibility.
- 12 sale attempts since 23y ago with the ask held roughly flat each time — persistent listings suggest the price (not the market) is what's stuck; bring a comps-based counter.
- Current owner paid $104k; list at $205k implies a 97% gain — meaningful room to come down on a strong offer.
Risks & watch-outs
- Watch-outs: property tax is 3.0% of price.
- Climate carrying-cost: severe wind risk, 99% chance of damaging wind over 30y; extreme-heat days projected 6→19/yr by 2055 (HVAC capex compounding) — expect insurance premiums to compound above CPI over the hold.
Questions for the listing agent
- Built in 1978 — when were the roof, HVAC, electrical panel, plumbing, and water heater last replaced?
- Property tax is high relative to price — has the assessment been appealed recently, and will the sale trigger a re-assessment?
- What does the HOA fee cover, when was the last increase, and are there any pending special assessments or reserve-fund shortfalls?
- Is there a deadline driving the sale (1031 exchange, divorce, estate, relocation)? That informs how much negotiation room exists.
- What's the average days-on-market for RENTAL listings here right now (not sales)? A rising rental-DOM trend means longer vacancies and softer asking-rent achievability than the comps imply.
- What's the recent tenant-quality profile in this submarket — average credit score on applications, eviction rate, late-payment / NSF rate, and stable-employment percentage? A property-management company in the area should have these aggregated.
- How much new for-sale + rental construction is in the pipeline within 1–3 miles? Heavy new supply typically softens prices + rents 12–24 months out; constrained supply supports both.
Investment metrics
- 1% rule
- 1.34% ✓
- Cap rate
- 8.92%
- Cash-on-cash
- 9.39%
- DSCR
- 1.42
- GRM
- 6.2
CMA / ARV
- ARV (on-the-fly)
- $276,624
- Comps found
- 12
Show comp detail 12 sales within ~0.75 mi
| Address | Dist | Beds/Ba | Sqft | Sold | Price | $/sf | Match |
|---|---|---|---|---|---|---|---|
| 5606 Timbers Trail Dr | 0.18mi | 4/2.5 | 2,498 (+2%) | 1mo | $255,000 | $102 | 88 |
| 5502 Moosewood Ct | 0.10mi | 4/2.5 | 2,531 (+3%) | 3mo | $315,000 | $124 | 88 |
| 19518 Alinawood Dr | 0.21mi | 4/2.5 | 2,634 (+8%) | 1mo | $265,000 | $101 | 77 |
| 19510 Alinawood Dr | 0.22mi | 4/2.5 | 2,604 (+6%) | 3mo | $269,900 | $104 | 77 |
| 5527 Enchanted Timbers Dr | 0.36mi | 4/2.5 | 2,348 (-4%) | 1mo | $279,900 | $119 | 75 |
| 19311 Forest Fern Ct | 0.29mi | 4/2.5 | 2,276 (-7%) | 0mo | $299,900 | $132 | 75 |
| 5706 Upper Lake Dr | 0.25mi | 4/2.5 | 2,667 (+9%) | 1mo | $285,000 | $107 | 72 |
| 5726 Green Timbers Dr | 0.54mi | 4/2.5 | 2,592 (+6%) | 1mo | $249,999 | $96 | 65 |
| 5811 Forest Timbers Dr | 0.55mi | 4/2.5 | 2,292 (-6%) | 1mo | $264,500 | $115 | 63 |
| 20107 Bambiwoods Dr | 0.64mi | 4/2.5 | 2,348 (-4%) | 3mo | $237,000 | $101 | 61 |
| 20803 Oak Preserve Dr | 0.53mi | 4/2.5 | 2,663 (+9%) | 3mo | $300,000 | $113 | 58 |
| 19402 Kacey Lane Ct | 0.60mi | 4/2.5 | 2,793 (+14%) | 2mo | $318,550 | $114 | 46 |
Match score weights: distance 35% · size 25% · config 20% · recency 20%. Top-matched comps best support the ARV.
Projected returns pro-forma
-0.95% appreciation · 0.09% rent growth · sell at horizon
- IRR
- 2.4%
- Equity multiple
- 1.10×
- Total profit
- $6,019
- Equity at exit
- $49,936
- IRR
- 6.0%
- Equity multiple
- 1.52×
- Total profit
- $29,896
- Equity at exit
- $52,822
Cash invested: $57,400 (down + closing). Projections, not guarantees.
Landlord ↔ Tenant lean methodology
- Overall (STATE)
- 87 Strongly Landlord-Friendly
- State Texas
- 87 Strongly Landlord-Friendly · R+5
- County
- — inherits STATE
- City
- — inherits STATE
ZIP-level market 77346
- Home prices YoY
- -0.4%
- Rents YoY
- 0.1%
- Active inventory
- 669
- Price-to-rent
- 6.2×
Monthly cashflow live
- Estimated rent
- $2,747 high interval (Pro) →
- Mortgage (P&I)
- −$1,075
- Tax from tax record
- −$514 /mo · $6,173/yr
- Insurance
- −$85
- HOA
- −$46
- Vacancy / Maint / Mgmt
- −$577
- Net cashflow
- $449
Break-even live
UW: 25.0% down · 7.5% · 30yr · 1.5% tax · 5.0% vac · 8.0% maint · 8.0% mgmt
Financing live
Cash to close
- Down payment
- $51,250
- Closing costs
- $6,150
- Reserves months
- —
- Total cash needed
- —
Loan-product check · same deal, 3 products live
Conventional
25% down · 7.5% · 30yr
- Down + closing
- —
- Monthly P&I
- —
- Monthly cashflow
- —
- DSCR
- —
- Eligible?
- —
Personal DTI + credit; lowest rate.
DSCR
20% down · 8.5% · 30yr
- Down + closing
- —
- Monthly P&I
- —
- Monthly cashflow
- —
- DSCR
- —
- Eligible?
- —
No personal income docs; deal must DSCR.
Hard money
10% down · 12.0% · 12mo
- Down + closing
- —
- Monthly P&I
- —
- Monthly cashflow
- —
- DSCR
- —
- Eligible?
- —
Short-term bridge; refi at stabilization.
Rent comps 12 comps
| Address | Beds | Baths | Sqft | Rent | $/sqft | DOM | Units | Dist |
|---|---|---|---|---|---|---|---|---|
| 19322 Forest Fern Ct Humble, TX | 4.0 | 2.5 | 2626 | $3,500 | $1.33 | 43d | 1 | 0.22mi |
| 20143 Dawn Mist Dr Humble, TX | 3.0 | 2.5 | 1617 | $1,659 | $1.03 | 43d | 1 | 0.67mi |
| 5303 Hill Timbers Dr Humble, TX | 3.0 | 2.0 | 1884 | $2,050 | $1.09 | 43d | 1 | 0.83mi |
| 20914 Lake Park Trl Humble, TX | 5.0 | 2.5 | 2462 | $2,460 | $1.00 | 5d | 1 | 1.02mi |
| 6519 Kings Glen Dr Humble, TX | 1.0–3.0 | 1.0–2.5 | 1255 | $2,813 | $2.24 | 1d | 16 | 1.05mi |
| 20906 Greenfield Trl Humble, TX | 4.0 | 3.0 | 2603 | $2,200 | $0.85 | 43d | 1 | 1.06mi |
| 20823 Water Point Trl Humble, TX | 4.0 | 3.5 | 2550 | $2,525 | $0.99 | 22d | 1 | 1.13mi |
| 20618 Carmine Oak Ct Humble, TX | 3.0 | 2.0 | 2087 | $2,195 | $1.05 | 43d | 1 | 1.22mi |
| 20707 Redbud Trl Humble, TX | 3.0 | 2.5 | 1965 | $2,450 | $1.25 | 22d | 1 | 1.27mi |
| 18406 S Roaring River Ct Humble, TX | 4.0 | 4.0 | 3319 | $3,600 | $1.08 | 43d | 1 | 1.36mi |
| 6731 Auburn Oak Trl Humble, TX | 3.0 | 2.5 | 2433 | $2,345 | $0.96 | 22d | 1 | 1.38mi |
| 18810 Woodbreeze Dr Humble, TX | 4.0 | 2.5 | 2200 | $2,279 | $1.04 | 24d | 1 | 1.45mi |
HOA detail
- Monthly dues
- $46 · $552/yr
Listing history 43 events
-
2026-04-05status Pending
-
2026-03-10$205,000 Active
-
2025-10-03status Active
-
2025-07-28historical
-
2025-06-24status Pending
-
2025-04-18status Pending
-
2025-03-05price $219,000
-
2025-02-18price $225,000
-
2025-02-07price $233,000
-
2025-01-29$243,000 Active
-
2019-05-14soldstatus
-
2019-05-09soldstatus Sold 262-char remark
Show marketing remark (262 chars)
home with beautiful updates. Travertine fireplace surround, new wood flooring downstairs, new carpet upstairs, and fresh modern paint throughout. Enjoy the freshly landscaped front yard and nice fenced in backyard, great for family leisure time and entertaining.
-
2019-04-01status Pending 262-char remark
Show marketing remark (262 chars)
home with beautiful updates. Travertine fireplace surround, new wood flooring downstairs, new carpet upstairs, and fresh modern paint throughout. Enjoy the freshly landscaped front yard and nice fenced in backyard, great for family leisure time and entertaining.
-
2019-03-06$199,000 Active 262-char remark
Show marketing remark (262 chars)
home with beautiful updates. Travertine fireplace surround, new wood flooring downstairs, new carpet upstairs, and fresh modern paint throughout. Enjoy the freshly landscaped front yard and nice fenced in backyard, great for family leisure time and entertaining.
-
2019-03-03historical
-
2019-02-07price $189,900
-
2019-01-24$199,000 Active
-
2019-01-21historical
-
2019-01-10price $204,000
-
2019-01-10status Active
-
2018-12-19price $199,000
-
2018-12-19status Pending
-
2018-12-19status Active
-
2018-11-23status Pending
-
2018-11-12status Option Pending
-
2018-10-30price $189,000
-
2018-10-11$199,000 Active
-
2018-08-20soldstatus
-
2018-08-16soldstatus Sold
-
2018-08-06status Pending
-
2018-08-04status Active
-
2018-08-04status Pending
-
2018-07-20status Option Pending
-
2018-07-05price $169,775
-
2018-07-05$195,777 Active
-
2018-07-04historical
-
2018-05-31price $195,777
-
2018-04-20$199,770 Active
-
2004-08-16soldstatus
-
2004-03-30historical
-
2003-12-08$125,900
-
1999-10-01soldstatus
-
1999-09-01soldstatus $104,000
ⓘ Source: listings_history table (triggers on properties + properties_extension) + one-shot
backfill from property_details.listing_events for pre-trigger history.
Tax reassessment forecast TX · Resets to sale price
- Current annual tax
- $6,173 · $514/mo
- Projected year-2 tax
- $6,173 · $514/mo
- Expected delta
- $0/yr ($0/mo · 0.0%)
ⓘ Screening estimate from a state-policy table — verify with the county assessor before closing.
Climate risk First Street
- Flood 1/10 Low FEMA zone X (unshaded) · 0% chance over 30 yrs
- Wildfire 1/10 Low
- Heat 8/10 Severe 6 d/yr ≥110°F today · 19 d/yr by 30 yrs out
- Wind 9/10 Extreme 99% chance of damaging wind over 30 yrs
- Air quality 3/10 Moderate 3 unhealthy d/yr today · 3 by 30 yrs out
Nearby sold comps map
Loading sold comps map…
Walkable amenities ~0.75 mi
Loading nearby amenities…
Taxation est. · year 1
- Rental income
- $32,965
- − Mortgage interest
- −$11,483
- − Property taxes
- −$6,173
- − Insurance
- −$1,025
- − Repairs & maintenance
- −$2,637
- − Management
- −$2,637
- − HOA
- −$552
- − Depreciation
- −$5,964
- Taxable income
- $2,494
- Est. tax owed @ 24.0%
- −$599
- After-tax cash flow
- $4,793/yr
For passive investors: Depreciation is non-cash, so a rental often shows a tax loss while cash-flowing — sheltering income. Rental losses are passive: they offset passive income freely, and up to $25,000/yr can offset ordinary (W-2) income if you actively participate and your MAGI is under $100k (phasing out to $0 by $150k); unused losses carry forward. On sale, claimed depreciation is recaptured at up to 25%, and gains may owe capital-gains tax (a 1031 exchange can defer both). Figures are a year-1 estimate at your 24.0% rate — not tax advice; consult a CPA.
Schools (NCES district)
- District
- Humble ISD
- NCES district ID
- 4823910
- Math proficiency
- 38% ▼ -11.00%
- Reading proficiency
- 44% ▼ -7.00%
- Median HH income
- $83,946
- Composite
- 38.55/100
- National rank
- #4171
- State rank
- #262 of 826 in TX
Livability — Atascocita
- Score
- 70/100
- State rank
- #346
- US rank
- #7586
Category grades
Schools grade is shown separately in the Schools card above.
Census & demographics
- Census place
- Atascocita, TX
- County
- Harris County · 4,702,590 people
- City population
- 79,538
- Metro
- Houston-The Woodlands-Sugar Land, TX
- Population (ZIP)
- 79,538
- Household income
- $122,241
- Rent vs Own
- Severe rent burden
- 1072.0
Population outlook (Harris County) Hauer SSP2
- Today (2025)
- 5,571,493 people
- By 2030
- 6,089,821 · +9.3%
- By 2040
- 7,142,806 · +28.2%
- By 2050
- 8,185,864 · +46.9%
- By 2075
- 10,574,329 · +89.8%
- By 2100
- 12,109,958 · +117.4%
Race, ethnicity, and origin ACS 2023
- Neighborhood character
- Diverse neighborhood (Simpson 0.70)
- Race & ethnicity
- White 42% Hispanic / Latino 28% Black 21% Two or more races 18% Asian 4%
- Hispanic origin (detail)
- Mexican 20% Puerto Rican 2%
- Common ancestry
- Lithuanian 4% Slovak 1% Italian 1%
- Foreign-born
- 10% · Canada, Vietnam, China
- Languages at home
- 78% English-only · Spanish 17% Other Indo-European 1% German/W. Germanic 1%
Political lean MEDSL · Harris
- 2024 margin
- Lean D (+5.5) · D 52.0% · R 46.4% · Other 1.6%
- 2008→2024 swing
- +3.9pp toward D · 2008: 1.6pp · 2024: 5.5pp
- All cycles
- 2024: D+5.5 2020: D+13.3 2016: D+12.4 2012: D+0.1 2008: D+1.6
Not yet ingested
- Civics
- —
Market trends
- HPI YoY
- ▼ -0.95%
- Current HPI
- 218.0478
- Rent YoY
- ▲ 0.09%
- Metro
- Houston-The Woodlands-Sugar Land, TX
- State GDP YoY
- ▲ 3.95%
- F500 in state
- 110
Industry mix (Fortune 500 HQ in TX)
| Industry | F500 HQs | Revenue |
|---|---|---|
| Energy | 16 | $1,198B |
|
||
| Technology | 5 | $198B |
|
||
| Engineering / Construction | 4 | $72B |
|
||
| Energy Services | 3 | $60B |
|
||
| Utilities | 3 | $41B |
|
||
| Healthcare | 2 | $330B |
|
||
Price history
+97.1% since first listed43 events — show timeline
- 2026-04-05 Pending — HARMLS
- 2026-03-10 Listed $205,000 HARMLS
- 2025-10-03 Relisted — HARMLS
- 2025-07-28 Listing Removed — HARMLS
- 2025-06-24 Pending — HARMLS
- 2025-04-18 Pending — HARMLS
- 2025-03-05 Price Changed $219,000 HARMLS
- 2025-02-18 Price Changed $225,000 HARMLS
- 2025-02-07 Price Changed $233,000 HARMLS
- 2025-01-29 Listed $243,000 HARMLS
- 2019-05-14 Sold (Public Records) — Public Records
- 2019-05-09 Sold (MLS) — HARMLS
- 2019-04-01 Pending — HARMLS
- 2019-03-06 Listed $199,000 HARMLS
- 2019-03-03 Listing Removed — HARMLS
- 2019-02-07 Price Changed $189,900 HARMLS
- 2019-01-24 Listed $199,000 HARMLS
- 2019-01-21 Listing Removed — HARMLS
- 2019-01-10 Price Changed $204,000 HARMLS
- 2019-01-10 Relisted — HARMLS
- 2018-12-19 Price Changed $199,000 HARMLS
- 2018-12-19 Pending — HARMLS
- 2018-12-19 Relisted — HARMLS
- 2018-11-23 Pending — HARMLS
- 2018-11-12 Pending — HARMLS
- 2018-10-30 Price Changed $189,000 HARMLS
- 2018-10-11 Listed $199,000 HARMLS
- 2018-08-20 Sold (Public Records) — Public Records
- 2018-08-16 Sold (MLS) — HARMLS
- 2018-08-06 Pending — HARMLS
- 2018-08-04 Relisted — HARMLS
- 2018-08-04 Pending — HARMLS
- 2018-07-20 Pending — HARMLS
- 2018-07-05 Price Changed $169,775 HARMLS
- 2018-07-05 Listed $195,777 HARMLS
- 2018-07-04 Listing Removed — HARMLS
- 2018-05-31 Price Changed $195,777 HARMLS
- 2018-04-20 Listed $199,770 HARMLS
- 2004-08-16 Sold (Public Records) — Public Records
- 2004-03-30 Listing Removed — HARMLS
- 2003-12-08 Listed $125,900 HARMLS
- 1999-10-01 Sold (Public Records) — Public Records
- 1999-09-01 Sold (Public Records) $104,000 Public Records
Property tax history
+2.6%/yrLatest (2025): $6,173 · +1.3% YoY. Source: county tax records.
Cash-flow waterfall
monthlySold comps — $/sqft
last 12 mo · ≤1 miLoading sold comps…