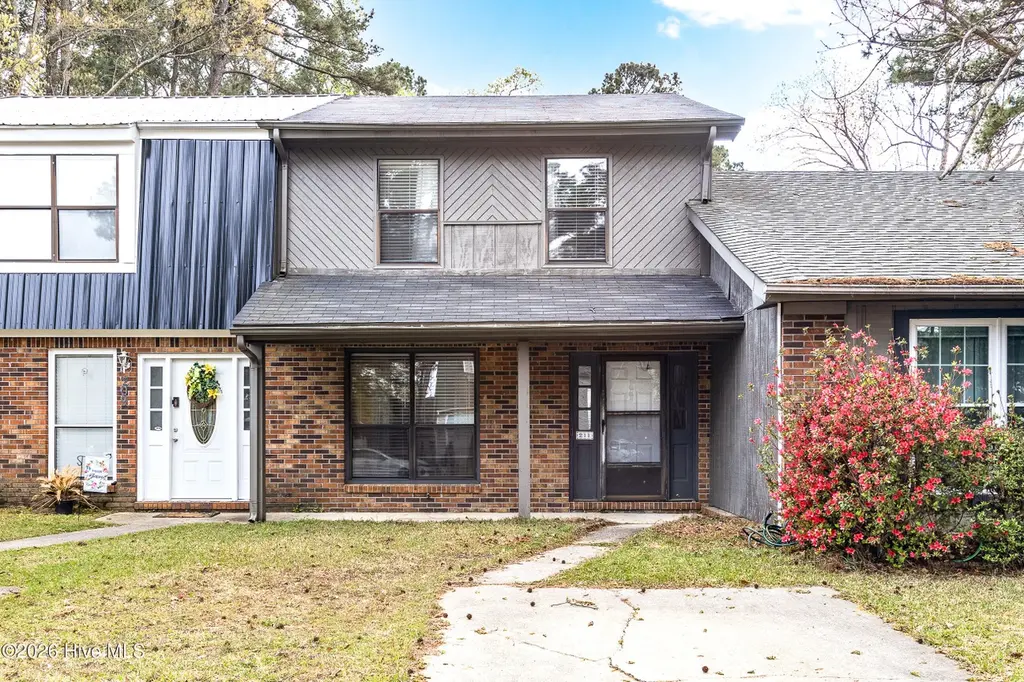
211 Bracken Pl · Jacksonville, NC
Flood risk 1/10 · Minimal
- FEMA flood zone
- X (unshaded)
- Chance of flooding over 30 yrs
- 0.0%
- Est. flood insurance / yr
- $507 – $1,088
Fire risk 4/10 · Minor
- Est. fire insurance / yr
- $906 – $1,684
Heat risk 9/10 · Severe
- Hot days now (above 107°F)
- 7 days/yr
- Hot days in 30 yrs
- 18 days/yr
Wind risk 8/10 · Major
- Chance of severe wind over 30 yrs
- 98.0%
Air-quality risk 3/10 · Minor
- Unhealthy air days now
- 2 days/yr
- Unhealthy air days in 30 yrs
- 3 days/yr
Risk factors via First Street. Map © Google.
Why this score? — see what drove the D grade
The composite is a weighted blend of 9 inputs, each scored 0–100. Each bar is that input's sub-score; the figure is the points it added to the 100-point composite (weight × sub-score).
- Cash flow +13.1/30.0
- ARV discount +7.4/15.0
- DSCR +3.9/10.0
- Schools +3.9/10.0
- Rent growth +3.6/5.0
- Livability +3.6/5.0
- 1% rule +2.9/10.0
- Condition / age +2.5/5.0
- Appreciation +0.0/10.0
$168,000
🖨 Deal sheet 📄 Offer letter ✓ Due diligence
Listing remarks MLS
Perfect starter home or investment property. 2 Bed 1 1/2 bath townhome is conveniently located in Jacksonville. Located near Camp Lejeune, MCAS, restaurants, schools, entertainment and more. New roof in 2021.
Key facts
- Patio area
- Fenced in backyard
- Seamless flow
Tags
Neighborhood map
What this means for you Summary
Snapshot
- This is a 2-bed/1.5-bath townhouse listed at $168k.
Deal economics
- At list price, monthly cash flow is $-6 ($-67/yr) — negative.
- To cash-flow at today's rent, offer at most $167k (0.6% below list).
- To meet the 1% rule (rent ≥ 1% of price), the offer needs to be $133k (20.8% below list).
- Recommended offer: $133k (20.8% below list) — sets the bar for 1% rule.
- Cap rate 6.3% vs local median 4.4% in Jacksonville — top-decile yield for the area; either an underpriced asset or a hidden risk that comps aren't pricing in. Stress-test before assuming the spread holds.
Location & tenants
- Location reads 71/100 on livability (#111 in NC) — a middle-class / working-renter tenant base. Strengths: cost of living A+, housing A+, health & safety A+; Watch: employment D, crime F, amenities F.
- Onslow County Schools (other): math 42% / reading 49% proficiency, ranked #84 of 178 in NC (top 47%) — families likely to look elsewhere, expect single-tenant / working-renter base with shorter leases.
- Zoned schools: Northwoods Elementary (math 42% / reading 47%, grade F, #574 of 1,410 statewide, top 43%, 351 students, 69% FRL); Northwoods Park Middle (math 34% / reading 46%, grade F, #222 of 475 statewide, top 49%, 688 students, 52% FRL); Jacksonville High (math 52% / reading 66%, grade C+, #233 of 535 statewide, top 44%, 1,423 students, 44% FRL) — zoned schools average 55% FRL vs 37% district-wide (18 pts higher); higher-poverty schools than district average — tighter screening recommended.
- Market conditions: Rents rising fast (+4.5%/yr); 380 active listings in the ZIP; 14 comparable units currently listed for rent nearby; rentals at typical pace (median 21d on market — plan ~3-4 weeks tenant-placement turnaround); 1,246 units permitted in Onslow County in 2024 (0 in 5+ unit buildings).
Forward outlook
- Local home prices are declining (-3.0%/yr); year-one equity from $1k of loan paydown is wiped out by about $5k of value loss. Plan a longer hold.
Negotiation context
- It's been on market 17 days — a 2% lower offer ($165k) is reasonable based on typical stale-listing flexibility.
- 3 sale attempts since 5y ago with the ask held roughly flat each time — persistent listings suggest the price (not the market) is what's stuck; bring a comps-based counter.
Risks & watch-outs
- Climate carrying-cost: severe wind risk, 98% chance of damaging wind over 30y; extreme-heat days projected 7→18/yr by 2055 (HVAC capex compounding) — expect insurance premiums to compound above CPI over the hold.
Questions for the listing agent
- What do current leases actually rent for vs. the listed asking? Can we see a recent rent roll and the last 12 months of T-12 income?
- Built in 1979 — when were the roof, HVAC, electrical panel, plumbing, and water heater last replaced?
- Is there a deadline driving the sale (1031 exchange, divorce, estate, relocation)? That informs how much negotiation room exists.
- Crime grade is F in this area — have there been break-ins, vandalism, or insurance claims at this property in the last 3 years? What carrier currently insures it and at what premium?
- The area grade is low — what's the realistic commute time and amenity access for the typical tenant pool here? Any planned neighborhood developments (good or bad) we should know about?
- What's the average days-on-market for RENTAL listings here right now (not sales)? A rising rental-DOM trend means longer vacancies and softer asking-rent achievability than the comps imply.
- What's the recent tenant-quality profile in this submarket — average credit score on applications, eviction rate, late-payment / NSF rate, and stable-employment percentage? A property-management company in the area should have these aggregated.
- How much new for-sale + rental construction is in the pipeline within 1–3 miles? Heavy new supply typically softens prices + rents 12–24 months out; constrained supply supports both.
Investment metrics
- 1% rule
- 0.79% ✗
- Cap rate
- 6.25%
- Cash-on-cash
- -0.14%
- DSCR
- 0.99
- GRM
- 10.5
CMA / ARV
- ARV (on-the-fly)
- $167,640
- Comps found
- 6
Show comp detail 6 sales within ~0.75 mi
| Address | Dist | Beds/Ba | Sqft | Sold | Price | $/sf | Match |
|---|---|---|---|---|---|---|---|
| 110 Greenford Pl | 0.04mi | 2/2.0 | 1,304 (-1%) | 10mo | $178,000 | $137 | 86 |
| 208 Bracken Pl | 0.03mi | 2/1.5 | 1,468 (+11%) | 23mo | $180,000 | $123 | 60 |
| 114 N Onsville Pl | 0.60mi | 2/1.5 | 1,241 (-6%) | 3mo | $158,000 | $127 | 59 |
| 119 N Onsville Pl | 0.58mi | 2/1.5 | 1,256 (-5%) | 8mo | $160,000 | $127 | 58 |
| 120 N Onsville Pl | 0.56mi | 2/1.5 | 1,198 (-9%) | 12mo | $165,000 | $138 | 48 |
| 112 N Onsville Pl | 0.60mi | 2/1.5 | 1,407 (+7%) | 15mo | $168,000 | $119 | 48 |
Match score weights: distance 35% · size 25% · config 20% · recency 20%. Top-matched comps best support the ARV.
Projected returns pro-forma
-3.0% appreciation · 4.47% rent growth · sell at horizon
- IRR
- -15.1%
- Equity multiple
- 0.46×
- Total profit
- $-25,627
- Equity at exit
- $25,049
- IRR
- -4.4%
- Equity multiple
- 0.69×
- Total profit
- $-14,508
- Equity at exit
- $14,526
Cash invested: $47,040 (down + closing). Projections, not guarantees.
Landlord ↔ Tenant lean methodology
- Overall (STATE)
- 85 Strongly Landlord-Friendly
- State North Carolina
- 85 Strongly Landlord-Friendly · R+3
- County
- — inherits STATE
- City
- — inherits STATE
ZIP-level market 28540
- Home prices YoY
- -21.5%
- Rents YoY
- 4.5%
- Active inventory
- 380
- Price-to-rent
- 10.5×
Monthly cashflow live
- Estimated rent
- $1,331 high interval (Pro) →
- Mortgage (P&I)
- −$881
- Tax from tax record
- −$106 /mo · $1,271/yr
- Insurance
- −$70
- HOA
- −$0
- Vacancy / Maint / Mgmt
- −$279
- Net cashflow
- $-6
Break-even live
UW: 25.0% down · 7.5% · 30yr · 1.5% tax · 5.0% vac · 8.0% maint · 8.0% mgmt
Financing live
Cash to close
- Down payment
- $42,000
- Closing costs
- $5,040
- Reserves months
- —
- Total cash needed
- —
Loan-product check · same deal, 3 products live
Conventional
25% down · 7.5% · 30yr
- Down + closing
- —
- Monthly P&I
- —
- Monthly cashflow
- —
- DSCR
- —
- Eligible?
- —
Personal DTI + credit; lowest rate.
DSCR
20% down · 8.5% · 30yr
- Down + closing
- —
- Monthly P&I
- —
- Monthly cashflow
- —
- DSCR
- —
- Eligible?
- —
No personal income docs; deal must DSCR.
Hard money
10% down · 12.0% · 12mo
- Down + closing
- —
- Monthly P&I
- —
- Monthly cashflow
- —
- DSCR
- —
- Eligible?
- —
Short-term bridge; refi at stabilization.
Rent comps 14 comps
| Address | Beds | Baths | Sqft | Rent | $/sqft | DOM | Units | Dist |
|---|---|---|---|---|---|---|---|---|
| 319 Bracken Pl Jacksonville, NC | 2.0 | 3.0 | 992 | $1,150 | $1.16 | 20d | 1 | 0.08mi |
| 16 White Oak St Jacksonville, NC | 3.0 | 2.0 | 1150 | $1,650 | $1.43 | 20d | 1 | 0.53mi |
| 113 N Shore Dr Jacksonville, NC | 3.0 | 1.0 | 1126 | $1,395 | $1.24 | 20d | 1 | 0.53mi |
| 200 Carmen Ave Jacksonville, NC | 1.0–2.0 | 1.0–1.5 | 871 | $1,320 | $1.52 | 13d | 6 | 0.55mi |
| 1 S Onsville Pl Jacksonville, NC | 2.0 | 1.5 | 992 | $1,395 | $1.41 | 20d | 1 | 0.56mi |
| 106 Brenda Dr Jacksonville, NC | 2.0 | 1.0 | 983 | $1,300 | $1.32 | 20d | 1 | 0.57mi |
| 129 Sanders St Jacksonville, NC | 3.0 | 2.0 | 1198 | $1,450 | $1.21 | 20d | 1 | 0.62mi |
| 508 Henderson Dr Jacksonville, NC | 3.0 | 1.0 | 1050 | $1,400 | $1.33 | 20d | 1 | 0.68mi |
| 220 Audubon Dr Jacksonville, NC | 3.0 | 2.0 | 1554 | $1,875 | $1.21 | 20d | 1 | 0.88mi |
| 1030 Daniel Dr Jacksonville, NC | 3.0 | 2.0 | 1872 | $2,000 | $1.07 | 20d | 1 | 1.05mi |
| 2322 Indian Dr Unit A-3 Jacksonville, NC | 2.0 | 1.0 | 1120 | $1,150 | $1.03 | 13d | 1 | 1.10mi |
| 2318 Indian Dr Unit B-7 Jacksonville, NC | 2.0 | 1.0 | 1120 | $995 | $0.89 | 20d | 1 | 1.10mi |
| 1025 Kensington Dr Jacksonville, NC | 1.0–3.0 | 1.0–2.0 | 1150 | $1,435 | $1.25 | 13d | 8 | 1.42mi |
| 1025 Kensington Dr Jacksonville, NC | 1.0–3.0 | 1.0–2.0 | 1150 | $1,430 | $1.24 | 20d | 1 | 1.42mi |
Listing history 9 events
-
2026-04-14status Pending
-
2026-03-28$168,000 Active
-
2024-05-15soldstatus $165,000
-
2024-04-14$165,000 Active
-
2024-04-14historical
-
2024-04-12historical
-
2021-10-22soldstatus $92,000 208-char remark
Show marketing remark (208 chars)
Perfect starter home or investment property. 2 Bed 1 1/2 bath townhome is conveniently located in Jacksonville. Located near Camp Lejeune, MCAS, restaurants, schools, entertainment and more. New roof in 2021.
-
2021-08-19$97,000 208-char remark
Show marketing remark (208 chars)
Perfect starter home or investment property. 2 Bed 1 1/2 bath townhome is conveniently located in Jacksonville. Located near Camp Lejeune, MCAS, restaurants, schools, entertainment and more. New roof in 2021.
-
2006-08-11soldstatus $82,000
ⓘ Source: listings_history table (triggers on properties + properties_extension) + one-shot
backfill from property_details.listing_events for pre-trigger history.
Tax reassessment forecast NC · Resets to sale price
- Current annual tax
- $1,271 · $106/mo
- Projected year-2 tax
- $1,378 · $115/mo
- Expected delta
- +$106/yr (+$9/mo · 8.4%)
ⓘ Screening estimate from a state-policy table — verify with the county assessor before closing.
Climate risk First Street
- Flood 1/10 Low FEMA zone X (unshaded) · 0% chance over 30 yrs
- Wildfire 4/10 Moderate
- Heat 9/10 Extreme 7 d/yr ≥107°F today · 18 d/yr by 30 yrs out
- Wind 8/10 Severe 98% chance of damaging wind over 30 yrs
- Air quality 3/10 Moderate 2 unhealthy d/yr today · 3 by 30 yrs out
Nearby sold comps map
Loading sold comps map…
Walkable amenities ~0.75 mi
Loading nearby amenities…
Taxation est. · year 1
- Rental income
- $15,970
- − Mortgage interest
- −$9,411
- − Property taxes
- −$1,271
- − Insurance
- −$840
- − Repairs & maintenance
- −$1,278
- − Management
- −$1,278
- − Depreciation
- −$4,887
- Taxable loss
- −$2,994
- Est. tax savings @ 24.0%
- +$719
- After-tax cash flow
- $651/yr
For passive investors: Depreciation is non-cash, so a rental often shows a tax loss while cash-flowing — sheltering income. Rental losses are passive: they offset passive income freely, and up to $25,000/yr can offset ordinary (W-2) income if you actively participate and your MAGI is under $100k (phasing out to $0 by $150k); unused losses carry forward. On sale, claimed depreciation is recaptured at up to 25%, and gains may owe capital-gains tax (a 1031 exchange can defer both). Figures are a year-1 estimate at your 24.0% rate — not tax advice; consult a CPA.
Schools (NCES district)
- District
- Onslow County Schools
- NCES district ID
- 3703450
- Math proficiency
- 42% ▲ 6.00%
- Reading proficiency
- 49% ▲ 5.00%
- Median HH income
- $46,076
- Composite
- 38.66/100
- National rank
- #4148
- State rank
- #84 of 178 in NC
Livability — Jacksonville
- Score
- 71/100
- State rank
- #111
- US rank
- #6991
Category grades
Schools grade is shown separately in the Schools card above.
Census & demographics
- Census place
- Jacksonville, NC
- County
- Onslow County · 164,453 people
- City population
- 96,397
- Metro
- Jacksonville, NC
- Population (ZIP)
- 49,141
- Household income
- $65,625
- Rent vs Own
- Severe rent burden
- 1304.0
Population outlook (Onslow County) Hauer SSP2
- Today (2025)
- 189,789 people
- By 2030
- 194,463 · +2.5%
- By 2040
- 193,629 · +2.0%
- By 2050
- 193,248 · +1.8%
- By 2075
- 196,995 · +3.8%
- By 2100
- 201,513 · +6.2%
Race, ethnicity, and origin ACS 2023
- Neighborhood character
- Diverse neighborhood (Simpson 0.58)
- Race & ethnicity
- White 62% Black 14% Hispanic / Latino 14% Two or more races 13% Asian 2%
- Hispanic origin (detail)
- Mexican 5% Puerto Rican 6%
- Common ancestry
- Italian 3% Serbian 2% Romanian 2%
- Foreign-born
- 4% · Canada, China
- Languages at home
- 90% English-only · Spanish 7% Chinese 1% Other Asian/Pacific 1%
Political lean MEDSL · Onslow
- 2024 margin
- Solid R (+35.9) · D 31.5% · R 67.5% · Other 1.0%
- 2008→2024 swing
- -14.5pp toward R · 2008: -21.5pp · 2024: -35.9pp
- All cycles
- 2024: R+35.9 2020: R+30.2 2016: R+34.6 2012: R+27.0 2008: R+21.5
Not yet ingested
- Civics
- —
Market trends
- HPI YoY
- ▼ -60.11%
- Current HPI
- 219.5571
- Rent YoY
- ▲ 4.47%
- Metro
- Jacksonville, NC
- State GDP YoY
- ▲ 3.28%
- F500 in state
- 26
Industry mix (Fortune 500 HQ in NC)
| Industry | F500 HQs | Revenue |
|---|---|---|
| Financial Services | 2 | $213B |
|
||
| Retail | 2 | $95B |
|
||
| Industrial Conglomerate | 1 | $38B |
|
||
| Metals / Steel | 1 | $35B |
|
||
| Utilities | 1 | $30B |
|
||
| Industrial Machinery | 1 | $19B |
|
||
Price history
+104.9% since first listed9 events — show timeline
- 2026-04-14 Pending — Hive MLS
- 2026-03-28 Listed $168,000 Hive MLS
- 2024-05-15 Sold (Public Records) $165,000 Public Records
- 2024-04-14 Listed $165,000 Hive MLS
- 2024-04-14 Listing Removed — Hive MLS
- 2024-04-12 Coming Soon — Hive MLS
- 2021-10-22 Sold (MLS) $92,000 Hive MLS
- 2021-08-19 Listed $97,000 Hive MLS
- 2006-08-11 Sold (Public Records) $82,000 Public Records
Property tax history
-0.1%/yrLatest (2025): $1,271 · +0.0% YoY. Source: county tax records.
Cash-flow waterfall
monthlySold comps — $/sqft
last 12 mo · ≤1 miLoading sold comps…