 6-Plex
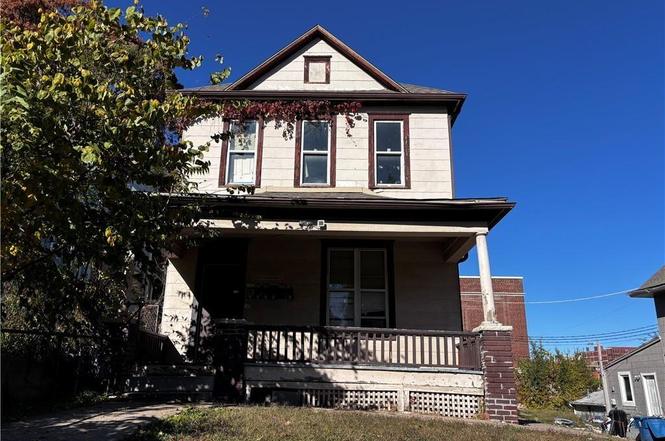
820 Tauromee St · Kansas City, KS
Flood risk 1/10 · Minimal
- FEMA flood zone
- X (unshaded)
- Chance of flooding over 30 yrs
- 0.0%
- Est. flood insurance / yr
- $473 – $860
Fire risk 1/10 · Minimal
- Est. fire insurance / yr
- $1,154 – $2,142
Heat risk 4/10 · Minor
- Hot days now (above 107°F)
- 7 days/yr
- Hot days in 30 yrs
- 17 days/yr
Wind risk 2/10 · Minimal
- Chance of severe wind over 30 yrs
- —
Air-quality risk 3/10 · Minor
- Unhealthy air days now
- 2 days/yr
- Unhealthy air days in 30 yrs
- 3 days/yr
Risk factors via First Street. Map © Google.
Why this score? — see what drove the B+ grade
The composite is a weighted blend of 9 inputs, each scored 0–100. Each bar is that input's sub-score; the figure is the points it added to the 100-point composite (weight × sub-score).
- Cash flow +30.0/30.0
- 1% rule +10.0/10.0
- DSCR +10.0/10.0
- Appreciation +10.0/10.0
- ARV discount +7.5/15.0
- Livability +3.6/5.0
- Rent growth +2.5/5.0
- Condition / age +2.5/5.0
- Schools +0.9/10.0
$275,000
🖨 Deal sheet 📄 Offer letter ✓ Due diligence
Multi-family units
County records classify this as Multi-Family (5+ Unit). Listing-text estimate: 6 units. confirmed
5+ unit building — per-unit beds/baths from public records are typically unavailable; the breakdown below (if shown) is an estimate from the listing text.
Listing remarks MLS
WOW, FANTASTIC CASHFLOW IN THIS INVESTMENT PROPERTY/SELLER IS IN PROCESS OF REHABBING THE UNITS-MOST ARE FINISHED AND SHOULD RENT QUICKLY/NON EMOTIONAL SELLER-MAKE AN OFFER AND START MAKING $$$ ON YOUR INVESTMENT
Key facts
- Renovated units
- Main-floor unit
- Local restaurants
Tags
Property features AI
Finance
- Financial info: Operating expenses include utilities, insurance, and real estate tax; Gross income reported at $41,400; Six total units (all listed as efficiency units) — currently shown as vacant
- HOA & community: No association fees
Exterior
- Parking: Off-street parking available; On-street parking available
- Security: Smoke detector(s)
- Utilities: Public water service; Public sewer; Central water heater
- Home design: Residential income property (converted residence); Three stories; Zoned R
- Construction: Frame construction; Composition roof
- Exterior features: Public water; Public sewer; Lot approximately 6,098 square feet
Interior
- Kitchen: Range/oven included; Refrigerator included
- Bedrooms: Efficiency units (studio-style)
- Bathrooms: One bathroom per unit
- Interior features: Common entry; Basement present
- Laundry & utility: Central water heater
Neighborhood map
What this means for you Summary
Snapshot
- This is a 6 × 2-bed/1.5-bath units multifamily listed at $275k.
Deal economics
- At list price, monthly cash flow is $3k ($39k/yr) — positive. Per door: $538/mo.
- The deal already cash-flows at list — no discount required.
- Meets the 1% rule at list price ($6k rent vs $275k).
- Recommended offer: $242k (12.0% below list) — sets the bar for market timing.
- Cap rate 20.4% vs local median 4.8% in Kansas City — top-decile yield for the area; either an underpriced asset or a hidden risk that comps aren't pricing in. Stress-test before assuming the spread holds.
Location & tenants
- Location reads 72/100 on livability (#103 in KS) — a middle-class / working-renter tenant base. Strengths: commute A+, cost of living A+, housing A+; Watch: crime F, employment D-.
- Kansas City (urban): math 8% / reading 15% proficiency, ranked #169 of 169 in KS (top 100%) — low school quality limits family demand, transient renter base, plan for 1-2y turnover; 81% free/reduced lunch — lower-income household profile, screen leases tightly.
- Zoned schools: Douglass Elem (math 2% / reading 8%, grade F, #679 of 684 statewide, top 100%, 260 students, 93% FRL); Wyandotte High (math 2% / reading 3%, grade F, #325 of 327 statewide, top 99%, 1,832 students, 83% FRL).
- Market conditions: 42 active listings in the ZIP; lower-income renter base — watch delinquency; 369 units permitted in Wyandotte County in 2024 (236 in 5+ unit buildings).
- At $6,282/mo this rent would consume 177% of the median local household income ($43k/yr) (locally 457% of renters already pay >50% of income on rent) — very limited rent-growth headroom before tenants either downsize or default.
Forward outlook
- In year one you build about $29k of equity ($2k loan paydown + $28k appreciation (10.0% local appreciation)).
- Wyandotte County population projected at +17% by 2050 — long-run rental-demand tailwind backs the buy-and-hold thesis.
- At projected returns (10.0% appreciation + 3.0% rent growth), your $77k cash investment doubles in ~2 years — after that, you're playing with house money.
- By year 2, paydown + projected appreciation supports a ~$47k cash-out refi (75% LTV) — recoverable capital for the next deal without selling this one.
Negotiation context
- It's been on market 146 days — a 12% lower offer ($242k) is reasonable based on typical stale-listing flexibility.
- 3 sale attempts since 8y ago with the ask held roughly flat each time — persistent listings suggest the price (not the market) is what's stuck; bring a comps-based counter.
Risks & watch-outs
- Watch-outs: built in 1900 — expect roof / HVAC / electrical / plumbing capex.
Questions for the listing agent
- It's been on market 146 days. Have you received any prior offers? Is the seller open to a 12% concession, seller financing, or rate buy-down credit?
- Can we see the unit-by-unit rent roll, current vacancy, and any below-market leases? What's the average tenancy length?
- What capital expenditures (roof, boiler, parking lot, exteriors) have been made in the last 5 years, and what's planned in the next 2?
- Built in 1900 — when were the roof, HVAC, electrical panel, plumbing, and water heater last replaced?
- Why hasn't it sold? Are there any deal-killer items the seller is aware of (foundation, flood, title, zoning, code violations)?
- Is there a deadline driving the sale (1031 exchange, divorce, estate, relocation)? That informs how much negotiation room exists.
- Schools are F-rated, which usually means shorter tenancies and higher turnover. Who's the typical renter profile here, and what's been the actual vacancy rate?
- Crime grade is F in this area — have there been break-ins, vandalism, or insurance claims at this property in the last 3 years? What carrier currently insures it and at what premium?
- What's the average days-on-market for RENTAL listings here right now (not sales)? A rising rental-DOM trend means longer vacancies and softer asking-rent achievability than the comps imply.
- What's the recent tenant-quality profile in this submarket — average credit score on applications, eviction rate, late-payment / NSF rate, and stable-employment percentage? A property-management company in the area should have these aggregated.
- How much new apartment / multifamily construction is in the pipeline within 1–3 miles? Heavy new supply (>2% of stock underway) typically softens rents 12–24 months out; light construction supports rent growth.
Investment metrics
- 1% rule
- 2.28% ✓
- Cap rate
- 20.38%
- Cash-on-cash
- 50.32%
- DSCR
- 3.24
- GRM
- 3.6
CMA / ARV
No comps found within radius.
Projected returns pro-forma
10.0% appreciation · 3.0% rent growth · sell at horizon
- IRR
- 63.9%
- Equity multiple
- 5.62×
- Total profit
- $355,426
- Equity at exit
- $247,742
- IRR
- 57.4%
- Equity multiple
- 12.49×
- Total profit
- $884,925
- Equity at exit
- $534,265
Cash invested: $77,000 (down + closing). Projections, not guarantees.
Landlord ↔ Tenant lean methodology
- Overall (STATE)
- 83 Strongly Landlord-Friendly
- State Kansas
- 83 Strongly Landlord-Friendly · R+10
- County
- — inherits STATE
- City
- — inherits STATE
ZIP-level market 66101
- Home prices YoY
- 20.4%
- Active inventory
- 42
- Price-to-rent
- 21.9×
Monthly cashflow live
- Estimated rent
- $6,282 medium interval (Pro) →
- Mortgage (P&I)
- −$1,442
- Tax from tax record
- −$177 /mo · $2,124/yr
- Insurance
- −$115
- HOA
- −$0
- Vacancy / Maint / Mgmt
- −$1,319
- Net cashflow
- $3,229
Break-even live
6-unit breakdown (identical units grouped — click to expand)
| Units | Beds | Baths | Est. rent |
|---|---|---|---|
| 6× units | 2 | 1.5 | $6,282 |
| #1 | 2 | 1.5 | $1,047 |
| #2 | 2 | 1.5 | $1,047 |
| #3 | 2 | 1.5 | $1,047 |
| #4 | 2 | 1.5 | $1,047 |
| #5 | 2 | 1.5 | $1,047 |
| #6 | 2 | 1.5 | $1,047 |
| Total (6 units) | $6,282 | ||
UW: 25.0% down · 7.5% · 30yr · 1.5% tax · 5.0% vac · 8.0% maint · 8.0% mgmt
Financing live
Cash to close
- Down payment
- $68,750
- Closing costs
- $8,250
- Reserves months
- —
- Total cash needed
- —
Loan-product check · same deal, 3 products live
Conventional
25% down · 7.5% · 30yr
- Down + closing
- —
- Monthly P&I
- —
- Monthly cashflow
- —
- DSCR
- —
- Eligible?
- —
Personal DTI + credit; lowest rate.
DSCR
20% down · 8.5% · 30yr
- Down + closing
- —
- Monthly P&I
- —
- Monthly cashflow
- —
- DSCR
- —
- Eligible?
- —
No personal income docs; deal must DSCR.
Hard money
10% down · 12.0% · 12mo
- Down + closing
- —
- Monthly P&I
- —
- Monthly cashflow
- —
- DSCR
- —
- Eligible?
- —
Short-term bridge; refi at stabilization.
Listing history 23 events
-
2026-06-18days on market $275,000 Active 146 DOM
-
2026-06-17days on market $275,000 Active 145 DOM
-
2026-06-16days on market $275,000 Active 144 DOM
-
2026-06-15days on market $275,000 Active 143 DOM
-
2026-06-13days on market $275,000 Active 141 DOM
-
2026-06-13days on market $275,000 Active 140 DOM
-
2026-06-09days on market $275,000 Active 137 DOM
-
2026-06-08days on market $275,000 Active 136 DOM
-
2026-06-07days on market $275,000 Active 135 DOM
-
2026-06-05days on market $275,000 Active 132 DOM
-
2026-06-03days on market $275,000 Active 131 DOM
-
2026-06-02days on market $275,000 Active 130 DOM
-
2026-06-01days on market $275,000 Active 129 DOM
-
2026-05-31days on market $275,000 Active 128 DOM
-
2026-01-23$275,000 Active
-
2026-01-23historical
-
2025-11-18$275,000 Active
-
2022-08-11soldstatus
-
2020-09-24soldstatus
-
2018-11-09soldstatus
-
2018-10-31soldstatus Sold 212-char remark
Show marketing remark (212 chars)
WOW, FANTASTIC CASHFLOW IN THIS INVESTMENT PROPERTY/SELLER IS IN PROCESS OF REHABBING THE UNITS-MOST ARE FINISHED AND SHOULD RENT QUICKLY/NON EMOTIONAL SELLER-MAKE AN OFFER AND START MAKING $$$ ON YOUR INVESTMENT
-
2018-10-22historical Contingent - Accepting Backup Offers 212-char remark
Show marketing remark (212 chars)
WOW, FANTASTIC CASHFLOW IN THIS INVESTMENT PROPERTY/SELLER IS IN PROCESS OF REHABBING THE UNITS-MOST ARE FINISHED AND SHOULD RENT QUICKLY/NON EMOTIONAL SELLER-MAKE AN OFFER AND START MAKING $$$ ON YOUR INVESTMENT
-
2018-10-11$95,000 Active 212-char remark
Show marketing remark (212 chars)
WOW, FANTASTIC CASHFLOW IN THIS INVESTMENT PROPERTY/SELLER IS IN PROCESS OF REHABBING THE UNITS-MOST ARE FINISHED AND SHOULD RENT QUICKLY/NON EMOTIONAL SELLER-MAKE AN OFFER AND START MAKING $$$ ON YOUR INVESTMENT
ⓘ Source: listings_history table (triggers on properties + properties_extension) + one-shot
backfill from property_details.listing_events for pre-trigger history.
Tax reassessment forecast KS · Resets to sale price
- Current annual tax
- $2,124 · $177/mo
- Projected year-2 tax
- $3,878 · $323/mo
- Expected delta
- +$1,754/yr (+$146/mo · 82.6%)
ⓘ Screening estimate from a state-policy table — verify with the county assessor before closing.
Climate risk First Street
- Flood 1/10 Low FEMA zone X (unshaded) · 0% chance over 30 yrs
- Wildfire 1/10 Low
- Heat 4/10 Moderate 7 d/yr ≥107°F today · 17 d/yr by 30 yrs out
- Wind 2/10 Low
- Air quality 3/10 Moderate 2 unhealthy d/yr today · 3 by 30 yrs out
Nearby sold comps map
Loading sold comps map…
Walkable amenities ~0.75 mi
Loading nearby amenities…
Taxation est. · year 1
- Rental income
- $75,384
- − Mortgage interest
- −$15,404
- − Property taxes
- −$2,124
- − Insurance
- −$1,375
- − Repairs & maintenance
- −$6,031
- − Management
- −$6,031
- − Depreciation
- −$8,000
- Taxable income
- $36,419
- Est. tax owed @ 24.0%
- −$8,741
- After-tax cash flow
- $30,008/yr
For passive investors: Depreciation is non-cash, so a rental often shows a tax loss while cash-flowing — sheltering income. Rental losses are passive: they offset passive income freely, and up to $25,000/yr can offset ordinary (W-2) income if you actively participate and your MAGI is under $100k (phasing out to $0 by $150k); unused losses carry forward. On sale, claimed depreciation is recaptured at up to 25%, and gains may owe capital-gains tax (a 1031 exchange can defer both). Figures are a year-1 estimate at your 24.0% rate — not tax advice; consult a CPA.
Schools (NCES district)
- District
- Kansas City
- NCES district ID
- 2007950
- Math proficiency
- 8% ▼ -10.00%
- Reading proficiency
- 15% ▼ -4.00%
- Median HH income
- $34,774
- Composite
- 9.38/100
- National rank
- #9856
- State rank
- #169 of 169 in KS
Livability — Kansas City
- Score
- 72/100
- State rank
- #103
- US rank
- #6054
Category grades
Schools grade is shown separately in the Schools card above.
Census & demographics
- Census place
- Kansas City, KS
- County
- Wyandotte County · 130,206 people
- City population
- 130,206
- Metro
- Kansas City, MO-KS
- Population (ZIP)
- 12,556
- Household income
- $42,551
- Rent vs Own
- Severe rent burden
- 457.0
Population outlook (Wyandotte County) Hauer SSP2
- Today (2025)
- 177,063 people
- By 2030
- 183,212 · +3.5%
- By 2040
- 195,697 · +10.5%
- By 2050
- 207,897 · +17.4%
- By 2075
- 236,169 · +33.4%
- By 2100
- 255,790 · +44.5%
Race, ethnicity, and origin ACS 2023
- Neighborhood character
- Diverse neighborhood (Simpson 0.66)
- Race & ethnicity
- Hispanic / Latino 47% Black 30% White 16% Two or more races 10% Asian 4% Native American 2%
- Hispanic origin (detail)
- Mexican 40%
- Common ancestry
- Romanian 1% Lithuanian 1% Slovak 1%
- Foreign-born
- 29% · Canada, India
- Languages at home
- 53% English-only · Spanish 39% Other Asian/Pacific 2%
Political lean MEDSL · Wyandotte
- 2024 margin
- Strong D (+23.9) · D 61.1% · R 37.3% · Other 1.6%
- 2008→2024 swing
- -17.0pp toward R · 2008: 40.9pp · 2024: 23.9pp
- All cycles
- 2024: D+23.9 2020: D+30.9 2016: D+29.1 2012: D+36.4 2008: D+40.9
Not yet ingested
- Civics
- —
Market trends
- HPI YoY
- ▲ 77.98%
- Current HPI
- 460.4303
- Rent YoY
- —
- Metro
- Kansas City, MO-KS
- State GDP YoY
- —
- F500 in state
- 0
Price history
+189.5% since first listed9 events — show timeline
- 2026-01-23 Listing Removed — Heartland MLS as Distributed by MLS Grid
- 2026-01-23 Listed $275,000 Heartland MLS as Distributed by MLS Grid
- 2025-11-18 Listed $275,000 Heartland MLS as Distributed by MLS Grid
- 2022-08-11 Sold (Public Records) — Public Records
- 2020-09-24 Sold (Public Records) — Public Records
- 2018-11-09 Sold (Public Records) — Public Records
- 2018-10-31 Sold (MLS) — Heartland MLS as Distributed by MLS Grid
- 2018-10-22 Contingent — Heartland MLS as Distributed by MLS Grid
- 2018-10-11 Listed $95,000 Heartland MLS as Distributed by MLS Grid
Property tax history
+4.3%/yrLatest (2025): $2,124 · +17.3% YoY. Source: county tax records.
Cash-flow waterfall
monthlySold comps — $/sqft
last 12 mo · ≤1 miLoading sold comps…