6685 Woodland Dr · Keystone Heights, FL
Flood risk 1/10 · Minimal
- FEMA flood zone
- X (unshaded)
- Chance of flooding over 30 yrs
- 0.0%
- Est. flood insurance / yr
- $507 – $1,088
Fire risk 7/10 · Major
- Est. fire insurance / yr
- $947 – $1,759
Heat risk 8/10 · Major
- Hot days now (above 107°F)
- 7 days/yr
- Hot days in 30 yrs
- 20 days/yr
Wind risk 9/10 · Severe
- Chance of severe wind over 30 yrs
- 99.0%
Air-quality risk 3/10 · Minor
- Unhealthy air days now
- 3 days/yr
- Unhealthy air days in 30 yrs
- 3 days/yr
Risk factors via First Street. Map © Google.
Why this score? — see what drove the B+ grade
The composite is a weighted blend of 9 inputs, each scored 0–100. Each bar is that input's sub-score; the figure is the points it added to the 100-point composite (weight × sub-score).
- Cash flow +30.0/30.0
- ARV discount +15.0/15.0
- DSCR +10.0/10.0
- 1% rule +8.9/10.0
- Schools +5.1/10.0
- Livability +4.0/5.0
- Rent growth +2.5/5.0
- Condition / age +2.5/5.0
- Appreciation +0.0/10.0
$180,000
🖨 Deal sheet (PDF) 📄 Offer letter ✓ Due diligence
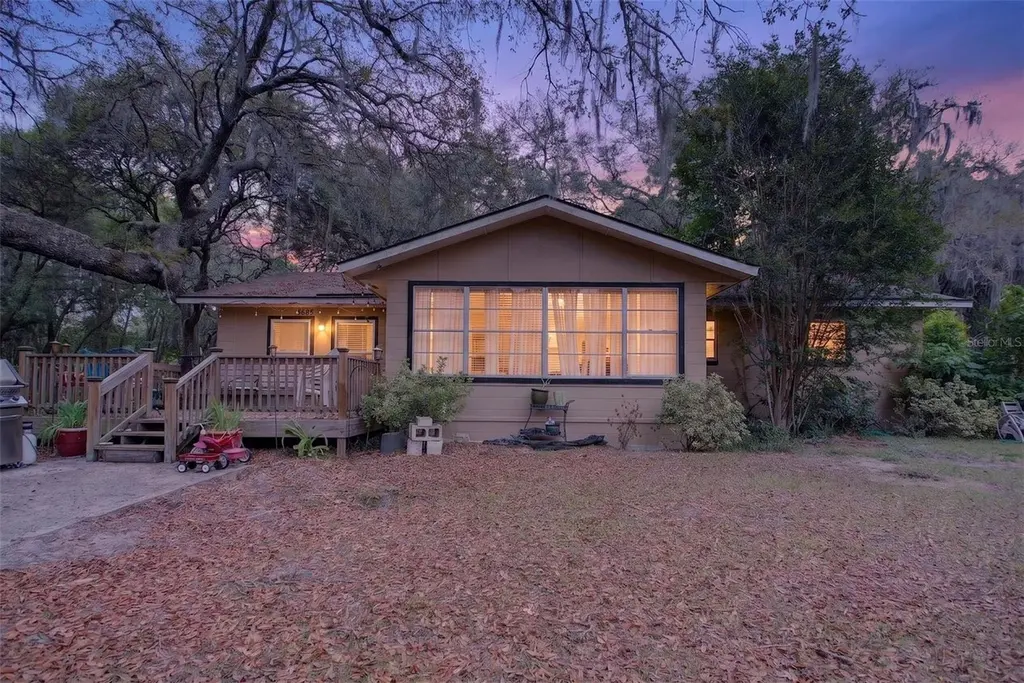
Listing remarks
Welcome to this inviting 3-bedroom, 2-bath home in Keystone Heights, FL, offering 1,499 square feet of comfortable living space set on a generous 0.8-acre lot. With plenty of room both inside and out, this property is ideal for those seeking space, flexibility, and a more relaxed lifestyle. Inside, the home features a practical layout designed for everyday living. The kitchen includes a central island, providing extra prep space, storage, and a natural gathering spot for meals or entertaining. The living and dining areas provide a cozy atmosphere with plenty of potential to make the space your own. Step outside and enjoy the charm of the wooden front deck—perfect for morning coffee, r
Key facts
- Central island
- Barbecue setup
- Expansive lot
Tags
Property features AI
Finance
- Other: Homestead exemption indicated; Lot approximately 0.8 acres (dimensions 218 x 160)
- HOA & community: No association indicated
Exterior
- Parking: Asphalt road access
- Utilities: Public water; Public sewer; Electricity connected; Water connected; Sewer connected; Cable connected
- Home design: Single family residence; Residential property; One story; North-facing entry
- Construction: Block and concrete construction; Shingle roof; Built on block foundation; Living area about 1,499 sq ft
- Exterior features: Private mailbox; Sliding doors; Storage
Interior
- Kitchen: Dishwasher; Range; Microwave; Refrigerator
- Bedrooms: 3 bedrooms
- Flooring: Tile; Block foundation
- Bathrooms: 2 full bathrooms
- Heating & cooling: Central heating (electric); Central air conditioning
- Interior features: Ceiling fans
- Laundry & utility: Washer; Dryer; Inside laundry room
Neighborhood map
What this means for you Summary
Snapshot
- This is a 3-bed/2.0-bath single-family listed at $180k.
Deal economics
- At list price, monthly cash flow is $851 ($10k/yr) — positive.
- The deal already cash-flows at list — no discount required.
- Meets the 1% rule at list price ($2k rent vs $180k).
- Cap rate 12.0% vs local median 3.6% in Keystone Heights — top-decile yield for the area; either an underpriced asset or a hidden risk that comps aren't pricing in. Stress-test before assuming the spread holds.
Location & tenants
- Location reads 80/100 on livability (#109 in FL, #1,684 nationally) — a professional / high-income tenant draw. Strengths: crime A+, cost of living A+, housing A+; Watch: amenities F, commute F.
- Clay (suburban): math 58% / reading 59% proficiency, ranked #14 of 73 in FL (top 19%) — acceptable for families but not a draw, mixed tenant base, ~2y average lease.
- Zoned schools: Keystone Heights Elementary (math 77% / reading 70%, grade A, #260 of 2,144 statewide, top 13%, 803 students, 100% FRL); Keystone Heights Junior/Senior High (math 48% / reading 47%, grade D, #204 of 667 statewide, top 31%, 1,205 students, 100% FRL) — zoned schools average 100% FRL vs 35% district-wide (65 pts higher); higher-poverty schools than district average — tighter screening recommended.
- Market conditions: 327 active listings in the ZIP; 1 comparable units currently listed for rent nearby; 1,876 units permitted in Clay County in 2024 (14 in 5+ unit buildings).
Forward outlook
- Local home prices are declining (-3.0%/yr); year-one equity from $1k of loan paydown is wiped out by about $5k of value loss. Plan a longer hold.
- Clay County population projected at +19% by 2050 — long-run rental-demand tailwind backs the buy-and-hold thesis.
- At projected returns (-3.0% appreciation + 3.0% rent growth), your $50k cash investment doubles in ~6 years — after that, you're playing with house money.
Negotiation context
- Only 2 days on market — expect competitive offers; lowballing is unlikely to land.
- Current owner paid $132k; 36% above their basis — modest negotiation headroom, anchor on the comps not their cost.
Risks & watch-outs
- Climate carrying-cost: severe wind risk, 99% chance of damaging wind over 30y; major wildfire risk; extreme-heat days projected 7→20/yr by 2055 (HVAC capex compounding) — expect insurance premiums to compound above CPI over the hold.
Questions for the listing agent
- Built in 1965 — when were the roof, HVAC, electrical panel, plumbing, and water heater last replaced?
- Is there a deadline driving the sale (1031 exchange, divorce, estate, relocation)? That informs how much negotiation room exists.
- Schools are A-rated — typically a magnet for longer-tenancy family renters. What's the average tenant stay here, and is there a school-zone premium baked into asking?
- What's the average days-on-market for RENTAL listings here right now (not sales)? A rising rental-DOM trend means longer vacancies and softer asking-rent achievability than the comps imply.
- What's the recent tenant-quality profile in this submarket — average credit score on applications, eviction rate, late-payment / NSF rate, and stable-employment percentage? A property-management company in the area should have these aggregated.
- How much new for-sale + rental construction is in the pipeline within 1–3 miles? Heavy new supply typically softens prices + rents 12–24 months out; constrained supply supports both.
Investment metrics
- 1% rule
- 1.39% ✓
- Cap rate
- 11.97%
- Cash-on-cash
- 20.27%
- DSCR
- 1.90
- GRM
- 6.0
CMA / ARV
- ARV (on-the-fly)
- $281,812
- Comps found
- 10
Show comp detail 10 sales within ~0.75 mi
| Address | Dist | Beds/Ba | Sqft | Sold | Price | $/sf | Match |
|---|---|---|---|---|---|---|---|
| 6685 Woodland Dr | 0.00mi | 3/2.0 | 1,499 (0%) | 0mo | $170,000 | $113 | 100 |
| 6607 Woodland Dr | 0.16mi | 3/2.0 | 1,563 (+4%) | 4mo | $300,000 | $192 | 82 |
| 6625 Woodland Dr | 0.18mi | 3/2.0 | 1,577 (+5%) | 2mo | $297,000 | $188 | 81 |
| 232 Shilah Ave | 0.40mi | 3/1.0 | 1,504 (+0%) | 14mo | $220,000 | $146 | 65 |
| 182 Cargo Way | 0.25mi | 3/2.0 | 1,346 (-10%) | 10mo | $350,000 | $260 | 63 |
| 634 Bethel Dr | 0.42mi | 3/1.0 | 1,428 (-5%) | 11mo | $233,000 | $163 | 59 |
| 6776 Linwood Dr | 0.51mi | 3/2.0 | 1,444 (-4%) | 23mo | $342,000 | $237 | 51 |
| 345 Orchid Ave | 0.61mi | 3/2.0 | 1,362 (-9%) | 11mo | $280,000 | $206 | 47 |
| 420 SE Palmetto Ave | 0.67mi | 3/2.0 | 1,686 (+12%) | 3mo | $275,000 | $163 | 46 |
| 540 SE Cypress Ave | 0.72mi | 3/2.0 | 1,652 (+10%) | 22mo | $180,000 | $109 | 31 |
Match score weights: distance 35% · size 25% · config 20% · recency 20%. Top-matched comps best support the ARV.
Projected returns pro-forma
-3.0% appreciation · 3.0% rent growth · sell at horizon
- IRR
- 12.5%
- Equity multiple
- 1.50×
- Total profit
- $25,017
- Equity at exit
- $26,839
- IRR
- 21.4%
- Equity multiple
- 2.81×
- Total profit
- $91,455
- Equity at exit
- $15,563
Cash invested: $50,400 (down + closing). Projections, not guarantees.
Landlord ↔ Tenant lean methodology
- Overall (STATE)
- 87 Strongly Landlord-Friendly
- State Florida
- 87 Strongly Landlord-Friendly · R+3
- County
- — inherits STATE
- City
- — inherits STATE
ZIP-level market 32656
- Home prices YoY
- -7.4%
- Active inventory
- 327
- Price-to-rent
- 6.0×
Monthly cashflow live
- Estimated rent
- $2,500 medium interval (Pro) →
- Mortgage (P&I)
- −$944
- Tax from tax record
- −$105 /mo · $1,257/yr
- Insurance
- −$75
- HOA
- −$0
- Vacancy / Maint / Mgmt
- −$525
- Net cashflow
- $851
Break-even live
Sensitivity live
| Price | -10% $953 | -5% $902 | +0% $851 | +5% $800 | +10% $749 |
|---|---|---|---|---|---|
| Rent | -10% $654 | -5% $753 | +0% $851 | +5% $950 | +10% $1,049 |
| Rate | -1.0pp $942 | -0.5pp $897 | base $851 | +0.5pp $805 | +1.0pp $757 |
UW: 25.0% down · 7.5% · 30yr · 1.5% tax · 5.0% vac · 8.0% maint · 8.0% mgmt
Financing live
Cash to close
- Down payment
- $45,000
- Closing costs
- $5,400
- Reserves months
- —
- Total cash needed
- —
Loan-product check · same deal, 3 products live
Conventional
25% down · 7.5% · 30yr
- Down + closing
- —
- Monthly P&I
- —
- Monthly cashflow
- —
- DSCR
- —
- Eligible?
- —
Personal DTI + credit; lowest rate.
DSCR
20% down · 8.5% · 30yr
- Down + closing
- —
- Monthly P&I
- —
- Monthly cashflow
- —
- DSCR
- —
- Eligible?
- —
No personal income docs; deal must DSCR.
Hard money
10% down · 12.0% · 12mo
- Down + closing
- —
- Monthly P&I
- —
- Monthly cashflow
- —
- DSCR
- —
- Eligible?
- —
Short-term bridge; refi at stabilization.
Rent comps 1 comps
| Address | Beds | Baths | Sqft | Rent | $/sqft | DOM | Units | Dist |
|---|---|---|---|---|---|---|---|---|
| 655 SW Pointview Rd Keystone Heights, FL | 3.0 | 2.0 | 1680 | $2,500 | $1.49 | 0d | 1 | 0.98mi |
Listing history 4 events
-
2026-05-06status Pending
-
2026-05-04$180,000 Active
-
2005-10-26soldstatus $132,000
-
1992-05-27soldstatus $61,000
ⓘ Source: listings_history table (triggers on properties + properties_extension) + one-shot
backfill from property_details.listing_events for pre-trigger history.
Tax reassessment forecast FL · Resets to sale price
- Current annual tax
- $1,257 · $105/mo
- Projected year-2 tax
- $1,494 · $124/mo
- Expected delta
- +$237/yr (+$20/mo · 18.9%)
ⓘ Screening estimate from a state-policy table — verify with the county assessor before closing.
Climate risk First Street
- Flood 1/10 Low FEMA zone X (unshaded) · 0% chance over 30 yrs
- Wildfire 7/10 Severe
- Heat 8/10 Severe 7 d/yr ≥107°F today · 20 d/yr by 30 yrs out
- Wind 9/10 Extreme 99% chance of damaging wind over 30 yrs
- Air quality 3/10 Moderate 3 unhealthy d/yr today · 3 by 30 yrs out
Nearby sold comps map
Loading sold comps map…
Walkable amenities ~0.75 mi
Loading nearby amenities…
Taxation est. · year 1
- Rental income
- $30,000
- − Mortgage interest
- −$10,083
- − Property taxes
- −$1,257
- − Insurance
- −$900
- − Repairs & maintenance
- −$2,400
- − Management
- −$2,400
- − Depreciation
- −$5,236
- Taxable income
- $7,724
- Est. tax owed @ 24.0%
- −$1,854
- After-tax cash flow
- $8,362/yr
For passive investors: Depreciation is non-cash, so a rental often shows a tax loss while cash-flowing — sheltering income. Rental losses are passive: they offset passive income freely, and up to $25,000/yr can offset ordinary (W-2) income if you actively participate and your MAGI is under $100k (phasing out to $0 by $150k); unused losses carry forward. On sale, claimed depreciation is recaptured at up to 25%, and gains may owe capital-gains tax (a 1031 exchange can defer both). Figures are a year-1 estimate at your 24.0% rate — not tax advice; consult a CPA.
Schools (NCES district)
- District
- Clay
- NCES district ID
- 1200300
- Math proficiency
- 58% ▼ -8.00%
- Reading proficiency
- 59% ▼ -3.00%
- Median HH income
- $59,379
- Composite
- 50.73/100
- National rank
- #1815
- State rank
- #14 of 73 in FL
Livability — Keystone Heights
- Score
- 80/100
- State rank
- #109
- US rank
- #1684
Category grades
Schools grade is shown separately in the Schools card above.
Census & demographics
- Population (ZIP)
- 15,630
Population outlook (Clay County) Hauer SSP2
- Today (2025)
- 230,495 people
- By 2030
- 242,427 · +5.2%
- By 2040
- 262,244 · +13.8%
- By 2050
- 275,148 · +19.4%
- By 2075
- 295,397 · +28.2%
- By 2100
- 287,592 · +24.8%
Race, ethnicity, and origin ACS 2023
- Neighborhood character
- Predominantly White (82%)
- Race & ethnicity
- White 82% Two or more races 10% Hispanic / Latino 5% Black 4%
- Hispanic origin (detail)
- Mexican 2%
- Common ancestry
- Lithuanian 3% Slovak 2% Portuguese 2%
- Foreign-born
- 2% · Canada
- Languages at home
- 98% English-only · Spanish 1%
Political lean MEDSL · Clay
- 2024 margin
- Solid R (+39.3) · D 29.9% · R 69.2%
- 2008→2024 swing
- +3.6pp toward D · 2008: -42.8pp · 2024: -39.3pp
- All cycles
- 2024: R+39.3 2020: R+37.1 2016: R+44.3 2012: R+45.8 2008: R+42.8
Not yet ingested
- Civics
- —
Market trends
- HPI YoY
- ▼ -27.65%
- Current HPI
- 344.7744
- Rent YoY
- —
- Metro
- —
- State GDP YoY
- ▲ 3.28%
- F500 in state
- 36
Industry mix (Fortune 500 HQ in FL)
| Industry | F500 HQs | Revenue |
|---|---|---|
| Industrial Technology | 2 | $29B |
|
||
| Insurance | 2 | $17B |
|
||
| Retail | 1 | $60B |
|
||
| Technology Distribution | 1 | $58B |
|
||
| Homebuilding | 1 | $35B |
|
||
| Technology Manufacturing | 1 | $35B |
|
||
Price history
+195.1% since first listed4 events — show timeline
- 2026-05-06 Pending — Stellar MLS as Distributed by MLS Grid
- 2026-05-04 Listed $180,000 Stellar MLS as Distributed by MLS Grid
- 2005-10-26 Sold (Public Records) $132,000 Public Records
- 1992-05-27 Sold (Public Records) $61,000 Public Records
Property tax history
+3.5%/yrLatest (2025): $1,257 · +4.0% YoY. Source: county tax records.
Cash-flow waterfall
monthlySold comps — $/sqft
last 12 mo · ≤1 miLoading sold comps…