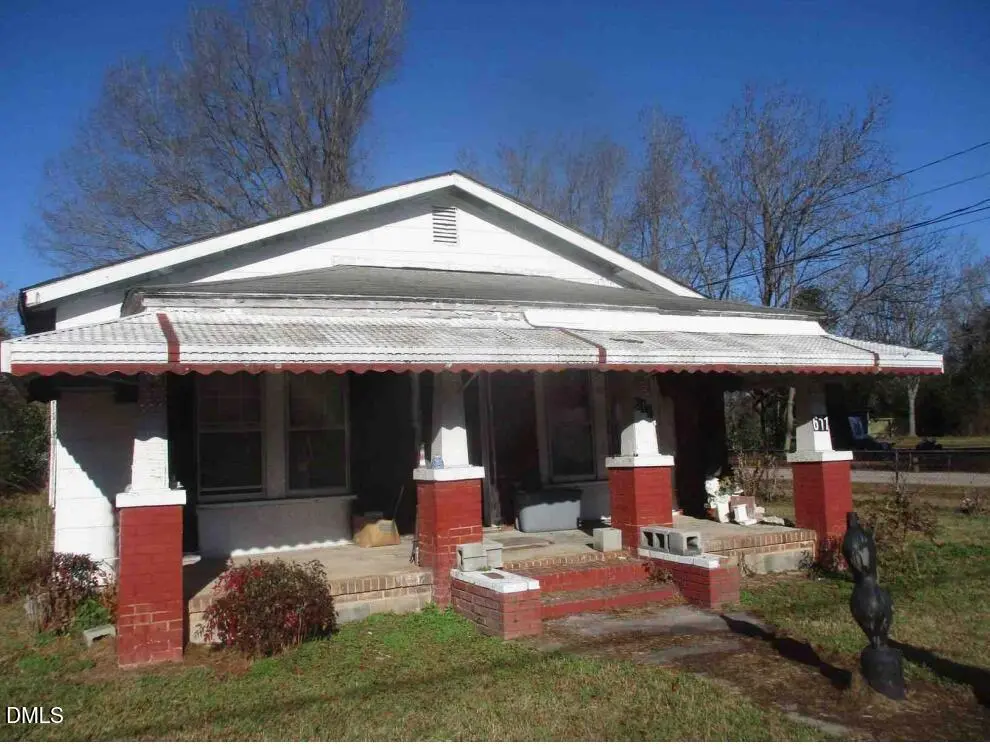
611 N Wilson Ave · Dunn, NC
Flood risk 4/10 · Minor
- FEMA flood zone
- X (unshaded)
- Chance of flooding over 30 yrs
- 0.22%
- Est. flood insurance / yr
- $507 – $1,088
Fire risk 1/10 · Minimal
- Est. fire insurance / yr
- $906 – $1,684
Heat risk 7/10 · Major
- Hot days now (above 106°F)
- 7 days/yr
- Hot days in 30 yrs
- 17 days/yr
Wind risk 6/10 · Moderate
- Chance of severe wind over 30 yrs
- 76.0%
Air-quality risk 2/10 · Minimal
- Unhealthy air days now
- 1 days/yr
- Unhealthy air days in 30 yrs
- 1 days/yr
Risk factors via First Street. Map © Google.
Why this score? — see what drove the B- grade
The composite is a weighted blend of 9 inputs, each scored 0–100. Each bar is that input's sub-score; the figure is the points it added to the 100-point composite (weight × sub-score).
- Cash flow +30.0/30.0
- 1% rule +10.0/10.0
- DSCR +10.0/10.0
- ARV discount +7.5/15.0
- Livability +3.2/5.0
- Schools +3.0/10.0
- Rent growth +2.5/5.0
- Condition / age +2.5/5.0
- Appreciation +0.0/10.0
$75,000
🖨 Deal sheet 📄 Offer letter ✓ Due diligence
Listing remarks
Investors, Investors! You don't want to miss out on this charming 3-bedroom, 1-bath fixer-upper offering over 1,100 sq. ft of living space with endless potential! This home is a great opportunity for investors or buyers looking to create value with a little sweat equity. One of the many standout features of this home is the corner lot, road access on the front and right side of the home, a private driveway, providing easy access and added convenience. Nestled in a quiet area of Dunn, NC, this property offers the perfect balance of privacy and location. Inside, you'll find a spacious layout with an good foundation for renovation. The three bedrooms provide flexibility for a growing family.
Key facts
- 8,712 sq ft lot
- Built 1936
- Listed 16 days
Property features AI
Finance
- Other: Lot size approximately 0.2 acres; Living area reported as 1,143 (above grade finished area 1,143; below grade finished area 0); Listed as a fixer; Coordinates: 35.312629, -78.605543; Postal code 28334; County: Harnett
- HOA & community: No association; Not a senior community
Exterior
- Parking: Carport; Driveway
- Utilities: Public water; Public sewer
- Home design: Single-story house; One level; RM zoning
- Construction: Aluminum siding; HardiPlank-type siding; Shingle siding; Composition/shingle roof; Block foundation; Built as a house
- Exterior features: Front porch; Awnings; Private yard; City street frontage; Publicly maintained asphalt road access
Interior
- Bedrooms: 3 bedrooms (all on the main level)
- Flooring: Wood
- Bathrooms: 1 full bathroom
- Heating & cooling: Propane heating; Central air conditioning
- Interior features: Wood flooring; Fixer condition
Neighborhood map
What this means for you Summary
Snapshot
- This is a 3-bed/1.0-bath single-family listed at $75k.
Deal economics
- At list price, monthly cash flow is $702 ($8k/yr) — positive.
- The deal already cash-flows at list — no discount required.
- Meets the 1% rule at list price ($1k rent vs $75k).
- Recommended offer: $74k (1.5% below list) — sets the bar for market timing.
- Cap rate 17.5% vs local median 4.1% in Dunn — top-decile yield for the area; either an underpriced asset or a hidden risk that comps aren't pricing in. Stress-test before assuming the spread holds.
Location & tenants
- Location reads 63/100 on livability (#390 in NC) — a middle-class / working-renter tenant base. Strengths: cost of living A+, health & safety A+, housing A; Watch: crime F, commute F, employment F.
- Harnett County Schools (rural): math 31% / reading 39% proficiency, ranked #130 of 178 in NC (top 73%) — families likely to look elsewhere, expect single-tenant / working-renter base with shorter leases.
- Zoned schools: Triton High (math 41% / reading 49%, grade D-, #350 of 535 statewide, top 66%, 1,287 students, 63% FRL).
- Market conditions: 339 active listings in the ZIP; 5 comparable units currently listed for rent nearby; rentals leasing fast (median 14d on market — plan ~1-2 weeks tenant-placement turnaround); 2,080 units permitted in Harnett County in 2024 (12 in 5+ unit buildings).
- This rent runs 34% of the median local income ($53k/yr) — at the standard rent-burdened threshold; future hikes will face affordability resistance.
Forward outlook
- Local home prices are declining (-3.0%/yr); year-one equity from $519 of loan paydown is wiped out by about $2k of value loss. Plan a longer hold.
- Harnett County population projected at +42% by 2050 — long-run rental-demand tailwind backs the buy-and-hold thesis.
- At projected returns (-3.0% appreciation + 3.0% rent growth), your $21k cash investment doubles in ~3 years — after that, you're playing with house money.
Negotiation context
- It's been on market 16 days — a 2% lower offer ($74k) is reasonable based on typical stale-listing flexibility.
- 2 sale attempts with the ask held roughly flat each time — persistent listings suggest the price (not the market) is what's stuck; bring a comps-based counter.
Risks & watch-outs
- Watch-outs: built in 1936 — expect roof / HVAC / electrical / plumbing capex.
- Climate carrying-cost: major wind risk, 76% chance of damaging wind over 30y; extreme-heat days projected 7→17/yr by 2055 (HVAC capex compounding) — expect insurance premiums to compound above CPI over the hold.
Questions for the listing agent
- Built in 1936 — when were the roof, HVAC, electrical panel, plumbing, and water heater last replaced?
- Is there a deadline driving the sale (1031 exchange, divorce, estate, relocation)? That informs how much negotiation room exists.
- Schools are D-rated, which usually means shorter tenancies and higher turnover. Who's the typical renter profile here, and what's been the actual vacancy rate?
- Crime grade is F in this area — have there been break-ins, vandalism, or insurance claims at this property in the last 3 years? What carrier currently insures it and at what premium?
- What's the average days-on-market for RENTAL listings here right now (not sales)? A rising rental-DOM trend means longer vacancies and softer asking-rent achievability than the comps imply.
- What's the recent tenant-quality profile in this submarket — average credit score on applications, eviction rate, late-payment / NSF rate, and stable-employment percentage? A property-management company in the area should have these aggregated.
- How much new for-sale + rental construction is in the pipeline within 1–3 miles? Heavy new supply typically softens prices + rents 12–24 months out; constrained supply supports both.
Investment metrics
- 1% rule
- 1.99% ✓
- Cap rate
- 17.52%
- Cash-on-cash
- 40.11%
- DSCR
- 2.78
- GRM
- 4.2
CMA / ARV
- ARV (on-the-fly)
- $211,680
- Comps found
- 12
Show comp detail 12 sales within ~0.75 mi
| Address | Dist | Beds/Ba | Sqft | Sold | Price | $/sf | Match |
|---|---|---|---|---|---|---|---|
| 707 N Wilson Ave | 0.05mi | 3/2.0 | 1,120 (0%) | 7mo | $234,000 | $209 | 88 |
| 406 W Granville St | 0.38mi | 3/2.0 | 1,077 (-4%) | 1mo | $223,000 | $207 | 71 |
| 501 E Granville St | 0.31mi | 3/2.0 | 1,107 (-1%) | 11mo | $235,000 | $212 | 70 |
| 609 N Magnolia Ave | 0.14mi | 2/1.0 (-1) | 1,063 (-5%) | 14mo | $75,000 | $71 | 68 |
| 104 N Jackson St | 0.24mi | 3/2.0 | 1,075 (-4%) | 16mo | $169,000 | $157 | 64 |
| 1000 N Mckay St | 0.39mi | 3/2.0 | 1,130 (+1%) | 14mo | $239,900 | $212 | 64 |
| 305 N Wilmington Ave | 0.43mi | 3/2.0 | 1,120 (0%) | 14mo | $210,000 | $188 | 64 |
| 709 E Johnson St | 0.32mi | 3/1.0 | 1,044 (-7%) | 15mo | $93,000 | $89 | 62 |
| 400 E Townsend St | 0.38mi | 2/1.0 (-1) | 981 (-12%) | 9mo | $185,000 | $189 | 49 |
| 503 W Wake St | 0.49mi | 3/2.0 | 1,198 (+7%) | 16mo | $220,000 | $184 | 49 |
| 309 S Mckay Ave | 0.68mi | 3/1.0 | 1,199 (+7%) | 10mo | $245,000 | $204 | 48 |
| 713 E Divine St | 0.69mi | 2/1.5 (-1) | 1,001 (-11%) | 12mo | $85,000 | $85 | 33 |
Match score weights: distance 35% · size 25% · config 20% · recency 20%. Top-matched comps best support the ARV.
Projected returns pro-forma
-3.0% appreciation · 3.0% rent growth · sell at horizon
- IRR
- 36.5%
- Equity multiple
- 2.55×
- Total profit
- $32,545
- Equity at exit
- $11,183
- IRR
- 43.1%
- Equity multiple
- 5.09×
- Total profit
- $85,885
- Equity at exit
- $6,485
Cash invested: $21,000 (down + closing). Projections, not guarantees.
Landlord ↔ Tenant lean methodology
- Overall (STATE)
- 85 Strongly Landlord-Friendly
- State North Carolina
- 85 Strongly Landlord-Friendly · R+3
- County
- — inherits STATE
- City
- — inherits STATE
ZIP-level market 28334
- Home prices YoY
- -13.2%
- Active inventory
- 339
- Price-to-rent
- 4.2×
Monthly cashflow live
- Estimated rent
- $1,490 high interval (Pro) →
- Mortgage (P&I)
- −$393
- Tax from tax record
- −$51 /mo · $609/yr
- Insurance
- −$31
- HOA
- −$0
- Vacancy / Maint / Mgmt
- −$313
- Net cashflow
- $702
Break-even live
UW: 25.0% down · 7.5% · 30yr · 1.5% tax · 5.0% vac · 8.0% maint · 8.0% mgmt
Financing live
Cash to close
- Down payment
- $18,750
- Closing costs
- $2,250
- Reserves months
- —
- Total cash needed
- —
Loan-product check · same deal, 3 products live
Conventional
25% down · 7.5% · 30yr
- Down + closing
- —
- Monthly P&I
- —
- Monthly cashflow
- —
- DSCR
- —
- Eligible?
- —
Personal DTI + credit; lowest rate.
DSCR
20% down · 8.5% · 30yr
- Down + closing
- —
- Monthly P&I
- —
- Monthly cashflow
- —
- DSCR
- —
- Eligible?
- —
No personal income docs; deal must DSCR.
Hard money
10% down · 12.0% · 12mo
- Down + closing
- —
- Monthly P&I
- —
- Monthly cashflow
- —
- DSCR
- —
- Eligible?
- —
Short-term bridge; refi at stabilization.
Rent comps 5 comps
| Address | Beds | Baths | Sqft | Rent | $/sqft | DOM | Units | Dist |
|---|---|---|---|---|---|---|---|---|
| 807 N Ellis Ave Dunn, NC | 2.0 | 1.0 | 1100 | $1,400 | $1.27 | 13d | 1 | 0.44mi |
| 202 S Sampson Ave Dunn, NC | 3.0 | 1.0 | 1418 | $1,600 | $1.13 | 13d | 1 | 0.80mi |
| 1001 Webster Dr Dunn, NC | 1.0–3.0 | 1.0–1.5 | 900 | $1,300 | $1.44 | 12d | 1 | 0.95mi |
| 909 S McKay Ave Dunn, NC | 2.0 | 1.0 | 725 | $995 | $1.37 | 13d | 1 | 1.08mi |
| 108 Jude Ct Dunn, NC | 3.0 | 2.0 | 1350 | $1,650 | $1.22 | 21d | 1 | 1.47mi |
Listing history 6 events
-
2026-05-01status Pending
-
2026-04-10$75,000 Active
-
2026-04-10historical
-
2026-03-04price $75,000
-
2026-02-21$105,000 Active
-
2026-01-16historical
ⓘ Source: listings_history table (triggers on properties + properties_extension) + one-shot
backfill from property_details.listing_events for pre-trigger history.
Tax reassessment forecast NC · Resets to sale price
- Current annual tax
- $609 · $51/mo
- Projected year-2 tax
- $615 · $51/mo
- Expected delta
- +$6/yr (+$1/mo · 1.0%)
ⓘ Screening estimate from a state-policy table — verify with the county assessor before closing.
Climate risk First Street
- Flood 4/10 Moderate FEMA zone X (unshaded) · 22% chance over 30 yrs
- Wildfire 1/10 Low
- Heat 7/10 Severe 7 d/yr ≥106°F today · 17 d/yr by 30 yrs out
- Wind 6/10 Major 76% chance of damaging wind over 30 yrs
- Air quality 2/10 Low 1 unhealthy d/yr today · 1 by 30 yrs out
Nearby sold comps map
Loading sold comps map…
Walkable amenities ~0.75 mi
Loading nearby amenities…
Taxation est. · year 1
- Rental income
- $17,881
- − Mortgage interest
- −$4,201
- − Property taxes
- −$609
- − Insurance
- −$375
- − Repairs & maintenance
- −$1,430
- − Management
- −$1,430
- − Depreciation
- −$2,182
- Taxable income
- $7,653
- Est. tax owed @ 24.0%
- −$1,837
- After-tax cash flow
- $6,586/yr
For passive investors: Depreciation is non-cash, so a rental often shows a tax loss while cash-flowing — sheltering income. Rental losses are passive: they offset passive income freely, and up to $25,000/yr can offset ordinary (W-2) income if you actively participate and your MAGI is under $100k (phasing out to $0 by $150k); unused losses carry forward. On sale, claimed depreciation is recaptured at up to 25%, and gains may owe capital-gains tax (a 1031 exchange can defer both). Figures are a year-1 estimate at your 24.0% rate — not tax advice; consult a CPA.
Schools (NCES district)
- District
- Harnett County Schools
- NCES district ID
- 3702010
- Math proficiency
- 31% ▼ -2.00%
- Reading proficiency
- 39% ▼ -1.00%
- Median HH income
- $45,400
- Composite
- 29.88/100
- National rank
- #6397
- State rank
- #130 of 178 in NC
Livability — Dunn
- Score
- 63/100
- State rank
- #390
- US rank
- #15160
Category grades
Schools grade is shown separately in the Schools card above.
Census & demographics
- Census place
- Dunn, NC
- County
- Harnett County · 125,715 people
- City population
- 22,873
- Metro
- Fayetteville, NC
- Population (ZIP)
- 22,873
- Household income
- $53,036
- Rent vs Own
- Severe rent burden
- 382.0
Population outlook (Harnett County) Hauer SSP2
- Today (2025)
- 153,758 people
- By 2030
- 166,581 · +8.3%
- By 2040
- 192,741 · +25.4%
- By 2050
- 218,332 · +42.0%
- By 2075
- 275,422 · +79.1%
- By 2100
- 313,511 · +103.9%
Race, ethnicity, and origin ACS 2023
- Neighborhood character
- Majority White (64%)
- Race & ethnicity
- White 64% Black 20% Hispanic / Latino 13% Two or more races 4%
- Hispanic origin (detail)
- Mexican 9% Puerto Rican 2%
- Common ancestry
- Serbian 3% Slovak 1% Romanian 1%
- Foreign-born
- 5% · Canada, Guatemala
- Languages at home
- 88% English-only · Spanish 11%
Political lean MEDSL · Harnett
- 2024 margin
- Strong R (+25.1) · D 36.9% · R 62.0% · Other 1.1%
- 2008→2024 swing
- -8.4pp toward R · 2008: -16.7pp · 2024: -25.1pp
- All cycles
- 2024: R+25.1 2020: R+22.4 2016: R+24.1 2012: R+19.4 2008: R+16.7
Not yet ingested
- Civics
- —
Market trends
- HPI YoY
- ▼ -41.76%
- Current HPI
- 275.5055
- Rent YoY
- —
- Metro
- Fayetteville, NC
- State GDP YoY
- ▲ 3.28%
- F500 in state
- 26
Industry mix (Fortune 500 HQ in NC)
| Industry | F500 HQs | Revenue |
|---|---|---|
| Financial Services | 2 | $213B |
|
||
| Retail | 2 | $95B |
|
||
| Industrial Conglomerate | 1 | $38B |
|
||
| Metals / Steel | 1 | $35B |
|
||
| Utilities | 1 | $30B |
|
||
| Industrial Machinery | 1 | $19B |
|
||
Price history
-28.6% since first listed6 events — show timeline
- 2026-05-01 Pending — TMLS
- 2026-04-10 Listing Removed — TMLS
- 2026-04-10 Listed $75,000 TMLS
- 2026-03-04 Price Changed $75,000 TMLS
- 2026-02-21 Listed $105,000 TMLS
- 2026-01-16 Coming Soon — TMLS
Property tax history
-1.9%/yrLatest (2025): $609 · +4.3% YoY. Source: county tax records.
Cash-flow waterfall
monthlySold comps — $/sqft
last 12 mo · ≤1 miLoading sold comps…