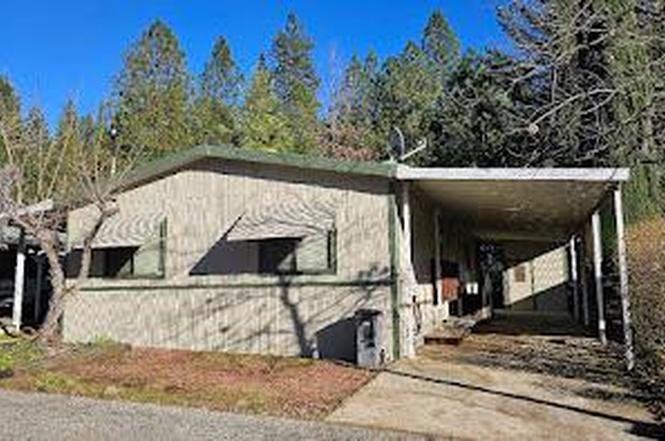
21200 Todd Valley Rd #111 · Foresthill, CA
Flood risk 1/10 · Minimal
- FEMA flood zone
- X (unshaded)
- Chance of flooding over 30 yrs
- 0.0%
- Est. flood insurance / yr
- $507 – $1,088
Fire risk 8/10 · Major
- Est. fire insurance / yr
- $659 – $1,223
Heat risk 5/10 · Moderate
- Hot days now (above 99°F)
- 6 days/yr
- Hot days in 30 yrs
- 14 days/yr
Wind risk 1/10 · Minimal
- Chance of severe wind over 30 yrs
- —
Air-quality risk 10/10 · Severe
- Unhealthy air days now
- 21 days/yr
- Unhealthy air days in 30 yrs
- 31 days/yr
Risk factors via First Street. Map © Google.
Why this score? — see what drove the C+ grade
The composite is a weighted blend of 9 inputs, each scored 0–100. Each bar is that input's sub-score; the figure is the points it added to the 100-point composite (weight × sub-score).
- Cash flow +25.0/30.0
- ARV discount +9.9/15.0
- DSCR +8.1/10.0
- 1% rule +6.5/10.0
- Schools +4.9/10.0
- Rent growth +2.5/5.0
- Condition / age +2.5/5.0
- Livability +2.0/5.0
- Appreciation +0.0/10.0
$150,000
🖨 Deal sheet (PDF) 📄 Offer letter ✓ Due diligence
Listing remarks
Tucked away in Skyview Terrace MHMP, at 21200 Todd Valley Rd, this inviting home on Terrace View at space #111, in Foresthill, CA, presents a wonderful opportunity to embrace comfortable living, with a welcoming atmosphere. Move-in ready, the living area offers spacious open floor plan with ample room for comfy overstuffed furniture and plenty of space for formal dining. The kitchen area becomes a natural gathering place, showcasing a kitchen peninsula and kitchen bar for casual dining and conversation, complemented beautifully by a wood wall, adding a touch of rustic charm. The Master bedroom offers a tranquil retreat, enhanced by a wood wall that brings warmth and character to the space,
Key facts
- Double sinks
- Open floor plan
- Kitchen bar
Tags
Property features AI
Finance
- Other: Located in a park (land lease applies)
- Financial info: Land lease (yes) with monthly amount noted
- HOA & community: No association
Exterior
- Parking: Parking for 3 vehicles; Attached, covered parking and deck
- Utilities: Public water; Holding tank sewer; Propane and gas plumbed; Generator and 220 volts in laundry
- Home design: Manufactured in park (triple wide); Updated/remodeled; Built in 1989
- Construction: Shingle roof; Wood skirting; Manufactured by Fleetwood
- Exterior features: Carport awning; Shed(s); Other lot features
Interior
- Kitchen: Free standing gas range; Free standing refrigerator; Dishwasher; Microwave; Hood over range; Ice maker; Disposal; Pantry closet; Breakfast area; Laminate counters
- Bedrooms: 3 bedrooms (includes master bedroom)
- Flooring: Simulated wood and wood flooring
- Bathrooms: 2 full bathrooms; Sunken tub and shower stall(s)
- Heating & cooling: Central heating and central cooling; Pellet stove and wood stove (fireplace feature); Ceiling fan(s); Heating noted as 'See Remarks'
- Interior features: Dishwasher; Disposal; Microwave; Ice maker; Hood over range; Free standing gas range; Free standing refrigerator; One fireplace with pellet stove; Cathedral/vaulted great room; Breakfast area and pantry closet; Laminate counters; Dining/family combo and formal dining area; Dual pane full windows; Porch steps, covered deck and covered patio with railings; Pets allowed (cats, dogs; service animals OK); Unfurnished
- Laundry & utility: Washer and dryer included; Gas hook-up; Laundry located inside
Neighborhood map
What this means for you Summary
Snapshot
- This is a 3-bed/2.0-bath manufactured listed at $150k.
Deal economics
- At list price, monthly cash flow is $325 ($4k/yr) — positive.
- The deal already cash-flows at list — no discount required.
- Meets the 1% rule at list price ($2k rent vs $150k).
- Recommended offer: $132k (12.0% below list) — sets the bar for market timing.
- Cap rate 8.9% vs local median 1.7% in Foresthill — top-decile yield for the area; either an underpriced asset or a hidden risk that comps aren't pricing in. Stress-test before assuming the spread holds.
Location & tenants
- Location reads 39/100 on livability (#1,397 in CA) — a limited-amenity area; tenant pool skews transient or value-seeking. Strengths: housing A+, crime A; Watch: amenities F, commute F, employment F.
- Placer Union High (suburban): math 39% / reading 72% proficiency, ranked #98 of 517 in CA (top 19%) — acceptable for families but not a draw, mixed tenant base, ~2y average lease.
- Zoned schools: Foresthill Divide (math 33% / reading 42%, grade F, #667 of 1,571 statewide, top 43%, 446 students, 39% FRL); Foresthill High (math 34% / reading 74%, grade C-, #256 of 1,170 statewide, top 24%, 184 students, 33% FRL).
- Market conditions: 103 active listings in the ZIP; 3,535 units permitted in Placer County in 2024 (689 in 5+ unit buildings).
Forward outlook
- Local home prices are declining (-3.0%/yr); year-one equity from $1k of loan paydown is wiped out by about $4k of value loss. Plan a longer hold.
- Placer County population projected at +20% by 2050 — long-run rental-demand tailwind backs the buy-and-hold thesis.
Negotiation context
- It's been on market 134 days — a 12% lower offer ($132k) is reasonable based on typical stale-listing flexibility.
Risks & watch-outs
- Climate carrying-cost: severe wildfire risk; extreme-heat days projected 6→14/yr by 2055 (HVAC capex compounding) — expect insurance premiums to compound above CPI over the hold.
Questions for the listing agent
- It's been on market 134 days. Have you received any prior offers? Is the seller open to a 12% concession, seller financing, or rate buy-down credit?
- Why hasn't it sold? Are there any deal-killer items the seller is aware of (foundation, flood, title, zoning, code violations)?
- Is there a deadline driving the sale (1031 exchange, divorce, estate, relocation)? That informs how much negotiation room exists.
- Schools are D-rated, which usually means shorter tenancies and higher turnover. Who's the typical renter profile here, and what's been the actual vacancy rate?
- What's the average days-on-market for RENTAL listings here right now (not sales)? A rising rental-DOM trend means longer vacancies and softer asking-rent achievability than the comps imply.
- What's the recent tenant-quality profile in this submarket — average credit score on applications, eviction rate, late-payment / NSF rate, and stable-employment percentage? A property-management company in the area should have these aggregated.
- How much new for-sale + rental construction is in the pipeline within 1–3 miles? Heavy new supply typically softens prices + rents 12–24 months out; constrained supply supports both.
Investment metrics
- 1% rule
- 1.15% ✓
- Cap rate
- 8.89%
- Cash-on-cash
- 9.27%
- DSCR
- 1.41
- GRM
- 7.3
CMA / ARV
- ARV (on-the-fly)
- $158,400
- Comps found
- 6
Show comp detail 6 sales within ~0.75 mi
| Address | Dist | Beds/Ba | Sqft | Sold | Price | $/sf | Match |
|---|---|---|---|---|---|---|---|
| 21200 Todd Valley Rd #13 | 0.00mi | 2/2.0 (-1) | 1,560 (-2%) | 3mo | $155,000 | $99 | 89 |
| 21200 Todd Valley Rd #150 | 0.00mi | 3/2.0 | 1,677 (+5%) | 16mo | $159,000 | $95 | 79 |
| 21200 Todd Valley Rd #66 | 0.00mi | 3/2.0 | 1,440 (-10%) | 8mo | $112,000 | $78 | 76 |
| 21200 Todd Valley Rd #5 | 0.00mi | 2/2.0 (-1) | 1,440 (-10%) | 18mo | $82,500 | $57 | 63 |
| 5782 Arrowhead Dr | 0.56mi | 3/2.0 | 1,560 (-2%) | 18mo | $395,000 | $253 | 55 |
| 21207 Oakwood Ln | 0.43mi | 3/2.0 | 1,494 (-7%) | 19mo | $439,000 | $294 | 53 |
Match score weights: distance 35% · size 25% · config 20% · recency 20%. Top-matched comps best support the ARV.
Projected returns pro-forma
-3.0% appreciation · 3.0% rent growth · sell at horizon
- IRR
- -2.3%
- Equity multiple
- 0.91×
- Total profit
- $-3,605
- Equity at exit
- $22,365
- IRR
- 7.4%
- Equity multiple
- 1.56×
- Total profit
- $23,590
- Equity at exit
- $12,969
Cash invested: $42,000 (down + closing). Projections, not guarantees.
Landlord ↔ Tenant lean methodology
- Overall (STATE)
- 18 Strongly Tenant-Friendly
- State California
- 18 Strongly Tenant-Friendly · D+13
- County
- — inherits STATE
- City
- — inherits STATE
ZIP-level market 95631
- Active inventory
- 103
- Price-to-rent
- 7.3×
Monthly cashflow live
- Estimated rent
- $1,723 medium interval (Pro) →
- Mortgage (P&I)
- −$787
- Tax est. 1.5%
- −$188 /mo · $2,250/yr
- Insurance
- −$62
- HOA
- −$0
- Vacancy / Maint / Mgmt
- −$362
- Net cashflow
- $325
Break-even live
Sensitivity live
| Price | -10% $428 | -5% $376 | +0% $325 | +5% $273 | +10% $221 |
|---|---|---|---|---|---|
| Rent | -10% $189 | -5% $257 | +0% $325 | +5% $393 | +10% $461 |
| Rate | -1.0pp $400 | -0.5pp $363 | base $325 | +0.5pp $286 | +1.0pp $246 |
UW: 25.0% down · 7.5% · 30yr · 1.5% tax · 5.0% vac · 8.0% maint · 8.0% mgmt
Financing live
Cash to close
- Down payment
- $37,500
- Closing costs
- $4,500
- Reserves months
- —
- Total cash needed
- —
Loan-product check · same deal, 3 products live
Conventional
25% down · 7.5% · 30yr
- Down + closing
- —
- Monthly P&I
- —
- Monthly cashflow
- —
- DSCR
- —
- Eligible?
- —
Personal DTI + credit; lowest rate.
DSCR
20% down · 8.5% · 30yr
- Down + closing
- —
- Monthly P&I
- —
- Monthly cashflow
- —
- DSCR
- —
- Eligible?
- —
No personal income docs; deal must DSCR.
Hard money
10% down · 12.0% · 12mo
- Down + closing
- —
- Monthly P&I
- —
- Monthly cashflow
- —
- DSCR
- —
- Eligible?
- —
Short-term bridge; refi at stabilization.
Listing history 5 events
-
2026-06-05statusdays on market $150,000 Pending 134 DOM
-
2026-06-03days on market $150,000 Active 133 DOM
-
2026-06-02days on market $150,000 Active 132 DOM
-
2026-06-01days on market $150,000 Active 131 DOM
-
2026-05-31days on market $150,000 Active 130 DOM
ⓘ Source: listings_history table (triggers on properties + properties_extension) + one-shot
backfill from property_details.listing_events for pre-trigger history.
Climate risk First Street
- Flood 1/10 Low FEMA zone X (unshaded) · 0% chance over 30 yrs
- Wildfire 8/10 Severe
- Heat 5/10 Major 6 d/yr ≥99°F today · 14 d/yr by 30 yrs out
- Wind 1/10 Low
- Air quality 10/10 Extreme 21 unhealthy d/yr today · 31 by 30 yrs out
Nearby sold comps map
Loading sold comps map…
Walkable amenities ~0.75 mi
Loading nearby amenities…
Taxation est. · year 1
- Rental income
- $20,677
- − Mortgage interest
- −$8,402
- − Property taxes
- −$2,250
- − Insurance
- −$750
- − Repairs & maintenance
- −$1,654
- − Management
- −$1,654
- − Depreciation
- −$4,364
- Taxable income
- $1,603
- Est. tax owed @ 24.0%
- −$385
- After-tax cash flow
- $3,511/yr
For passive investors: Depreciation is non-cash, so a rental often shows a tax loss while cash-flowing — sheltering income. Rental losses are passive: they offset passive income freely, and up to $25,000/yr can offset ordinary (W-2) income if you actively participate and your MAGI is under $100k (phasing out to $0 by $150k); unused losses carry forward. On sale, claimed depreciation is recaptured at up to 25%, and gains may owe capital-gains tax (a 1031 exchange can defer both). Figures are a year-1 estimate at your 24.0% rate — not tax advice; consult a CPA.
Schools (NCES district)
- District
- Placer Union High
- NCES district ID
- 0630750
- Math proficiency
- 39% ▲ 1.00%
- Reading proficiency
- 72% ▲ 3.00%
- Median HH income
- $69,119
- Composite
- 49.04/100
- National rank
- #2060
- State rank
- #98 of 517 in CA
Livability — Foresthill
- Score
- 39/100
- State rank
- #1397
- US rank
- #27383
Category grades
Schools grade is shown separately in the Schools card above.
Census & demographics
- Population (ZIP)
- 6,934
Population outlook (Placer County) Hauer SSP2
- Today (2025)
- 422,709 people
- By 2030
- 444,249 · +5.1%
- By 2040
- 480,192 · +13.6%
- By 2050
- 506,390 · +19.8%
- By 2075
- 550,219 · +30.2%
- By 2100
- 547,760 · +29.6%
Race, ethnicity, and origin ACS 2023
- Neighborhood character
- Predominantly White (78%)
- Race & ethnicity
- White 78% Hispanic / Latino 17% Two or more races 14% Native American 3%
- Hispanic origin (detail)
- Mexican 11% Puerto Rican 2%
- Common ancestry
- Italian 7% Slovak 4% Portuguese 3%
- Foreign-born
- 4% · Canada, Jamaica
- Languages at home
- 93% English-only · Spanish 7%
Political lean MEDSL · Placer
- 2024 margin
- Lean R (+8.5) · D 44.3% · R 52.8% · Other 2.9%
- 2008→2024 swing
- +2.8pp toward D · 2008: -11.3pp · 2024: -8.5pp
- All cycles
- 2024: R+8.5 2020: R+6.7 2016: R+11.3 2012: R+20.1 2008: R+11.3
Not yet ingested
- Civics
- —
Market trends
- HPI YoY
- ▼ -190.65%
- Current HPI
- 235.5632
- Rent YoY
- —
- Metro
- —
- State GDP YoY
- ▲ 3.21%
- F500 in state
- 116
Industry mix (Fortune 500 HQ in CA)
| Industry | F500 HQs | Revenue |
|---|---|---|
| Technology | 27 | $1,492B |
|
||
| Financial Services | 3 | $174B |
|
||
| Retail | 3 | $44B |
|
||
| Insurance | 3 | $26B |
|
||
| Media / Entertainment | 2 | $115B |
|
||
| Pharmaceuticals / Biotech | 2 | $62B |
|
||
Cash-flow waterfall
monthlySold comps — $/sqft
last 12 mo · ≤1 miLoading sold comps…