10258 Anger Rd · Harrison, MI
Flood risk 5/10 · Moderate
- FEMA flood zone
- A
- Chance of flooding over 30 yrs
- 0.64%
- Est. flood insurance / yr
- $946 – $6,584
Fire risk 4/10 · Minor
- Est. fire insurance / yr
- $784 – $1,456
Heat risk 1/10 · Minimal
- Hot days now (above 93°F)
- 7 days/yr
- Hot days in 30 yrs
- 14 days/yr
Wind risk 1/10 · Minimal
- Chance of severe wind over 30 yrs
- —
Air-quality risk 2/10 · Minimal
- Unhealthy air days now
- 1 days/yr
- Unhealthy air days in 30 yrs
- 1 days/yr
Risk factors via First Street. Map © Google.
Why this score? — see what drove the B grade
The composite is a weighted blend of 9 inputs, each scored 0–100. Each bar is that input's sub-score; the figure is the points it added to the 100-point composite (weight × sub-score).
- Cash flow +30.0/30.0
- ARV discount +15.0/15.0
- DSCR +10.0/10.0
- 1% rule +7.4/10.0
- Livability +3.2/5.0
- Rent growth +2.5/5.0
- Condition / age +2.5/5.0
- Schools +1.8/10.0
- Appreciation +0.0/10.0
$65,000
🖨 Deal sheet (PDF) 📄 Offer letter ✓ Due diligence
Listing remarks MLS
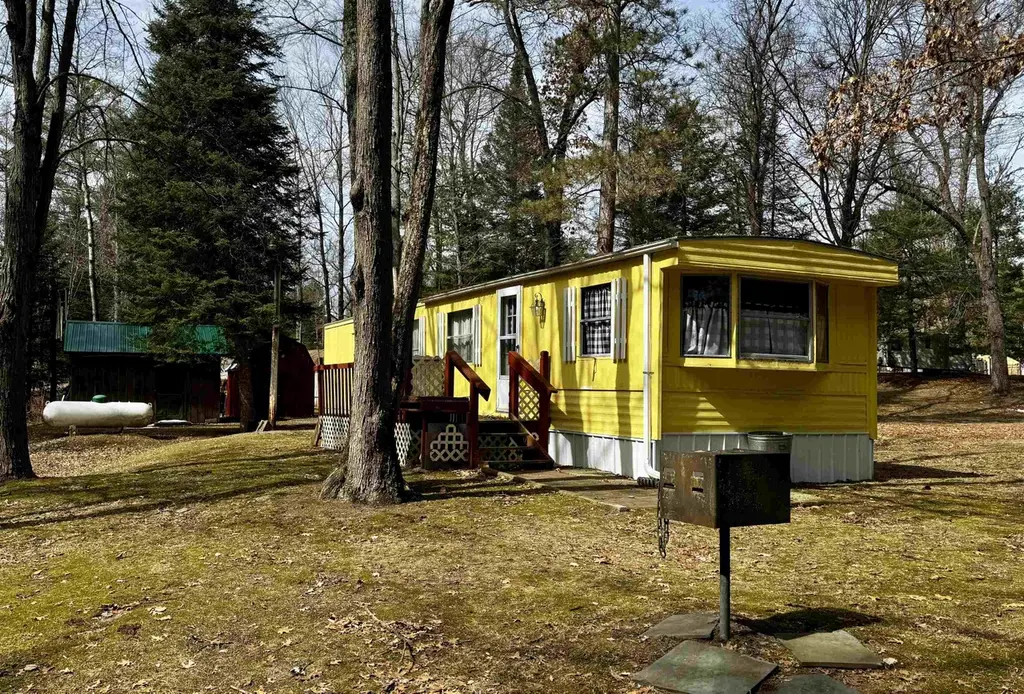
No reservation required when you own your own spot to relax and enjoy the weekend. Spend your days riding the trails and soaking in the peaceful setting this property has to offer. This pristine 2-bedroom, 1-bath single-wide trailer is in move-in condition and makes the perfect weekend getaway or up-north retreat. The sloping yard leads to a private setting along the water’s edge, creating a quiet place to unwind. Updates include new flooring and a new furnace in 2025. 2 Large Sheds Located just minutes from the Muskegon River and the trail system, this property is ready for you to start enjoying right away. PROPERTY IS CONTINGENT UPON 10262 ANGER RD SELLING PRIOR TO ITS SALE OR IN CONJUCTION WITH.
Key facts
- New furnace
- Trail system
- New flooring
Tags
Neighborhood map
What this means for you Summary
Snapshot
- This is a 2-bed/1.0-bath single-family listed at $65k.
Deal economics
- At list price, monthly cash flow is $-59 ($-708/yr) — negative.
- To cash-flow at today's rent, offer at most $55k (16.0% below list).
- Meets the 1% rule at list price ($804 rent vs $65k).
- Recommended offer: $55k (16.0% below list) — sets the bar for cash-flow.
- Cap rate 11.0% vs local median 3.5% in Harrison — top-decile yield for the area; either an underpriced asset or a hidden risk that comps aren't pricing in. Stress-test before assuming the spread holds.
Location & tenants
- Location reads 65/100 on livability (#471 in MI) — a middle-class / working-renter tenant base. Strengths: cost of living A+, health & safety A, crime A-; Watch: amenities F, commute F, employment F.
- Harrison Community Schools (town): math 17% / reading 28% proficiency, ranked #457 of 540 in MI (top 85%) — low school quality limits family demand, transient renter base, plan for 1-2y turnover; 65% free/reduced lunch — lower-income household profile, screen leases tightly.
- Zoned schools: Robert M Larson Elementary School (606 students, 85% FRL); Harrison Middle School (math 21% / reading 34%, grade F, #363 of 493 statewide, top 75%, 282 students, 81% FRL); Harrison Community High School (math 12% / reading 37%, grade F, #481 of 713 statewide, top 81%, 341 students, 73% FRL).
- Market conditions: 247 active listings in the ZIP; 77 units permitted in Clare County in 2024 (0 in 5+ unit buildings).
Forward outlook
- Local home prices are declining (-3.0%/yr); year-one equity from $449 of loan paydown is wiped out by about $2k of value loss. Plan a longer hold.
- Clare County population projected at -20% by 2050 — secular population decline; favor cash flow + early exit over multi-decade hold.
Negotiation context
- It's been on market 87 days — a 6% lower offer ($61k) is reasonable based on typical stale-listing flexibility.
- Current owner paid $15k; list at $65k implies a 333% gain — meaningful room to come down on a strong offer.
Risks & watch-outs
- Watch-outs: flood insurance adds $314/mo.
- Climate carrying-cost: in FEMA flood zone A (mandatory federal flood insurance) — expect insurance premiums to compound above CPI over the hold.
Questions for the listing agent
- What do current leases actually rent for vs. the listed asking? Can we see a recent rent roll and the last 12 months of T-12 income?
- It's been on market 87 days. Have you received any prior offers? Is the seller open to a 16% concession, seller financing, or rate buy-down credit?
- What's the actual annual flood-insurance premium (NFIP or private), and is the property in a SFHA with mandatory coverage?
- Why hasn't it sold? Are there any deal-killer items the seller is aware of (foundation, flood, title, zoning, code violations)?
- Is there a deadline driving the sale (1031 exchange, divorce, estate, relocation)? That informs how much negotiation room exists.
- Schools are D-rated, which usually means shorter tenancies and higher turnover. Who's the typical renter profile here, and what's been the actual vacancy rate?
- What's the average days-on-market for RENTAL listings here right now (not sales)? A rising rental-DOM trend means longer vacancies and softer asking-rent achievability than the comps imply.
- What's the recent tenant-quality profile in this submarket — average credit score on applications, eviction rate, late-payment / NSF rate, and stable-employment percentage? A property-management company in the area should have these aggregated.
- How much new for-sale + rental construction is in the pipeline within 1–3 miles? Heavy new supply typically softens prices + rents 12–24 months out; constrained supply supports both.
Investment metrics
- 1% rule
- 1.24% ✓
- Cap rate
- 11.00%
- Cash-on-cash
- 16.80%
- DSCR
- 1.75
- GRM
- 6.7
CMA / ARV
- ARV (median comp)
- $85,017
- List price
- $65,000
- Delta
- -23.55%
- Verdict
- UNDERPRICED
- Comps
- 4 within 1.0 mi
Show comp detail 1 sale within ~0.75 mi
| Address | Dist | Beds/Ba | Sqft | Sold | Price | $/sf | Match |
|---|---|---|---|---|---|---|---|
| 10340 N Finley Lake Ave | 0.61mi | 2/1.0 | 545 (-9%) | 5mo | $64,000 | $117 | 52 |
Match score weights: distance 35% · size 25% · config 20% · recency 20%. Top-matched comps best support the ARV.
Projected returns pro-forma
-3.0% appreciation · 3.0% rent growth · sell at horizon
- IRR
- -22.5%
- Equity multiple
- 0.22×
- Total profit
- $-14,127
- Equity at exit
- $9,692
- IRR
- -15.9%
- Equity multiple
- 0.09×
- Total profit
- $-16,478
- Equity at exit
- $5,620
Cash invested: $18,200 (down + closing). Projections, not guarantees.
Landlord ↔ Tenant lean methodology
- Overall (STATE)
- 62 Landlord-Friendly
- State Michigan
- 62 Landlord-Friendly · EVEN
- County
- — inherits STATE
- City
- — inherits STATE
ZIP-level market 48625
- Home prices YoY
- -25.5%
- Active inventory
- 247
- Price-to-rent
- 6.7×
Monthly cashflow live
- Estimated rent
- $804 medium interval (Pro) →
- Mortgage (P&I)
- −$341
- Tax from tax record
- −$13 /mo · $153/yr
- Insurance
- −$27
- Flood insurance flood zone
- −$314 /mo · $3,765/yr
- HOA
- −$0
- Vacancy / Maint / Mgmt
- −$169
- Net cashflow
- $-59
Break-even live
Sensitivity live
| Price | -10% $-22 | -5% $-41 | +0% $-59 | +5% $-77 | +10% $-96 |
|---|---|---|---|---|---|
| Rent | -10% $-123 | -5% $-91 | +0% $-59 | +5% $-27 | +10% $5 |
| Rate | -1.0pp $-26 | -0.5pp $-42 | base $-59 | +0.5pp $-76 | +1.0pp $-93 |
UW: 25.0% down · 7.5% · 30yr · 1.5% tax · 5.0% vac · 8.0% maint · 8.0% mgmt
Financing live
Cash to close
- Down payment
- $16,250
- Closing costs
- $1,950
- Reserves months
- —
- Total cash needed
- —
Loan-product check · same deal, 3 products live
Conventional
25% down · 7.5% · 30yr
- Down + closing
- —
- Monthly P&I
- —
- Monthly cashflow
- —
- DSCR
- —
- Eligible?
- —
Personal DTI + credit; lowest rate.
DSCR
20% down · 8.5% · 30yr
- Down + closing
- —
- Monthly P&I
- —
- Monthly cashflow
- —
- DSCR
- —
- Eligible?
- —
No personal income docs; deal must DSCR.
Hard money
10% down · 12.0% · 12mo
- Down + closing
- —
- Monthly P&I
- —
- Monthly cashflow
- —
- DSCR
- —
- Eligible?
- —
Short-term bridge; refi at stabilization.
Listing history 20 events
-
2026-06-22days on market $65,000 Active 87 DOM
-
2026-06-21days on market $65,000 Active 86 DOM
-
2026-06-21days on market $65,000 Active 85 DOM
-
2026-06-18days on market $65,000 Active 83 DOM
-
2026-06-17days on market $65,000 Active 82 DOM
-
2026-06-16days on market $65,000 Active 81 DOM
-
2026-06-15days on market $65,000 Active 80 DOM
-
2026-06-13days on market $65,000 Active 78 DOM
-
2026-06-12days on market $65,000 Active 77 DOM
-
2026-06-09days on market $65,000 Active 74 DOM
-
2026-06-08days on market $65,000 Active 73 DOM
-
2026-06-07days on market $65,000 Active 72 DOM
-
2026-06-07days on market $65,000 Active 71 DOM
-
2026-06-04days on market $65,000 Active 68 DOM
-
2026-06-02days on market $65,000 Active 67 DOM
-
2026-06-01days on market $65,000 Active 66 DOM
-
2026-05-31days on market $65,000 Active 65 DOM
-
2026-05-31days on market $65,000 Active 64 DOM
-
2026-03-27$65,000 Active 713-char remark
Show marketing remark (713 chars)
No reservation required when you own your own spot to relax and enjoy the weekend. Spend your days riding the trails and soaking in the peaceful setting this property has to offer. This pristine 2-bedroom, 1-bath single-wide trailer is in move-in condition and makes the perfect weekend getaway or up-north retreat. The sloping yard leads to a private setting along the water’s edge, creating a quiet place to unwind. Updates include new flooring and a new furnace in 2025. 2 Large Sheds Located just minutes from the Muskegon River and the trail system, this property is ready for you to start enjoying right away. PROPERTY IS CONTINGENT UPON 10262 ANGER RD SELLING PRIOR TO ITS SALE OR IN CONJUCTION WITH.
-
2021-10-13soldstatus $15,000
ⓘ Source: listings_history table (triggers on properties + properties_extension) + one-shot
backfill from property_details.listing_events for pre-trigger history.
Tax reassessment forecast MI · Partial reset (capped growth)
- Current annual tax
- $153 · $13/mo
- Projected year-2 tax
- $577 · $48/mo
- Expected delta
- +$424/yr (+$35/mo · 277.8%)
ⓘ Screening estimate from a state-policy table — verify with the county assessor before closing.
Climate risk First Street
- Flood 5/10 Major FEMA zone A · 64% chance over 30 yrs
- Wildfire 4/10 Moderate
- Heat 1/10 Low 7 d/yr ≥93°F today · 14 d/yr by 30 yrs out
- Wind 1/10 Low
- Air quality 2/10 Low 1 unhealthy d/yr today · 1 by 30 yrs out
Nearby sold comps map
Loading sold comps map…
Walkable amenities ~0.75 mi
Loading nearby amenities…
Taxation est. · year 1
- Rental income
- $9,652
- − Mortgage interest
- −$3,641
- − Property taxes
- −$153
- − Insurance
- −$4,090
- − Repairs & maintenance
- −$772
- − Management
- −$772
- − Depreciation
- −$1,891
- Taxable loss
- −$1,667
- Est. tax savings @ 24.0%
- +$400
- After-tax cash flow
- $-308/yr
For passive investors: Depreciation is non-cash, so a rental often shows a tax loss while cash-flowing — sheltering income. Rental losses are passive: they offset passive income freely, and up to $25,000/yr can offset ordinary (W-2) income if you actively participate and your MAGI is under $100k (phasing out to $0 by $150k); unused losses carry forward. On sale, claimed depreciation is recaptured at up to 25%, and gains may owe capital-gains tax (a 1031 exchange can defer both). Figures are a year-1 estimate at your 24.0% rate — not tax advice; consult a CPA.
Schools (NCES district)
- District
- Harrison Community Schools
- NCES district ID
- 2617820
- Math proficiency
- 17% ▬ 0.00%
- Reading proficiency
- 28% ▼ -5.00%
- Median HH income
- $30,377
- Composite
- 18.07/100
- National rank
- #8977
- State rank
- #457 of 540 in MI
Livability — Harrison
- Score
- 65/100
- State rank
- #471
- US rank
- #13368
Category grades
Schools grade is shown separately in the Schools card above.
Census & demographics
- Population (ZIP)
- 12,939
Population outlook (Clare County) Hauer SSP2
- Today (2025)
- 29,283 people
- By 2030
- 28,199 · -3.7%
- By 2040
- 25,722 · -12.2%
- By 2050
- 23,372 · -20.2%
- By 2075
- 18,569 · -36.6%
- By 2100
- 14,320 · -51.1%
Race, ethnicity, and origin ACS 2023
- Neighborhood character
- Predominantly White (93%)
- Race & ethnicity
- White 93% Two or more races 4% Hispanic / Latino 3%
- Common ancestry
- Romanian 6% Lithuanian 4% Scotch-Irish 2%
- Foreign-born
- 0%
- Languages at home
- 99% English-only · Spanish 1% German/W. Germanic 1%
Political lean MEDSL · Clare
- 2024 margin
- Solid R (+37.6) · D 30.5% · R 68.1% · Other 1.4%
- 2008→2024 swing
- -42.4pp toward R · 2008: 4.8pp · 2024: -37.6pp
- All cycles
- 2024: R+37.6 2020: R+34.8 2016: R+31.8 2012: R+4.8 2008: D+4.8
Not yet ingested
- Civics
- —
Market trends
- HPI YoY
- ▼ -80.38%
- Current HPI
- 234.9586
- Rent YoY
- —
- Metro
- —
- State GDP YoY
- ▲ 1.37%
- F500 in state
- 28
Industry mix (Fortune 500 HQ in MI)
| Industry | F500 HQs | Revenue |
|---|---|---|
| Automotive Parts | 3 | $48B |
|
||
| Automotive | 2 | $372B |
|
||
| Chemicals | 1 | $45B |
|
||
| Automotive Retail | 1 | $29B |
|
||
| Healthcare / Medical Devices | 1 | $23B |
|
||
| Automotive Technology | 1 | $20B |
|
||
Price history
+333.3% since first listed2 events — show timeline
- 2026-03-27 Listed $65,000 MiRealSource-MiMLS
- 2021-10-13 Sold (Public Records) $15,000 Public Records
Property tax history
-1.8%/yrLatest (2025): $153 · -76.8% YoY. Source: county tax records.
Cash-flow waterfall
monthlySold comps — $/sqft
last 12 mo · ≤1 miLoading sold comps…