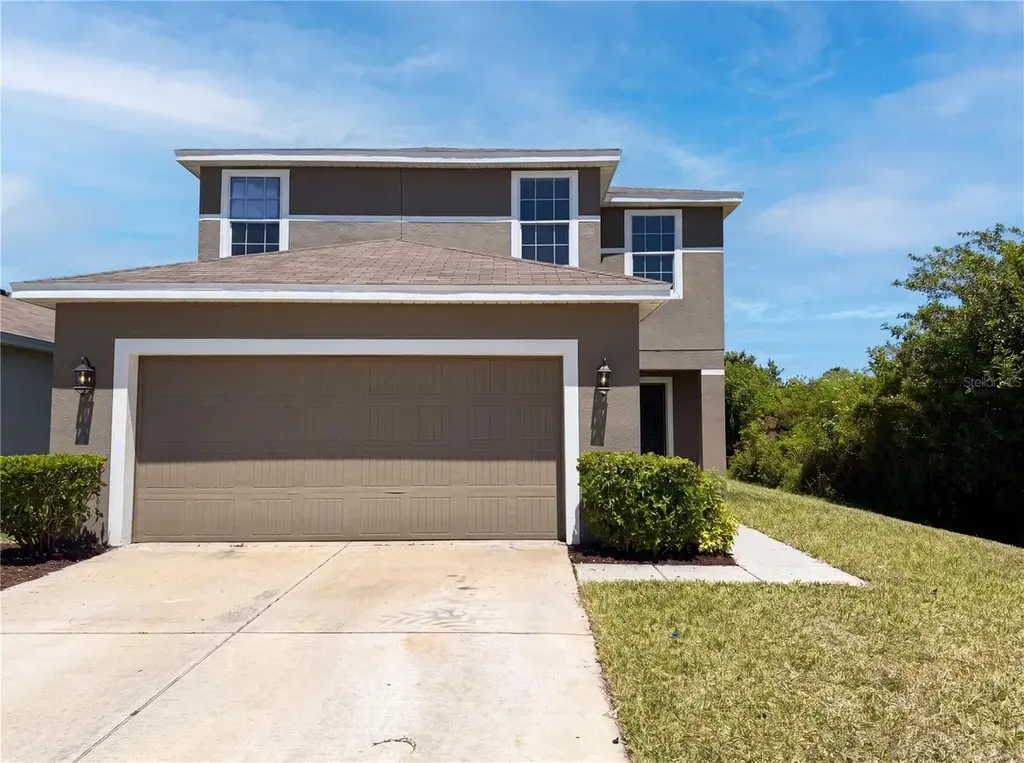
14405 Scottburgh Glen Dr · Balm, FL
Flood risk 1/10 · Minimal
- FEMA flood zone
- X (unshaded)
- Chance of flooding over 30 yrs
- 0.0%
- Est. flood insurance / yr
- $507 – $1,088
Fire risk 5/10 · Moderate
- Est. fire insurance / yr
- $947 – $1,759
Heat risk 10/10 · Severe
- Hot days now (above 109°F)
- 7 days/yr
- Hot days in 30 yrs
- 28 days/yr
Wind risk 10/10 · Severe
- Chance of severe wind over 30 yrs
- 99.0%
Air-quality risk 3/10 · Minor
- Unhealthy air days now
- 3 days/yr
- Unhealthy air days in 30 yrs
- 3 days/yr
Risk factors via First Street. Map © Google.
Why this score? — see what drove the D grade
The composite is a weighted blend of 9 inputs, each scored 0–100. Each bar is that input's sub-score; the figure is the points it added to the 100-point composite (weight × sub-score).
- Cash flow +10.8/30.0
- ARV discount +7.5/15.0
- Schools +4.2/10.0
- Appreciation +3.8/10.0
- 1% rule +3.5/10.0
- Livability +3.2/5.0
- DSCR +3.1/10.0
- Condition / age +2.5/5.0
- Rent growth +1.9/5.0
$296,000
🖨 Deal sheet (PDF) 📄 Offer letter ✓ Due diligence
Listing remarks
Meet the well-appointed residence at 14405 Scottburgh Glen Dr, where the kitchen features all stainless steel appliances, an accent backsplash, and a functional island. Outdoor living is extended by a covered patio, complementing the property's fresh exterior paint and recent partial flooring replacement. This property combines modern style and functional comfort seamlessly. Included 100-Day Home Warranty with buyer activation
Key facts
- Functional island
- Covered patio
- Fresh exterior paint
Tags
Property features AI
Finance
- Other: Community pool
- Financial info: CDD present; Lease restrictions apply
- HOA & community: Has HOA managed by McNeil Management Service; Annual association fee $115 (monthly equivalent $9.58); Association fee covers pool and other amenities; Association approval required; Pets allowed
Exterior
- Parking: Driveway; Attached garage (2 spaces)
- Security: Owned security system
- Utilities: Public water; Public sewer; Electricity available; Water service available
- Home design: Single family residence; Two levels; Faces south
- Construction: Stucco construction; Shingle roof; Slab foundation; Built as residential single-family
- Exterior features: Other exterior features; Asphalt road access; Lot approximately 0.11 acres (about 446 m²); No waterfront
Interior
- Kitchen: Dishwasher; Microwave; Electric water heater; Other kitchen appliances
- Bedrooms: 3 bedrooms
- Flooring: Carpet; Tile; Vinyl
- Bathrooms: 2 full bathrooms; 1 half bathroom
- Heating & cooling: Central heating (electric); Central air conditioning
- Interior features: Living room/dining room combo; Security system (owned)
- Laundry & utility: Laundry closet; Upper level laundry; Other laundry features
Neighborhood map
What this means for you Summary
Snapshot
- This is a 3-bed/3.0-bath single-family listed at $296k.
Deal economics
- At list price, monthly cash flow is $-135 ($-2k/yr) — negative.
- To cash-flow at today's rent, offer at most $272k (8.1% below list).
- To meet the 1% rule (rent ≥ 1% of price), the offer needs to be $253k (14.6% below list).
- Recommended offer: $253k (14.6% below list) — sets the bar for 1% rule.
Location & tenants
- Location reads 63/100 on livability (#742 in FL) — a middle-class / working-renter tenant base. Strengths: crime A+, employment A+, housing A+; Watch: amenities F, commute F, health & safety F.
- Hillsborough (suburban): math 47% / reading 50% proficiency, ranked #41 of 73 in FL (top 56%) — families likely to look elsewhere, expect single-tenant / working-renter base with shorter leases.
- Zoned schools: Belmont Elementary School (math 42% / reading 45%, grade F, #1,345 of 2,144 statewide, top 64%, 987 students, 44% FRL); Shields Middle School (math 29% / reading 27%, grade F, #486 of 571 statewide, top 86%, 1,867 students, 68% FRL); Lennard High School (math 30% / reading 46%, grade F, #328 of 667 statewide, top 50%, 2,404 students, 47% FRL) — zoned schools at 53% FRL track the district average.
- Zoned-school proficiency averages 36% at this address vs 48% district-wide (-12 pts) — the specific schools serving this property underperform the Hillsborough average; the district grade overstates school quality for this exact location.
- Market conditions: Rents soft (-2.5%/yr); 689 active listings in the ZIP; 30 comparable units currently listed for rent nearby; rentals at typical pace (median 20d on market — plan ~3-4 weeks tenant-placement turnaround); solid renter incomes; 9,053 units permitted in Hillsborough County in 2024 (4,555 in 5+ unit buildings).
- This rent runs 31% of the median local income ($98k/yr) — at the standard rent-burdened threshold; future hikes will face affordability resistance.
Forward outlook
- Local home prices are declining (-2.4%/yr); year-one equity from $2k of loan paydown is wiped out by about $7k of value loss. Plan a longer hold.
- Hillsborough County population projected at +37% by 2050 — long-run rental-demand tailwind backs the buy-and-hold thesis.
Negotiation context
- It's been on market 41 days — a 3% lower offer ($287k) is reasonable based on typical stale-listing flexibility.
- Current owner paid $253k; 17% above their basis — modest negotiation headroom, anchor on the comps not their cost.
Risks & watch-outs
- Climate carrying-cost: severe wind risk, 99% chance of damaging wind over 30y; moderate wildfire risk; extreme-heat days projected 7→28/yr by 2055 (HVAC capex compounding) — expect insurance premiums to compound above CPI over the hold.
Questions for the listing agent
- What do current leases actually rent for vs. the listed asking? Can we see a recent rent roll and the last 12 months of T-12 income?
- It's been on market 41 days. Have you received any prior offers? Is the seller open to a 15% concession, seller financing, or rate buy-down credit?
- What does the HOA fee cover, when was the last increase, and are there any pending special assessments or reserve-fund shortfalls?
- Is there a deadline driving the sale (1031 exchange, divorce, estate, relocation)? That informs how much negotiation room exists.
- Schools are F-rated, which usually means shorter tenancies and higher turnover. Who's the typical renter profile here, and what's been the actual vacancy rate?
- The area grade is low — what's the realistic commute time and amenity access for the typical tenant pool here? Any planned neighborhood developments (good or bad) we should know about?
- What's the average days-on-market for RENTAL listings here right now (not sales)? A rising rental-DOM trend means longer vacancies and softer asking-rent achievability than the comps imply.
- What's the recent tenant-quality profile in this submarket — average credit score on applications, eviction rate, late-payment / NSF rate, and stable-employment percentage? A property-management company in the area should have these aggregated.
- How much new for-sale + rental construction is in the pipeline within 1–3 miles? Heavy new supply typically softens prices + rents 12–24 months out; constrained supply supports both.
Investment metrics
- 1% rule
- 0.85% ✗
- Cap rate
- 5.74%
- Cash-on-cash
- -1.96%
- DSCR
- 0.91
- GRM
- 9.8
CMA / ARV
No comps found within radius.
Projected returns pro-forma
-2.35% appreciation · 0.0% rent growth · sell at horizon
- IRR
- -18.4%
- Equity multiple
- 0.33×
- Total profit
- $-55,737
- Equity at exit
- $52,828
- IRR
- -16.9%
- Equity multiple
- 0.03×
- Total profit
- $-80,739
- Equity at exit
- $40,779
Cash invested: $82,880 (down + closing). Projections, not guarantees.
Landlord ↔ Tenant lean methodology
- Overall (STATE)
- 87 Strongly Landlord-Friendly
- State Florida
- 87 Strongly Landlord-Friendly · R+3
- County
- — inherits STATE
- City
- — inherits STATE
ZIP-level market 33598
- Home prices YoY
- -0.9%
- Rents YoY
- -2.5%
- Active inventory
- 689
- Price-to-rent
- 9.8×
Monthly cashflow live
- Estimated rent
- $2,527 high interval (Pro) →
- Mortgage (P&I)
- −$1,552
- Tax from tax record
- −$447 /mo · $5,369/yr
- Insurance
- −$123
- HOA
- −$9
- Vacancy / Maint / Mgmt
- −$531
- Net cashflow
- $-135
Break-even live
Sensitivity live
| Price | -10% $32 | -5% $-52 | +0% $-135 | +5% $-219 | +10% $-303 |
|---|---|---|---|---|---|
| Rent | -10% $-335 | -5% $-235 | +0% $-135 | +5% $-36 | +10% $64 |
| Rate | -1.0pp $14 | -0.5pp $-60 | base $-135 | +0.5pp $-212 | +1.0pp $-290 |
UW: 25.0% down · 7.5% · 30yr · 1.5% tax · 5.0% vac · 8.0% maint · 8.0% mgmt
Financing live
Cash to close
- Down payment
- $74,000
- Closing costs
- $8,880
- Reserves months
- —
- Total cash needed
- —
Loan-product check · same deal, 3 products live
Conventional
25% down · 7.5% · 30yr
- Down + closing
- —
- Monthly P&I
- —
- Monthly cashflow
- —
- DSCR
- —
- Eligible?
- —
Personal DTI + credit; lowest rate.
DSCR
20% down · 8.5% · 30yr
- Down + closing
- —
- Monthly P&I
- —
- Monthly cashflow
- —
- DSCR
- —
- Eligible?
- —
No personal income docs; deal must DSCR.
Hard money
10% down · 12.0% · 12mo
- Down + closing
- —
- Monthly P&I
- —
- Monthly cashflow
- —
- DSCR
- —
- Eligible?
- —
Short-term bridge; refi at stabilization.
Rent comps 30 comps
| Address | Beds | Baths | Sqft | Rent | $/sqft | DOM | Units | Dist |
|---|---|---|---|---|---|---|---|---|
| 14525 Scottburgh Glen Dr Wimauma, FL | 3.0 | 2.0 | 1704 | $3,300 | $1.94 | 24d | 1 | 0.31mi |
| 14217 Poke Ridge Dr Riverview, FL | 3.0 | 2.5 | 1913 | $2,511 | $1.31 | 7d | 1 | 0.50mi |
| 13924 Arbor Pines Dr Riverview, FL | 4.0 | 2.5 | 1920 | $2,545 | $1.33 | 26d | 1 | 0.51mi |
| 14207 Poke Ridge Dr Riverview, FL | 3.0 | 2.5 | 1897 | $2,600 | $1.37 | 1d | 1 | 0.54mi |
| 14207 Poke Ridge Dr Riverview, FL | 3.0 | 3.0 | 1897 | $2,350 | $1.24 | 26d | 1 | 0.54mi |
| 10237 Carloway Hills Dr Wimauma, FL | 4.0 | 2.5 | 1914 | $2,526 | $1.32 | 1d | 1 | 0.61mi |
| 14906 Imperial Purple Ln Wimauma, FL | 3.0 | 2.0 | 1771 | $2,250 | $1.27 | 20d | 1 | 0.72mi |
| 14906 Imperial Purple Ln Wimauma, FL | 3.0 | 2.0 | 1561 | $2,250 | $1.44 | 7d | 1 | 0.72mi |
| 10438 Carloway Hills Dr Wimauma, FL | 4.0 | 3.0 | 1860 | $2,500 | $1.34 | 26d | 1 | 0.75mi |
| 14435 Barley Field Dr Wimauma, FL | 4.0 | 2.0 | 2046 | $2,231 | $1.09 | 16d | 1 | 0.82mi |
| 14471 Stagedoor Johnny Pl Ruskin, FL | 1.0–3.0 | 1.0–2.0 | 1138 | $2,344 | $2.06 | 0d | 20 | 1.06mi |
| 14452 Easy Goer St Ruskin, FL | 3.0 | 2.5 | 1701 | $2,250 | $1.32 | 14d | 1 | 1.09mi |
| 14010 Hollow Leaf Pl Riverview, FL | 3.0 | 2.0 | 1670 | $2,195 | $1.31 | 12d | 1 | 1.09mi |
| 14409 Easy Goer St Ruskin, FL | 3.0 | 2.5 | 1666 | $1,800 | $1.08 | 26d | 1 | 1.11mi |
| 14339 Easy Goer St Ruskin, FL | 3.0 | 2.5 | 1701 | $2,350 | $1.38 | 24d | 1 | 1.11mi |
| 14442 Editors Note St Ruskin, FL | 3.0 | 2.5 | 1701 | $2,100 | $1.23 | 7d | 1 | 1.13mi |
| 10405 Apollo Manor Cir Riverview, FL | 1.0–3.0 | 1.0–2.0 | 1116 | $3,163 | $2.83 | 1d | 30 | 1.24mi |
| 10206 Stedfast Ct Ruskin, FL | 3.0 | 2.0 | 2051 | $2,650 | $1.29 | 26d | 1 | 1.30mi |
| 11164 Golden Silence Dr Riverview, FL | 3.0 | 2.0 | 1930 | $2,050 | $1.06 | 26d | 1 | 1.33mi |
| 10454 Shady Preserve Dr Riverview, FL | 2.0 | 3.0 | 1642 | $2,000 | $1.22 | 26d | 1 | 1.36mi |
| 10124 Newminster Loop Ruskin, FL | 3.0 | 2.0 | 1340 | $2,150 | $1.60 | 1d | 1 | 1.40mi |
| 10313 Celtic Ash Dr Ruskin, FL | 3.0 | 2.0 | 1394 | $2,005 | $1.44 | 18d | 1 | 1.41mi |
| 10805 Australian Pine Dr Riverview, FL | 3.0 | 2.0 | 1897 | $2,350 | $1.24 | 26d | 1 | 1.42mi |
| 13625 Silver Charm Ct Riverview, FL | 4.0 | 2.5 | 1907 | $2,350 | $1.23 | 26d | 1 | 1.42mi |
| 11025 Golden Silence Dr Riverview, FL | 3.0 | 2.5 | 1785 | $2,210 | $1.24 | 16d | 1 | 1.45mi |
| 11009 Golden Silence Dr Riverview, FL | 4.0 | 2.5 | 2154 | $2,800 | $1.30 | 26d | 1 | 1.46mi |
| 13465 Fladgate Mark Dr Riverview, FL | 4.0 | 2.0 | 1544 | $2,045 | $1.32 | 1d | 1 | 1.47mi |
| 13465 Fladgate Mark Dr Riverview, FL | 4.0 | 2.0 | 1544 | $2,045 | $1.32 | 7d | 1 | 1.47mi |
| 14268 Riva Ridge Pl Sun City Center, FL | 3.0 | 2.5 | 1993 | $2,197 | $1.10 | 26d | 1 | 1.49mi |
| 10121 Tabasco Cat Ct Sun City Center, FL | 3.0 | 2.5 | 1993 | $2,095 | $1.05 | 26d | 1 | 1.49mi |
HOA detail
- Monthly dues
- $9 · $108/yr
Listing history 4 events
-
2026-06-01status $296,000 Pending 41 DOM
-
2026-05-31days on market $296,000 Active 41 DOM
-
2026-04-20$296,000 Active 430-char remark
-
2026-03-10soldstatus $252,800
ⓘ Source: listings_history table (triggers on properties + properties_extension) + one-shot
backfill from property_details.listing_events for pre-trigger history.
Tax reassessment forecast FL · Resets to sale price
- Current annual tax
- $5,369 · $447/mo
- Projected year-2 tax
- $5,369 · $447/mo
- Expected delta
- $0/yr ($0/mo · 0.0%)
ⓘ Screening estimate from a state-policy table — verify with the county assessor before closing.
Climate risk First Street
- Flood 1/10 Low FEMA zone X (unshaded) · 0% chance over 30 yrs
- Wildfire 5/10 Major
- Heat 10/10 Extreme 7 d/yr ≥109°F today · 28 d/yr by 30 yrs out
- Wind 10/10 Extreme 99% chance of damaging wind over 30 yrs
- Air quality 3/10 Moderate 3 unhealthy d/yr today · 3 by 30 yrs out
Nearby sold comps map
Loading sold comps map…
Walkable amenities ~0.75 mi
Loading nearby amenities…
Taxation est. · year 1
- Rental income
- $30,327
- − Mortgage interest
- −$16,581
- − Property taxes
- −$5,369
- − Insurance
- −$1,480
- − Repairs & maintenance
- −$2,426
- − Management
- −$2,426
- − HOA
- −$108
- − Depreciation
- −$8,611
- Taxable loss
- −$6,674
- Est. tax savings @ 24.0%
- +$1,602
- After-tax cash flow
- $-24/yr
For passive investors: Depreciation is non-cash, so a rental often shows a tax loss while cash-flowing — sheltering income. Rental losses are passive: they offset passive income freely, and up to $25,000/yr can offset ordinary (W-2) income if you actively participate and your MAGI is under $100k (phasing out to $0 by $150k); unused losses carry forward. On sale, claimed depreciation is recaptured at up to 25%, and gains may owe capital-gains tax (a 1031 exchange can defer both). Figures are a year-1 estimate at your 24.0% rate — not tax advice; consult a CPA.
Schools (NCES district)
- District
- Hillsborough
- NCES district ID
- 1200870
- Math proficiency
- 47% ▼ -8.00%
- Reading proficiency
- 50% ▼ -4.00%
- Median HH income
- $50,622
- Composite
- 41.6/100
- National rank
- #3435
- State rank
- #41 of 73 in FL
Livability — Balm
- Score
- 63/100
- State rank
- #742
- US rank
- #16016
Category grades
Schools grade is shown separately in the Schools card above.
Census & demographics
- Census place
- Balm, FL
- County
- Hillsborough County · 1,540,968 people
- City population
- 196
- Metro
- Tampa-St. Petersburg-Clearwater, FL
- Population (ZIP)
- 32,820
- Household income
- $97,520
- Rent vs Own
- Severe rent burden
- 149.0
Population outlook (Hillsborough County) Hauer SSP2
- Today (2025)
- 1,607,022 people
- By 2030
- 1,733,968 · +7.9%
- By 2040
- 1,979,565 · +23.2%
- By 2050
- 2,203,427 · +37.1%
- By 2075
- 2,667,893 · +66.0%
- By 2100
- 2,891,558 · +79.9%
Race, ethnicity, and origin ACS 2023
- Neighborhood character
- Diverse neighborhood (Simpson 0.67)
- Race & ethnicity
- White 40% Hispanic / Latino 39% Black 14% Two or more races 11% Asian 2%
- Hispanic origin (detail)
- Mexican 26% Puerto Rican 3% Cuban 1%
- Common ancestry
- Romanian 2% Scotch-Irish 2% Lithuanian 1%
- Foreign-born
- 23% · Canada, Jamaica, Guatemala
- Languages at home
- 62% English-only · Spanish 35% Other Indo-European 1% Arabic 1%
Political lean MEDSL · Hillsborough
- 2024 margin
- Toss-up / Even · D 47.8% · R 50.9% · Other 1.3%
- 2008→2024 swing
- -10.2pp toward R · 2008: 7.1pp · 2024: -3.1pp
- All cycles
- 2024: R+3.1 2020: D+6.9 2016: D+6.8 2012: D+6.7 2008: D+7.1
Not yet ingested
- Civics
- —
Market trends
- HPI YoY
- ▼ -2.35%
- Current HPI
- 271.8552
- Rent YoY
- ▼ -2.50%
- Metro
- Tampa-St. Petersburg-Clearwater, FL
- State GDP YoY
- ▲ 3.28%
- F500 in state
- 36
Industry mix (Fortune 500 HQ in FL)
| Industry | F500 HQs | Revenue |
|---|---|---|
| Industrial Technology | 2 | $29B |
|
||
| Insurance | 2 | $17B |
|
||
| Retail | 1 | $60B |
|
||
| Technology Distribution | 1 | $58B |
|
||
| Homebuilding | 1 | $35B |
|
||
| Technology Manufacturing | 1 | $35B |
|
||
Price history
+17.1% since first listed3 events — show timeline
- 2026-05-31 Pending — Stellar MLS as Distributed by MLS Grid
- 2026-04-20 Listed $296,000 Stellar MLS as Distributed by MLS Grid
- 2026-03-10 Sold (Public Records) $252,800 Public Records
Property tax history
+9.6%/yrLatest (2025): $5,369 · +7.7% YoY. Source: county tax records.
Cash-flow waterfall
monthlySold comps — $/sqft
last 12 mo · ≤1 miLoading sold comps…