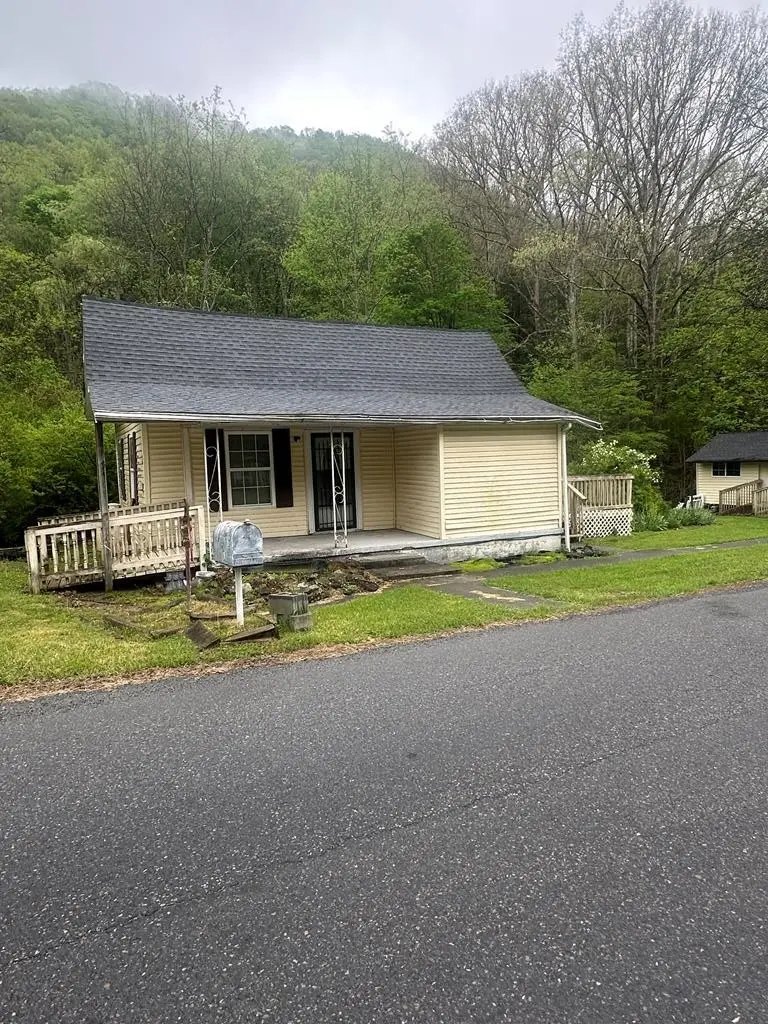
861 Allison Gap Rd · Allison Gap, VA
Flood risk 10/10 · Severe
- FEMA flood zone
- X (unshaded)
- Chance of flooding over 30 yrs
- 0.99%
- Est. flood insurance / yr
- $507 – $1,088
Fire risk 4/10 · Minor
- Est. fire insurance / yr
- $666 – $1,236
Heat risk 3/10 · Minor
- Hot days now (above 95°F)
- 8 days/yr
- Hot days in 30 yrs
- 24 days/yr
Wind risk 2/10 · Minimal
- Chance of severe wind over 30 yrs
- —
Air-quality risk 1/10 · Minimal
- Unhealthy air days now
- 0 days/yr
- Unhealthy air days in 30 yrs
- 0 days/yr
Risk factors via First Street. Map © Google.
Why this score? — see what drove the B+ grade
The composite is a weighted blend of 9 inputs, each scored 0–100. Each bar is that input's sub-score; the figure is the points it added to the 100-point composite (weight × sub-score).
- Cash flow +30.0/30.0
- 1% rule +10.0/10.0
- DSCR +10.0/10.0
- ARV discount +9.9/15.0
- Appreciation +5.1/10.0
- Schools +4.5/10.0
- Rent growth +2.5/5.0
- Livability +2.5/5.0
- Condition / age +2.5/5.0
$39,000
🖨 Deal sheet (PDF) 📄 Offer letter ✓ Due diligence
Listing remarks
Investor Special on 3.9 acres! Opportunity awaits with this 2 bedroom, 1 bath home situated on 3.9 acres. The home has been completely gutted and is ready for your vision, perfect for a full renovation or custom rebuild. Property features an outbuilding for storage or workshop space and a peaceful stream running behind the home through the land. With plenty of room to expand or enjoy nature, this is a great investment or project property. Being sold as-is. Shingled roof replaced 2 years ago.
Key facts
- 3.9 acres
- Peaceful stream
- 3.9 acre lot
Tags
Property features AI
Exterior
- Utilities: Public water; Public sewer
- Home design: Single family residence; One story; Residential property in the Poor Valley subdivision
- Construction: Vinyl siding; Shingle roof
- Exterior features: Deck; Creek on the property; Irregular, wooded lot
Interior
- Flooring: Laminate flooring; Wood flooring; Other flooring
- Bathrooms: 1 full bathroom
- Heating & cooling: Ceiling fan(s)
- Interior features: Ceiling fan(s); Laminate, wood and other flooring; Crawl space basement
Neighborhood map
What this means for you Summary
Snapshot
- This is a 3-bed/1.0-bath single-family listed at $39k.
Deal economics
- At list price, monthly cash flow is $449 ($5k/yr) — positive.
- The deal already cash-flows at list — no discount required.
- Meets the 1% rule at list price ($961 rent vs $39k).
- Recommended offer: $38k (1.5% below list) — sets the bar for market timing.
Location & tenants
- Location reads: area grade B — affects rentability + tenant quality, not the cash-flow math above.
- Smyth County Public School District (rural): math 46% / reading 63% proficiency, ranked #89 of 131 in VA (top 68%) — acceptable for families but not a draw, mixed tenant base, ~2y average lease.
- Zoned schools: Saltville Elementary (math 52% / reading 62%, grade C+, #597 of 1,108 statewide, top 57%, 195 students, 102% FRL); Northwood Middle (math 42% / reading 67%, grade B-, #194 of 342 statewide, top 60%, 151 students, 86% FRL); Northwood High (math 62% / reading 77%, grade B, #159 of 319 statewide, top 53%, 240 students, 87% FRL) — zoned schools average 91% FRL vs 54% district-wide (38 pts higher); higher-poverty schools than district average — tighter screening recommended.
- Market conditions: 32 active listings in the ZIP; 38 units permitted in Smyth County in 2024 (0 in 5+ unit buildings).
Forward outlook
- In year one you build about $384 of equity ($270 loan paydown + $114 appreciation (0.3% local appreciation)).
- Smyth County population projected at -20% by 2050 — secular population decline; favor cash flow + early exit over multi-decade hold.
- At projected returns (0.3% appreciation + 3.0% rent growth), your $11k cash investment doubles in ~2 years — after that, you're playing with house money.
Negotiation context
- It's been on market 20 days — a 2% lower offer ($38k) is reasonable based on typical stale-listing flexibility.
Risks & watch-outs
- Watch-outs: flood insurance adds $66/mo; built in 1947 — expect roof / HVAC / electrical / plumbing capex.
- Climate carrying-cost: severe flood risk — expect insurance premiums to compound above CPI over the hold.
Questions for the listing agent
- Built in 1947 — when were the roof, HVAC, electrical panel, plumbing, and water heater last replaced?
- What's the actual annual flood-insurance premium (NFIP or private), and is the property in a SFHA with mandatory coverage?
- Is there a deadline driving the sale (1031 exchange, divorce, estate, relocation)? That informs how much negotiation room exists.
- What's the average days-on-market for RENTAL listings here right now (not sales)? A rising rental-DOM trend means longer vacancies and softer asking-rent achievability than the comps imply.
- What's the recent tenant-quality profile in this submarket — average credit score on applications, eviction rate, late-payment / NSF rate, and stable-employment percentage? A property-management company in the area should have these aggregated.
- How much new for-sale + rental construction is in the pipeline within 1–3 miles? Heavy new supply typically softens prices + rents 12–24 months out; constrained supply supports both.
Investment metrics
- 1% rule
- 2.46% ✓
- Cap rate
- 22.14%
- Cash-on-cash
- 56.61%
- DSCR
- 3.52
- GRM
- 3.4
CMA / ARV
- ARV (median comp)
- $41,179
- List price
- $39,000
- Delta
- -5.29%
- Verdict
- FAIR
- Comps
- 8 within 1.0 mi
Show comp detail 4 sales within ~0.75 mi
| Address | Dist | Beds/Ba | Sqft | Sold | Price | $/sf | Match |
|---|---|---|---|---|---|---|---|
| 164 Cardwell Town Rd | 0.15mi | 2/1.0 (-1) | 720 (-11%) | 2mo | $12,500 | $17 | 69 |
| 412 Cardwell Town Rd | 0.27mi | 2/1.0 (-1) | 800 (-1%) | 16mo | $56,000 | $70 | 68 |
| 220 Lick Skillet Rd | 0.35mi | 3/1.0 | 896 (+11%) | 7mo | $49,000 | $55 | 59 |
| 325 Lick Skillet Rd | 0.42mi | 2/1.0 (-1) | 907 (+12%) | 23mo | $31,500 | $35 | 35 |
Match score weights: distance 35% · size 25% · config 20% · recency 20%. Top-matched comps best support the ARV.
Projected returns pro-forma
0.29% appreciation · 3.0% rent growth · sell at horizon
- IRR
- 51.1%
- Equity multiple
- 3.57×
- Total profit
- $28,017
- Equity at exit
- $11,898
- IRR
- 53.4%
- Equity multiple
- 7.14×
- Total profit
- $67,091
- Equity at exit
- $14,768
Cash invested: $10,920 (down + closing). Projections, not guarantees.
Landlord ↔ Tenant lean methodology
- Overall (STATE)
- 55 Moderately Landlord-Leaning
- State Virginia
- 55 Moderately Landlord-Leaning · D+2
- County
- — inherits STATE
- City
- — inherits STATE
ZIP-level market 24370
- Home prices YoY
- 0.1%
- Active inventory
- 32
- Price-to-rent
- 3.4×
Monthly cashflow live
- Estimated rent
- $961 medium interval (Pro) →
- Mortgage (P&I)
- −$205
- Tax from tax record
- −$23 /mo · $276/yr
- Insurance
- −$16
- Flood insurance flood zone
- −$66 /mo · $798/yr
- HOA
- −$0
- Vacancy / Maint / Mgmt
- −$202
- Net cashflow
- $449
Break-even live
Sensitivity live
| Price | -10% $471 | -5% $460 | +0% $449 | +5% $438 | +10% $427 |
|---|---|---|---|---|---|
| Rent | -10% $373 | -5% $411 | +0% $449 | +5% $487 | +10% $525 |
| Rate | -1.0pp $468 | -0.5pp $459 | base $449 | +0.5pp $439 | +1.0pp $428 |
UW: 25.0% down · 7.5% · 30yr · 1.5% tax · 5.0% vac · 8.0% maint · 8.0% mgmt
Financing live
Cash to close
- Down payment
- $9,750
- Closing costs
- $1,170
- Reserves months
- —
- Total cash needed
- —
Loan-product check · same deal, 3 products live
Conventional
25% down · 7.5% · 30yr
- Down + closing
- —
- Monthly P&I
- —
- Monthly cashflow
- —
- DSCR
- —
- Eligible?
- —
Personal DTI + credit; lowest rate.
DSCR
20% down · 8.5% · 30yr
- Down + closing
- —
- Monthly P&I
- —
- Monthly cashflow
- —
- DSCR
- —
- Eligible?
- —
No personal income docs; deal must DSCR.
Hard money
10% down · 12.0% · 12mo
- Down + closing
- —
- Monthly P&I
- —
- Monthly cashflow
- —
- DSCR
- —
- Eligible?
- —
Short-term bridge; refi at stabilization.
Listing history 2 events
-
2026-04-29$39,000 Active 496-char remark
-
2010-07-02soldstatus $54,500
ⓘ Source: listings_history table (triggers on properties + properties_extension) + one-shot
backfill from property_details.listing_events for pre-trigger history.
Tax reassessment forecast VA · Resets to sale price
- Current annual tax
- $276 · $23/mo
- Projected year-2 tax
- $320 · $27/mo
- Expected delta
- +$44/yr (+$4/mo · 15.8%)
ⓘ Screening estimate from a state-policy table — verify with the county assessor before closing.
Climate risk First Street
- Flood 10/10 Extreme FEMA zone X (unshaded) · 99% chance over 30 yrs
- Wildfire 4/10 Moderate
- Heat 3/10 Moderate 8 d/yr ≥95°F today · 24 d/yr by 30 yrs out
- Wind 2/10 Low
- Air quality 1/10 Low 0 unhealthy d/yr today · 0 by 30 yrs out
Nearby sold comps map
Loading sold comps map…
Walkable amenities ~0.75 mi
Loading nearby amenities…
Taxation est. · year 1
- Rental income
- $11,529
- − Mortgage interest
- −$2,185
- − Property taxes
- −$276
- − Insurance
- −$992
- − Repairs & maintenance
- −$922
- − Management
- −$922
- − Depreciation
- −$1,135
- Taxable income
- $5,096
- Est. tax owed @ 24.0%
- −$1,223
- After-tax cash flow
- $4,162/yr
For passive investors: Depreciation is non-cash, so a rental often shows a tax loss while cash-flowing — sheltering income. Rental losses are passive: they offset passive income freely, and up to $25,000/yr can offset ordinary (W-2) income if you actively participate and your MAGI is under $100k (phasing out to $0 by $150k); unused losses carry forward. On sale, claimed depreciation is recaptured at up to 25%, and gains may owe capital-gains tax (a 1031 exchange can defer both). Figures are a year-1 estimate at your 24.0% rate — not tax advice; consult a CPA.
Schools (NCES district)
- District
- Smyth County Public School District
- NCES district ID
- 5103520
- Math proficiency
- 46% ▼ -38.00%
- Reading proficiency
- 63% ▼ -14.00%
- Median HH income
- $36,901
- Composite
- 45.2/100
- National rank
- #2672
- State rank
- #89 of 131 in VA
Livability — Allison Gap
No livability data for this city. (Only ~50 U.S. cities are tracked.)
Census & demographics
- Census place
- Allison Gap, VA
- Population (ZIP)
- 5,740
Population outlook (Smyth County) Hauer SSP2
- Today (2025)
- 29,740 people
- By 2030
- 28,593 · -3.9%
- By 2040
- 26,091 · -12.3%
- By 2050
- 23,629 · -20.5%
- By 2075
- 18,365 · -38.2%
- By 2100
- 13,697 · -53.9%
Race, ethnicity, and origin ACS 2023
- Neighborhood character
- Predominantly White (98%)
- Race & ethnicity
- White 98% Hispanic / Latino 2%
- Common ancestry
- Serbian 2% Slovak 2% Italian 1%
- Foreign-born
- 1% · Canada
- Languages at home
- 99% English-only · Spanish 1%
Political lean MEDSL · Smyth
- 2024 margin
- Solid R (+60.5) · D 19.4% · R 79.9%
- 2008→2024 swing
- -31.4pp toward R · 2008: -29.1pp · 2024: -60.5pp
- All cycles
- 2024: R+60.5 2020: R+56.3 2016: R+55.2 2012: R+33.0 2008: R+29.1
Not yet ingested
- Civics
- —
Market trends
- HPI YoY
- ▲ 0.29%
- Current HPI
- 218.7537
- Rent YoY
- —
- Metro
- —
- State GDP YoY
- ▲ 2.40%
- F500 in state
- 50
Industry mix (Fortune 500 HQ in VA)
| Industry | F500 HQs | Revenue |
|---|---|---|
| Aerospace / Defense | 4 | $236B |
|
||
| Technology / Defense | 3 | $32B |
|
||
| Financial Services | 2 | $176B |
|
||
| Utilities | 2 | $27B |
|
||
| Insurance | 2 | $25B |
|
||
| Technology | 2 | $15B |
|
||
Price history
-28.4% since first listed3 events — show timeline
- 2026-05-19 Pending — SWVAR
- 2026-04-29 Listed $39,000 SWVAR
- 2010-07-02 Sold (Public Records) $54,500 Public Records
Property tax history
+0.5%/yrLatest (2025): $276 · +0.0% YoY. Source: county tax records.
Cash-flow waterfall
monthlySold comps — $/sqft
last 12 mo · ≤1 miLoading sold comps…