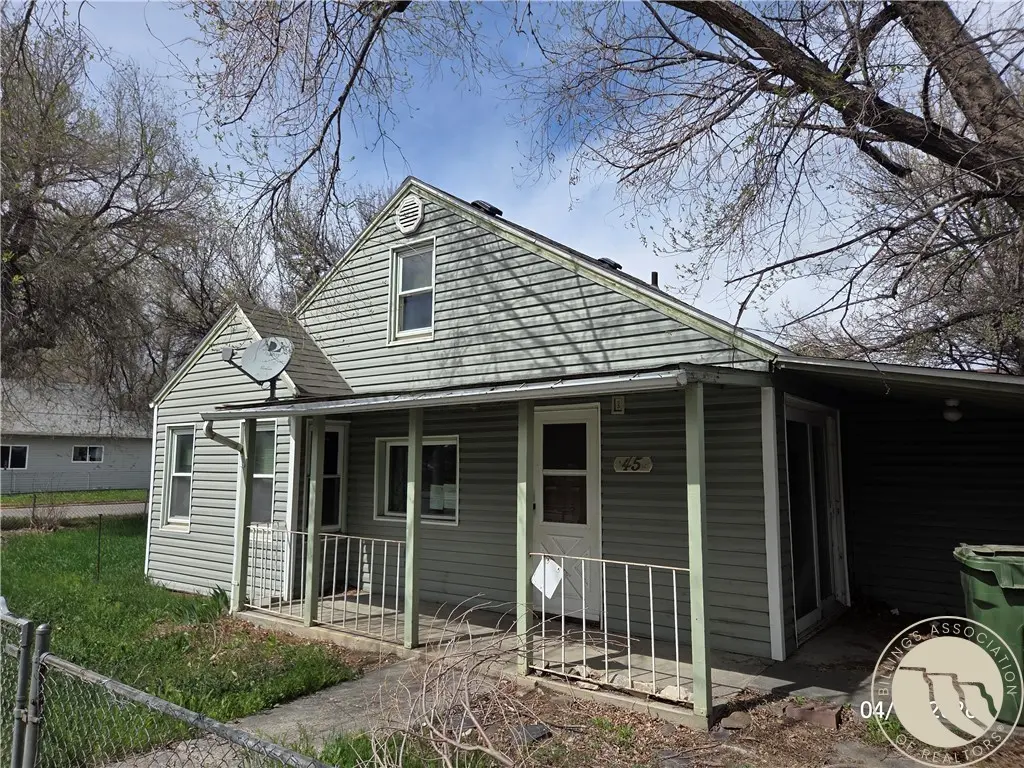
45 Jackson St · Billings, MT
Flood risk 1/10 · Minimal
- FEMA flood zone
- X (unshaded)
- Chance of flooding over 30 yrs
- 0.0%
- Est. flood insurance / yr
- $507 – $1,088
Fire risk 2/10 · Minimal
- Est. fire insurance / yr
- $918 – $1,706
Heat risk 3/10 · Minor
- Hot days now (above 95°F)
- 7 days/yr
- Hot days in 30 yrs
- 15 days/yr
Wind risk 1/10 · Minimal
- Chance of severe wind over 30 yrs
- —
Air-quality risk 4/10 · Minor
- Unhealthy air days now
- 3 days/yr
- Unhealthy air days in 30 yrs
- 5 days/yr
Risk factors via First Street. Map © Google.
Why this score? — see what drove the C+ grade
The composite is a weighted blend of 9 inputs, each scored 0–100. Each bar is that input's sub-score; the figure is the points it added to the 100-point composite (weight × sub-score).
- Cash flow +25.9/30.0
- DSCR +8.7/10.0
- ARV discount +7.5/15.0
- 1% rule +6.6/10.0
- Livability +4.0/5.0
- Rent growth +3.5/5.0
- Schools +3.2/10.0
- Condition / age +2.5/5.0
- Appreciation +0.0/10.0
$99,900
🖨 Deal sheet 📄 Offer letter ✓ Due diligence
Key facts
- Porch
- Fenced yard
- Corner lot
Tags
Property features AI
Exterior
- Parking: No on-site parking
- Utilities: Public water; Public sewer
- Home design: Single-family residence; Residential property; Above-grade finished area reported
- Exterior features: Corner lot; No fencing
Interior
- Bedrooms: 1 bedroom on the main level
- Bathrooms: 1 full bathroom on the main level
- Heating & cooling: Heating present (type listed as Other); No cooling
- Interior features: Partial basement
Neighborhood map
What this means for you Summary
Snapshot
- This is a 2-bed/1.0-bath single-family listed at $100k.
Deal economics
- At list price, monthly cash flow is $246 ($3k/yr) — positive.
- The deal already cash-flows at list — no discount required.
- Meets the 1% rule at list price ($1k rent vs $100k).
- Recommended offer: $94k (6.0% below list) — sets the bar for market timing.
- Cap rate 9.2% vs local median 3.0% in Billings — top-decile yield for the area; either an underpriced asset or a hidden risk that comps aren't pricing in. Stress-test before assuming the spread holds.
Location & tenants
- Location reads 80/100 on livability (#10 in MT, #1,830 nationally) — a professional / high-income tenant draw. Strengths: amenities A+, commute A+, housing A+; Watch: schools D+, crime F.
- Billings H S (urban): math 29% / reading 45% proficiency, ranked #69 of 116 in MT (top 60%) — families likely to look elsewhere, expect single-tenant / working-renter base with shorter leases.
- Market conditions: Rents rising (+4.0%/yr); 279 active listings in the ZIP; 22 comparable units currently listed for rent nearby; rentals leasing fast (median 13d on market — plan ~1-2 weeks tenant-placement turnaround); 1,401 units permitted in Yellowstone County in 2024 (281 in 5+ unit buildings).
Forward outlook
- Local home prices are declining (-3.0%/yr); year-one equity from $691 of loan paydown is wiped out by about $3k of value loss. Plan a longer hold.
- Yellowstone County population projected at +26% by 2050 — long-run rental-demand tailwind backs the buy-and-hold thesis.
- At projected returns (-3.0% appreciation + 4.0% rent growth), your $28k cash investment doubles in ~10 years — after that, you're playing with house money.
Negotiation context
- It's been on market 61 days — a 6% lower offer ($94k) is reasonable based on typical stale-listing flexibility.
Risks & watch-outs
- Watch-outs: built in 1930 — expect roof / HVAC / electrical / plumbing capex.
Questions for the listing agent
- It's been on market 61 days. Have you received any prior offers? Is the seller open to a 6% concession, seller financing, or rate buy-down credit?
- Built in 1930 — when were the roof, HVAC, electrical panel, plumbing, and water heater last replaced?
- Why hasn't it sold? Are there any deal-killer items the seller is aware of (foundation, flood, title, zoning, code violations)?
- Is there a deadline driving the sale (1031 exchange, divorce, estate, relocation)? That informs how much negotiation room exists.
- Schools are D-rated, which usually means shorter tenancies and higher turnover. Who's the typical renter profile here, and what's been the actual vacancy rate?
- Crime grade is F in this area — have there been break-ins, vandalism, or insurance claims at this property in the last 3 years? What carrier currently insures it and at what premium?
- What's the average days-on-market for RENTAL listings here right now (not sales)? A rising rental-DOM trend means longer vacancies and softer asking-rent achievability than the comps imply.
- What's the recent tenant-quality profile in this submarket — average credit score on applications, eviction rate, late-payment / NSF rate, and stable-employment percentage? A property-management company in the area should have these aggregated.
- How much new for-sale + rental construction is in the pipeline within 1–3 miles? Heavy new supply typically softens prices + rents 12–24 months out; constrained supply supports both.
Investment metrics
- 1% rule
- 1.16% ✓
- Cap rate
- 9.25%
- Cash-on-cash
- 10.55%
- DSCR
- 1.47
- GRM
- 7.2
CMA / ARV
- ARV (on-the-fly)
- $227,010
- Comps found
- 12
Show comp detail 12 sales within ~0.75 mi
| Address | Dist | Beds/Ba | Sqft | Sold | Price | $/sf | Match |
|---|---|---|---|---|---|---|---|
| 4107 Roosevelt Ave | 0.04mi | 2/1.0 | 988 (+2%) | 10mo | $99,000 | $100 | 86 |
| 118 Monroe St | 0.06mi | 1/1.0 (-1) | 904 (-6%) | 4mo | $219,900 | $243 | 78 |
| 36 Monroe St | 0.05mi | 2/2.0 | 864 (-11%) | 0mo | $238,000 | $275 | 76 |
| 137 Jefferson | 0.17mi | 2/1.0 | 866 (-10%) | 3mo | $195,000 | $225 | 72 |
| 412 S 34th St | 0.46mi | 2/1.0 | 1,000 (+4%) | 6mo | $245,000 | $245 | 68 |
| 449 Orchard Ln | 0.70mi | 2/1.0 | 971 (+0%) | 2mo | $145,000 | $149 | 65 |
| 608 S 34th St | 0.46mi | 2/1.0 | 1,040 (+8%) | 2mo | $189,900 | $183 | 64 |
| 4232 Bruce Ave | 0.42mi | 3/1.0 (+1) | 1,028 (+6%) | 11mo | $282,500 | $275 | 56 |
| 612 S 32nd St | 0.61mi | 2/1.5 | 1,066 (+10%) | 7mo | $225,000 | $211 | 47 |
| 506 S 30th St | 0.75mi | 3/1.0 (+1) | 1,040 (+8%) | 2mo | $259,000 | $249 | 46 |
| 212 S 31st St | 0.71mi | 3/1.0 (+1) | 852 (-12%) | 1mo | $200,000 | $235 | 42 |
| 507 S 31st St | 0.70mi | 2/1.0 | 837 (-13%) | 6mo | $149,900 | $179 | 40 |
Match score weights: distance 35% · size 25% · config 20% · recency 20%. Top-matched comps best support the ARV.
Projected returns pro-forma
-3.0% appreciation · 3.96% rent growth · sell at horizon
- IRR
- 0.6%
- Equity multiple
- 1.02×
- Total profit
- $603
- Equity at exit
- $14,895
- IRR
- 11.1%
- Equity multiple
- 1.91×
- Total profit
- $25,424
- Equity at exit
- $8,638
Cash invested: $27,972 (down + closing). Projections, not guarantees.
Landlord ↔ Tenant lean methodology
- Overall (STATE)
- 82 Strongly Landlord-Friendly
- State Montana
- 82 Strongly Landlord-Friendly · R+11
- County
- — inherits STATE
- City
- — inherits STATE
ZIP-level market 59101
- Rents YoY
- 4.0%
- Active inventory
- 279
- Price-to-rent
- 7.2×
Monthly cashflow live
- Estimated rent
- $1,157 high interval (Pro) →
- Mortgage (P&I)
- −$524
- Tax from tax record
- −$103 /mo · $1,230/yr
- Insurance
- −$42
- HOA
- −$0
- Vacancy / Maint / Mgmt
- −$243
- Net cashflow
- $246
Break-even live
UW: 25.0% down · 7.5% · 30yr · 1.5% tax · 5.0% vac · 8.0% maint · 8.0% mgmt
Financing live
Cash to close
- Down payment
- $24,975
- Closing costs
- $2,997
- Reserves months
- —
- Total cash needed
- —
Loan-product check · same deal, 3 products live
Conventional
25% down · 7.5% · 30yr
- Down + closing
- —
- Monthly P&I
- —
- Monthly cashflow
- —
- DSCR
- —
- Eligible?
- —
Personal DTI + credit; lowest rate.
DSCR
20% down · 8.5% · 30yr
- Down + closing
- —
- Monthly P&I
- —
- Monthly cashflow
- —
- DSCR
- —
- Eligible?
- —
No personal income docs; deal must DSCR.
Hard money
10% down · 12.0% · 12mo
- Down + closing
- —
- Monthly P&I
- —
- Monthly cashflow
- —
- DSCR
- —
- Eligible?
- —
Short-term bridge; refi at stabilization.
Rent comps 22 comps
| Address | Beds | Baths | Sqft | Rent | $/sqft | DOM | Units | Dist |
|---|---|---|---|---|---|---|---|---|
| 3707 2nd Ave S Billings, MT | 2.0 | 1.0 | 650 | $850 | $1.31 | 20d | 1 | 0.37mi |
| 613 S 34th St Billings, MT | 1.0 | 1.0 | 714 | $1,100 | $1.54 | 20d | 1 | 0.51mi |
| 238 Terry Ave Unit 2 Billings, MT | 2.0 | 1.0 | 768 | $1,275 | $1.66 | 13d | 1 | 0.60mi |
| 238 Terry Ave Unit 1 Billings, MT | 2.0 | 1.0 | 768 | $1,475 | $1.92 | 13d | 1 | 0.60mi |
| 129 Broadwater Ave Unit B Billings, MT | 1.0 | 1.0 | 850 | $885 | $1.04 | 13d | 1 | 0.68mi |
| 3409 1st Ave N Billings, MT | 1.0 | 1.0 | 600 | $895 | $1.49 | 13d | 1 | 0.72mi |
| 115 N 35th St Billings, MT | 1.0 | 1.0 | 1000 | $1,500 | $1.50 | 13d | 1 | 0.73mi |
| 421 5th St W Billings, MT | 1.0 | 1.0 | 778 | $975 | $1.25 | 13d | 1 | 0.78mi |
| 318 Yellowstone Ave Billings, MT | 2.0 | 1.0 | 1000 | $950 | $0.95 | 13d | 1 | 0.87mi |
| 635 Cook Ave Billings, MT | 2.0 | 1.0 | 894 | $975 | $1.09 | 13d | 1 | 0.89mi |
| 715 S 28th St Billings, MT | 1.0–2.0 | 1.0 | 617 | $1,343 | $2.17 | 13d | 6 | 0.95mi |
| 414 1/2 7th St W Billings, MT | 2.0 | 1.0 | 832 | $955 | $1.15 | 13d | 1 | 1.00mi |
| 743 Cook Ave Apt B Billings, MT | 2.0 | 1.0 | 900 | $1,400 | $1.56 | 13d | 1 | 1.02mi |
| 107 N Broadway Billings, MT | 2.0 | 1.0 | 626 | $1,021 | $1.63 | 13d | 1 | 1.10mi |
| 634 1/2 Lewis Ave Billings, MT | 1.0 | 1.0 | 668 | $850 | $1.27 | 13d | 1 | 1.22mi |
| 708 N 31st St Billings, MT | 1.0 | 1.0 | 700 | $995 | $1.42 | 13d | 1 | 1.22mi |
| 828 Broadwater Ave Billings, MT | 2.0 | 1.0 | 650 | $1,095 | $1.68 | 13d | 1 | 1.24mi |
| 300 N 25th St Apt 505 Billings, MT | 2.0 | 1.0 | 1000 | $1,250 | $1.25 | 13d | 1 | 1.32mi |
| 520 Avenue B Unit B Billings, MT | 2.0 | 1.0 | 936 | $1,195 | $1.28 | 13d | 1 | 1.35mi |
| 2403 2nd Ave N Billings, MT | 1.0 | 1.0 | 600 | $1,150 | $1.92 | 20d | 1 | 1.35mi |
| 2310 1st Ave N Billings, MT | 2.0 | 1.0–2.0 | 915 | $2,025 | $2.21 | 13d | 1 | 1.37mi |
| 115 N 24th St Billings, MT | 1.0 | 1.0 | 587 | $1,112 | $1.89 | 13d | 2 | 1.37mi |
Listing history 19 events
-
2026-06-19days on market $99,900 Active 61 DOM
-
2026-06-18days on market $99,900 Active 60 DOM
-
2026-06-17days on market $99,900 Active 59 DOM
-
2026-06-16days on market $99,900 Active 58 DOM
-
2026-06-15days on market $99,900 Active 57 DOM
-
2026-06-14days on market $99,900 Active 55 DOM
-
2026-06-13days on market $99,900 Active 54 DOM
-
2026-06-10days on market $99,900 Active 52 DOM
-
2026-06-09days on market $99,900 Active 51 DOM
-
2026-06-08days on market $99,900 Active 50 DOM
-
2026-06-07days on market $99,900 Active 49 DOM
-
2026-06-05pricedays on market $99,900 Active 46 DOM
-
2026-06-02days on market $109,900 Active 44 DOM
-
2026-06-01days on market $109,900 Active 43 DOM
-
2026-05-31days on market $109,900 Active 42 DOM
-
2026-05-30days on market $109,900 Active 41 DOM
-
2026-04-20$109,900 Active
-
2025-09-15price $109,900
-
1996-12-13soldstatus
ⓘ Source: listings_history table (triggers on properties + properties_extension) + one-shot
backfill from property_details.listing_events for pre-trigger history.
Tax reassessment forecast MT · Resets to sale price
- Current annual tax
- $1,230 · $103/mo
- Projected year-2 tax
- $1,230 · $103/mo
- Expected delta
- $0/yr ($0/mo · 0.0%)
ⓘ Screening estimate from a state-policy table — verify with the county assessor before closing.
Climate risk First Street
- Flood 1/10 Low FEMA zone X (unshaded) · 0% chance over 30 yrs
- Wildfire 2/10 Low
- Heat 3/10 Moderate 7 d/yr ≥95°F today · 15 d/yr by 30 yrs out
- Wind 1/10 Low
- Air quality 4/10 Moderate 3 unhealthy d/yr today · 5 by 30 yrs out
Nearby sold comps map
Loading sold comps map…
Walkable amenities ~0.75 mi
Loading nearby amenities…
Taxation est. · year 1
- Rental income
- $13,882
- − Mortgage interest
- −$5,596
- − Property taxes
- −$1,230
- − Insurance
- −$500
- − Repairs & maintenance
- −$1,111
- − Management
- −$1,111
- − Depreciation
- −$2,906
- Taxable income
- $1,429
- Est. tax owed @ 24.0%
- −$343
- After-tax cash flow
- $2,607/yr
For passive investors: Depreciation is non-cash, so a rental often shows a tax loss while cash-flowing — sheltering income. Rental losses are passive: they offset passive income freely, and up to $25,000/yr can offset ordinary (W-2) income if you actively participate and your MAGI is under $100k (phasing out to $0 by $150k); unused losses carry forward. On sale, claimed depreciation is recaptured at up to 25%, and gains may owe capital-gains tax (a 1031 exchange can defer both). Figures are a year-1 estimate at your 24.0% rate — not tax advice; consult a CPA.
Schools (NCES district)
- District
- Billings H S
- NCES district ID
- 3003900
- Math proficiency
- 29% ▼ -4.00%
- Reading proficiency
- 45% ▲ 2.00%
- Median HH income
- $49,863
- Composite
- 31.93/100
- National rank
- #5848
- State rank
- #69 of 116 in MT
Livability — Billings
- Score
- 80/100
- State rank
- #10
- US rank
- #1830
Category grades
Schools grade is shown separately in the Schools card above.
Census & demographics
- Census place
- Billings, MT
- County
- Yellowstone County · 159,426 people
- City population
- 147,124
- Metro
- Billings, MT
- Population (ZIP)
- 42,250
- Household income
- $58,598
- Rent vs Own
- Severe rent burden
- 1534.0
Population outlook (Yellowstone County) Hauer SSP2
- Today (2025)
- 176,227 people
- By 2030
- 185,619 · +5.3%
- By 2040
- 203,543 · +15.5%
- By 2050
- 221,100 · +25.5%
- By 2075
- 266,931 · +51.5%
- By 2100
- 301,141 · +70.9%
Race, ethnicity, and origin ACS 2023
- Neighborhood character
- Predominantly White (75%)
- Race & ethnicity
- White 75% Hispanic / Latino 9% Native American 9% Two or more races 8% Black 1%
- Hispanic origin (detail)
- Mexican 6%
- Common ancestry
- Portuguese 6% Italian 2% Lithuanian 2%
- Foreign-born
- 2% · Canada
- Languages at home
- 96% English-only · Spanish 1%
Political lean MEDSL · Yellowstone
- 2024 margin
- Strong R (+27.1) · D 34.9% · R 62.0% · Other 3.1%
- 2008→2024 swing
- -20.8pp toward R · 2008: -6.3pp · 2024: -27.1pp
- All cycles
- 2024: R+27.1 2020: R+24.0 2016: R+27.1 2012: R+20.6 2008: R+6.3
Not yet ingested
- Civics
- —
Market trends
- HPI YoY
- ▼ -191.74%
- Current HPI
- 201.7039
- Rent YoY
- ▲ 3.96%
- Metro
- Billings, MT
- State GDP YoY
- ▲ 3.41%
- F500 in state
- 2
Industry mix (Fortune 500 HQ in MT)
| Industry | F500 HQs | Revenue |
|---|---|---|
| Technology / Analytics | 1 | $2B |
|
||
Price history
+0.0% since first listed3 events — show timeline
- 2026-04-20 Listed $109,900 BMTMLS
- 2025-09-15 Price Changed $109,900 BMTMLS
- 1996-12-13 Sold (Public Records) — Public Records
Property tax history
+16.5%/yrLatest (2025): $1,230 · -7.2% YoY. Source: county tax records.
Cash-flow waterfall
monthlySold comps — $/sqft
last 12 mo · ≤1 miLoading sold comps…